EOSUSDT DailyHello, thank you very much for supporting me by liking and commenting on our self-sacrificing analysis.
If you have a different analysis or you can send your ideas and questions to the comments section.
Good luck.
EOSUST trade ideas

Nice bounce on eoseos has hit my first target, i hope u got in on my earlier call when i called the bottom
looking good now

EosOK! 📉📈
Simply analyze.
Look at the previous analysis. Set stop loss and profit.
Share this post for your friends and Good luck.


time to long eos to the moonbreak out it's trend line,we can see some bulish side after huge correction
mid-term target is 6-7$ and long term target is 13-14$

Possible growth for EOSAs the volume increases in the upward move, It is possible that EOS meet 2.676 in the specified area of Fibonacci and Gann Fan

Eos 4 year accumulationeos is looking great to accumulate down here,
could potentially be close to breaking the down trend
eos could be due for a huge move soon, been in this range now for 4 years!

EOSEOS currency rejects its resistance in 4h time and after pullback can be a good option to buy with R, R approximately 1 to 5 Do not forget the loss limit

EosThat is my opinion.
Btc has serious resistance in the price of 45, so
Be careful and take risk management.

EOSUSDT H1SELL ENTRY @2.462
STOP LOSS@2.591
TAKE PROFIT@2.457
Market Update (Looking to Long)
Like and Subscribe
Thank you
Please support our analysis with a like or comment!

The EOS trend has reversed, and investors are now aiming for $10EOS coin saw a reversal bounce back from the 2022 year’s low and has gained nearly 35% of its value since last week.
The EOS coin is observing a retracement phase today near the 100-day moving average in terms of the daily price chart.
On March 16, the EOS token showed a bullish signal by breaking above the 20-day EMA in the context of the daily price chart. So far, the crypto manages to move above the 20 and 50-EMA, but today the bears are looking aggressive near the 100-EMA (Yellow). The bulls need to push the coin price above this bullish barrier.
Stoch RSI is observing flat into the overbought territory in terms of the daily price chart, where the simple RSI turned its peak to the downside, and now it is at 65-mark. Both of the RSI may impact the bullish trend.
The Average Directional Index (ADX) is slowly moving up and is following an upward trendline, which indicates strength in momentum for the EOS coin.
A retracement phase exists after a sharp rise, where EOS bulls should wait for this pullback to end. Buyers above the 100 EMA line will turn aggressive.
Support level - $1.80 and $1.5
Resistance level - $3.0 and $5.5

Short Signal For eos !#harmonicsignal #Crypto
EOS/USDT (Futures) Update
⬇️Short Signal
Entry at 2.57
⭕️SL @2.65
🔵TP1 @2.3
🔵TP2 @2.14
Move your SL to entry level after tp1 hitted.
Take out 75% at tp1 remaining for tp2
Only Risk 1% of your Equity.

$EOS very strongBe patient pay attention to resistance levels we might have some corrections there
even tho this token is a strong fundamentally and technically token at the moment
my buy orders will be around the green marks on my chart

EOSUSDT Analysis (perspective a couple of months)Hello friends.
Please support my work by clicking the LIKE button👍(If you liked). Also i will appreciate for ur activity. Thank you!
Everything on the chart.
Upward movement from the current price or through 1.8$.
Entry: market and lower
Target: 3 - 4 - 5
after first target reached move ur stop to breakeven
Stop: (depending of ur risk). ALWAYS follow ur RM .
risk is justified
Good luck everyone!
Follow me on TRADINGView, if you don't want to miss my next analysis or signals.
It's not financial advice.
Dont Forget, always make your own research before to trade my ideas!
Open to any questions and suggestions.

EOS USDT Short SetupEOS retracement is expected provides opportunity for quick short trades.
DYOR, NFA

#EOS #blockchain #eoshindi #EOSIOIn my opinion, a resistance of 2.61 - 2.53 will prevent the price from rising
1) Important resistance range
2) The formation of negative divergence
3) The price reaches the saturation zone of the purchase
Current Support: 2.21 - 2.15
Next Support: 2.09 - 2.04
Current resistance: 2.61 - 2.53
The offer is not for sale or purchase and is only a personal opinion.

🔥 EOS Entering All-Time Low Area: Reversal PotentialEOS has been a very weak token this current bull-cycle. Where other tokens see returns well above >50x, EOS struggled to make a 10x in the same time period. Furthermore, EOS has been in a huge down trend since topping in early May last year.
However, we might see some kind of relief bounce occurring in the near future. EOS is currently trading near the all-time lows, which should classically offer quite some support.
My ideal buy-in area would be between $1.6 and $1.3. In case we get more downside in the coming weeks, keep an eye out for EOS for a decent 2x-3x.
Happy trading!

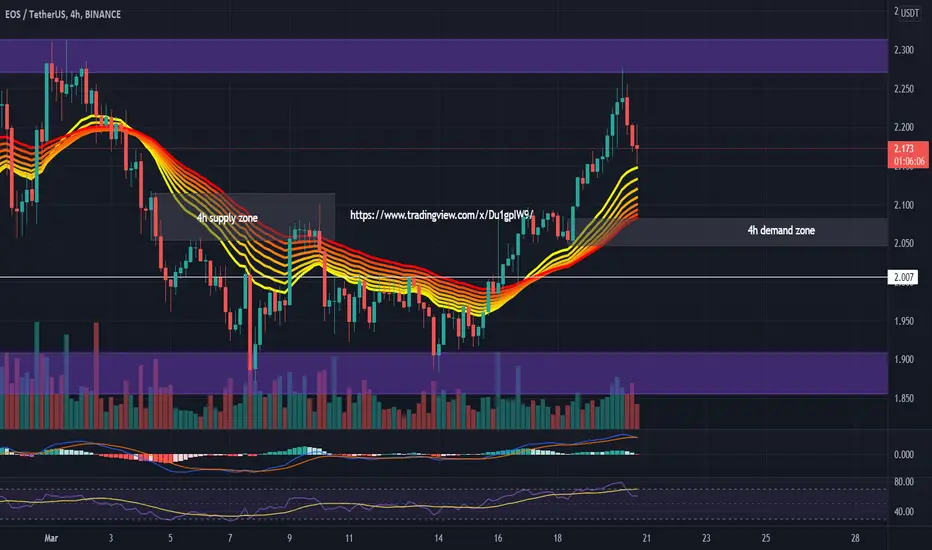
#EOSUSDT 4H Chart
Price got rejected heavily from the resistance area at $2.27 and it is currently moving down. MACD is preparing to turn bearish, RSI is bought and EMAs are bullish. I am expecting price to reach the 4h demand zone at $2.08 before continuing with the bullish movements. We would be looking to long from that area depending on overall market conditions.
EOS looking good eos is looking great to accumulate down here,
could potentially be close to breaking the down trend


EOS/USDT TRADE SETUPHi guys, This is CryptoMojo, One of the most active tradingview authors and fastest-growing communities.
Do consider following me for the latest updates and Long /Short calls on almost every exchange.
I post short mid and long term trade setups too.
Let’s get to the chart!
I have tried my best to bring the best possible outcome in this chart, Do not consider it as financial advice.
BABYDOGE is making this falling wedge pattern.
Entry- $2.1 - $2.03
TARGET- 70%
SL- Break and close below $1.9
This chart is likely to help you in making better trade decisions, if it did do consider upvoting this chart.
Would also love to know your charts and views in the comment section.
Thank you

EOSUSDT Technical AnalysisHIGHER TIMEFRAME
-Major Support/Demand Area
-I agree with looking for buys when the price
is down inside the yellow box.
-Use a smaller timeframe for confirmation.
LOWER TIMEFRAME (4hr)
-Use the 4hr timeframe
for confirmation/entry timeframe.
-Waiting for downward trend lines to break
and opposing zones to be removed.
-If you go down to the 4hr, you will see
previous zones work.

EOS/USDT Secondary trend. Triangle. Pivot area. Price 5.19A triangle has formed in the secondary trend. Volatility decreases, the price is clamped. Potential reversal zone. At the moment now the price is $ 5.19
Coin at Coenmarket: EOS
Past trading idea (this is a continuation of the trend).
EOS/USDT Secondary trend.Wedge
