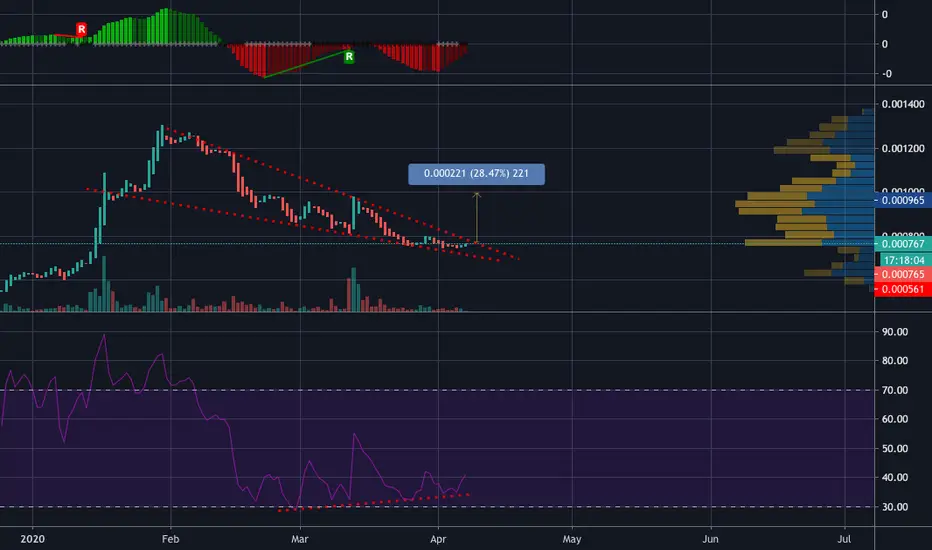
$ETC : falling wedge breaking on old support ? $ETC seems legit now :
- 0.618 Fib
- Old Support
- Falling Wedge is breaking
Not a Financial Advice
ETCBTC trade ideas

ETCBTC - we are at the crossroad?Very simple chart showing where we are now. The level we are at is huge and proven to be a huge pivot point in the past. If the support holds we should get impulsive move up. If it fails we should get an impulsive move down.
Let's see which way it will go.

Ethereum classic setting descending triangle- ETC creating a descending traingle, which usually have the tendency to break to the downside
- Volume is nowhere to be seen, will need a spike upon breakout if we want to see a sharp move
Breakdown target: daily resistance @640 satoshi's
Breakout target: weekly resistance @946 satoshi's


ETC setting up for a 17% gain#ETCBTC $ETC beautiful set up for a 17% GAIN
Stock BULLISH
RSI Bullish
PRICE ACTION BULLISH
2.5 RR
Trade at your own risk! Not a financial advice

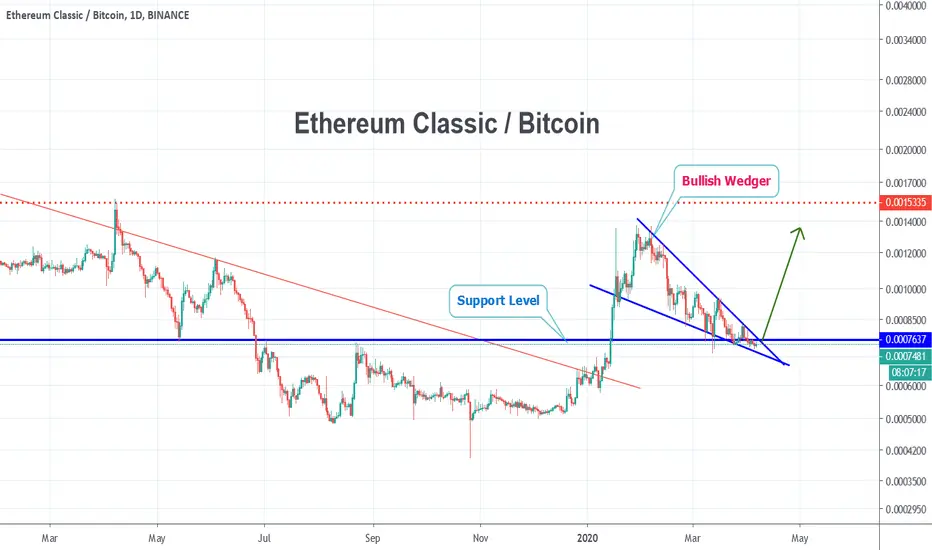
ETC Trading PlanHello Traders,
The ETC is close to a support level and is forming a high wedge formation. It looks like it is close to making an upward movement soon.
We recommend opening the long position if it breaks the high wedge above the support level. It would be a great opportunity for low risk with a potential high profit trade.
Please hit the like button and follow us on Tradeview.
Descending Triangle on ETC - Two ScenariosWe will look at Ethereum Classic here from a technical analysis point of view and discuss two different scenarios based on the descending triangle pattern.
The bullish scenario:
Let's look at the upper line of resistance here. If ETC can break through the upper resistance line of the triangle, we can expect a very bullish continuation of the price. Don't place your long order before it breaks through the line completely as the triangle can push the price down again near this area.
The bearish scenario:
The second important area is the trendline. If ETC can break through the lower trendline of the triangle, we can expect a bearish continuation of the price. Don't place your shorts before it breaks through the line completely as the triangle can push the price up again near this area.
Follow me for consistent high quality updates, with clear explanations and charts.
Please like this post to support me.
- Trading Guru
Highlighted recent success story:

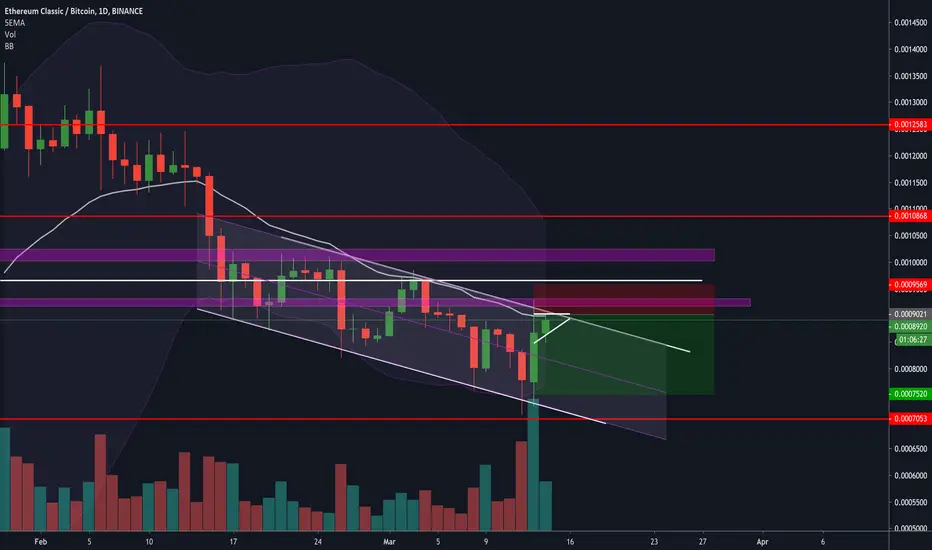
BULLISH Descending wedge, coming up to support on the dailyWe're coming to the end of a ~2 month descending wedge as well as ~0.0007300 support level.
Looking to see a retest of the 0.0009 and 0.001 levels again.

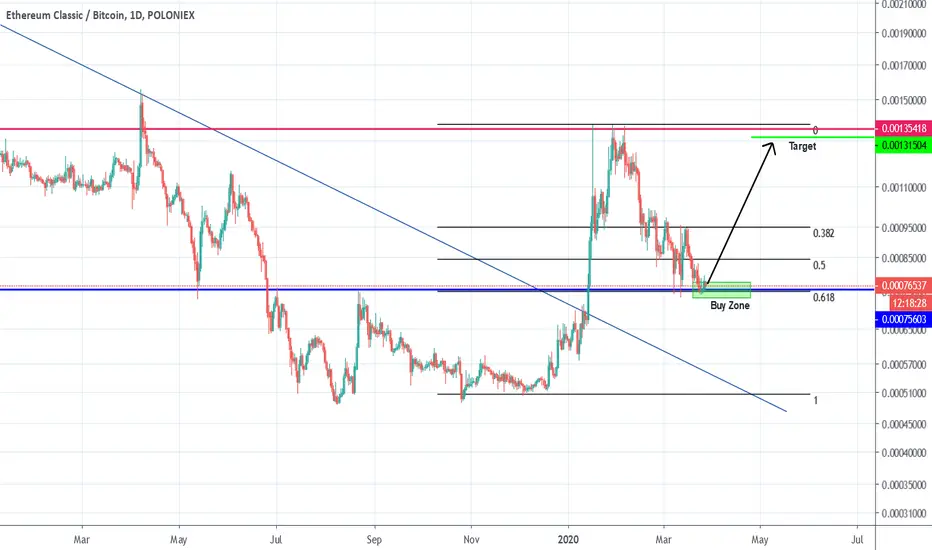
Ethereum Classic is in a Great Buy ZoneHello Traders,
Etc is in a excelant buy zone. It corrected from its previous upward movement to the 0.618 of Fibonacci and now it is above an important support zone. There is a high probability to this asset restart its upward trend.
Please push like button and follow us on tradingview.
ETC/BTC (4H Trend Change: up to 15% profit)ETC/BTC
ETC just shifted the 4H trend to an uptrend market after breaking a minor resistance line and making a fresh Higher High.
If we see a pullback down to 8000 sats area, it will a good opportunity for Long entries and target the upside range 9000 sats area.
The key stop-loss is below 50MA.

ETCBTC 240 BinanceEthereum Classic / BTC 240 Binance
ETC testing the bottom of the current range, while respecting the short term down trend.
As price gets squeezed here I will be watching for a potential long opportunity if we break trend and create a higher low on the retest.
(If price breaks to the down side there will be no trade)
Will be watching for 2 things on the break, volume and bullish candlestick structure. For example a bullhammer to break trend, followed by a small pull back and a bullish engulfing. (which would be my entry signal)
If the break is weak, with low volume and wicks to the upside, there will be no entry.
If the retest is still towards the bottom of this range it will give a good RRR to enter, around 3.5:1.
Time frame: I think this trade could take 9-10 days to complete.
I will manage my risk on the trade by moving my stop to break even as price reaches take profit 1.

ETCBTC Just Got Its Horizontal Support Zone Confirmed [BULLISH]I was looking at this support zone for a while now. After a 6% price gain in about 24h, the price kept dropping and dropping rapidly. Finally it found support which made the bears temporarily leave.
I see two important resistance zones directly above it, to which I expect the price to increase. Now that the hit of the support zone seems like a possible reversal moment, I expect the price to reach above the resistance level 1 with a bit of struggle. Then, with an S/R flip I expect resistance level 1 to act as support to go to resistance level 2.
Follow me for consistent high quality updates, with clear explanations and charts.
Please like this post to support me.
- Trading Guru
--------------------------------------------------------------
Disclaimer!
This post does not provide financial advice. It is for educational purposes only!
About the links below:
20% Discount on Binance: Did you know that Binance introduced a new system where you can get 20% discount on your fees? Find the step-by-step guide on how to add it to your account on the website of 100eyes
Forex & Crypto Scanner: Nobody can keep track of all the pairs on all timeframes. This scanner works on Telegram and sends an automated message including a chart every time something happens to a coin. E.g. it can automatically detect areas of support and resistance, RSI Divergences, Fib Retracements, and more.
Also, check my recent popular ideas on BTC:


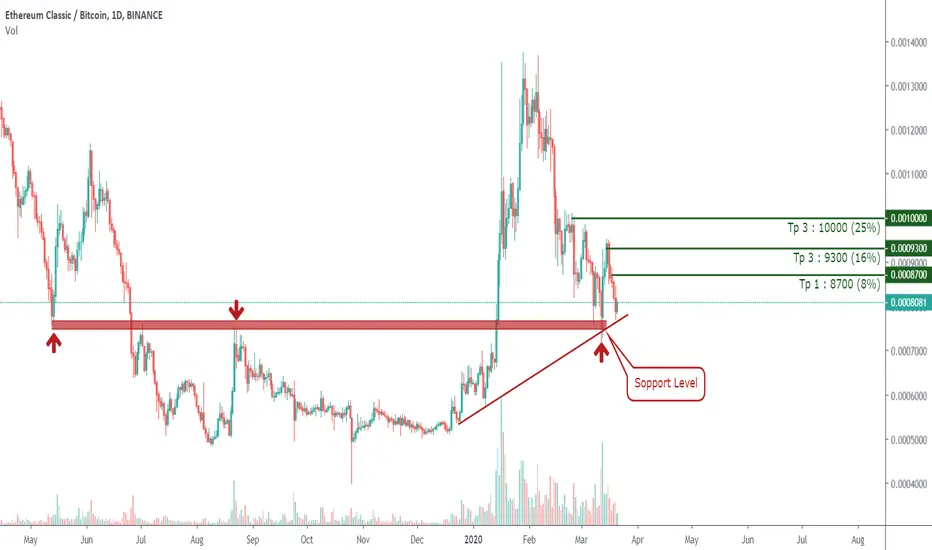
ETC On a Strong Support Level ETC / BTC
Exchange : BINANCE
▶️ Buy : 8080
👇 Targets :
✅ Tp 1 : 8700 (8%)
✅ Tp 2 : 9300 (16%)
✅ Tp 3 : 10000 (25%)
🔴 Stop loss zone : 7450 ~ 7400
ETC Long from OBWaiting for it to test the 4hr order block and long from there, tight stop incase it breaks the OB and then reassess

ETC is a good design for continued growth. to the ETC dollar as the market as a whole looks long.
now we're looking at the Bitcoin chart and we can really see how the new trend is formulated.
long from current level and stop loss for 8000satosha
the target will be a local hi
Friends, thanks for your likes and comments!
Good luck with trading!

ETC/BTC TA Update (short-term relief?)ETC/BTC
ETC may have temporarily found support at 7100 sats regions and manages to break the trendline resistance.
This is a good sign for ETC bulls in the short-term but the battle is still too far.
There is a lot of trading action needed to shift the tide.
ETC needs to hold current levels and must not close below 7100s because
this will invalidate the potential short rally up after breaking the important trendline resistance.
If everything goes well for the bulls, I'm eyeing a potential top at 10k-12k sats levels.


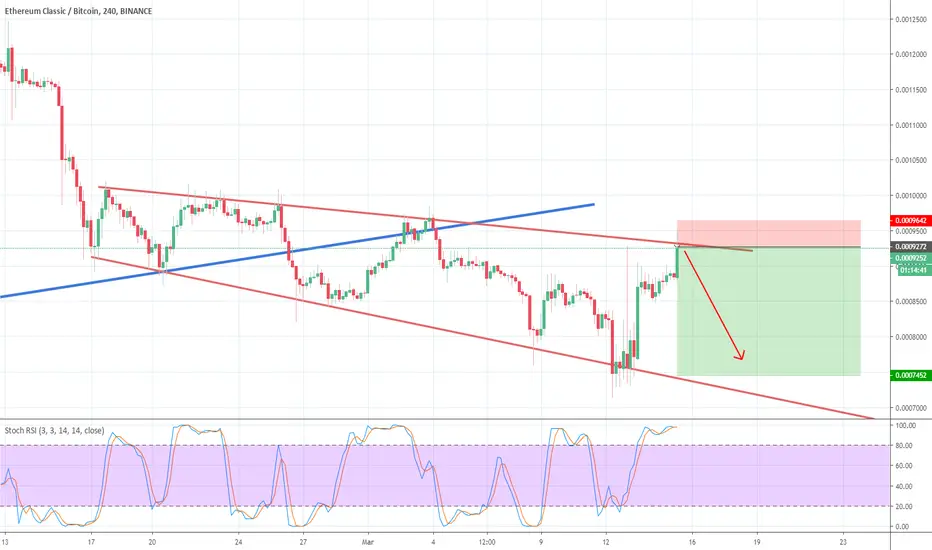
ETC could be rejected again by this major resistanceETC just hit a major resistance on the 4 hours chart. Chances are that the price goes down from there.
ETC/BTC - big potential LONGI really like that structure on ETC/BTC - we have nice 5 waves up and now it looks like, that ABC correction is finished and ETC is ready for another 5 waves up. I am not in the LONG position yet, I have stop limit buy order at 8949 satoshi.
