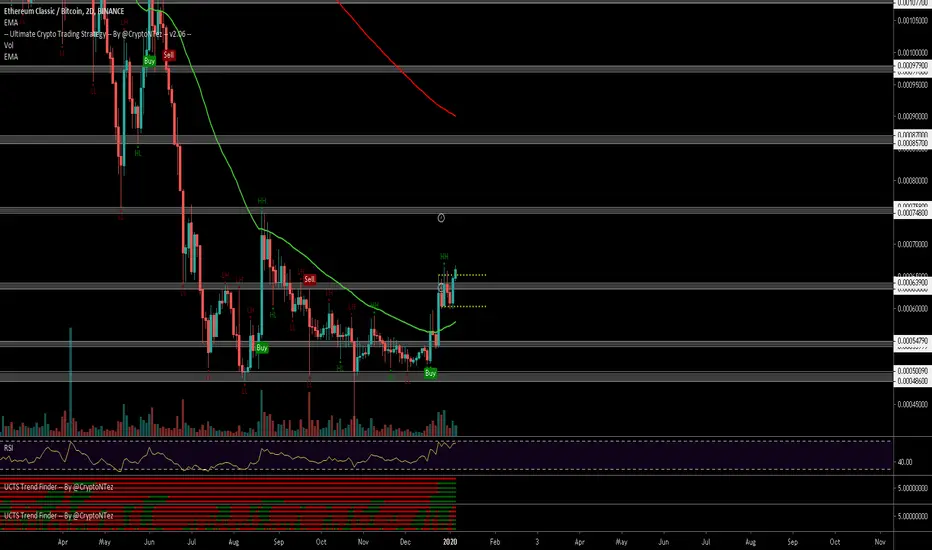
$ETC, Pushing above ~63k sats resistance level making new HH$ETC
Pushing above ~63k sats resistance level making new HH & potential break from bullish flag..
Crossing above EMA200 on the daily chart with UCTS buy signals on the 1D-5D timeframes...
Volume rising
Looking for a R/S Flip as entry with target at ~73k sats level (15%+)
#ETC
ETCBTC trade ideas
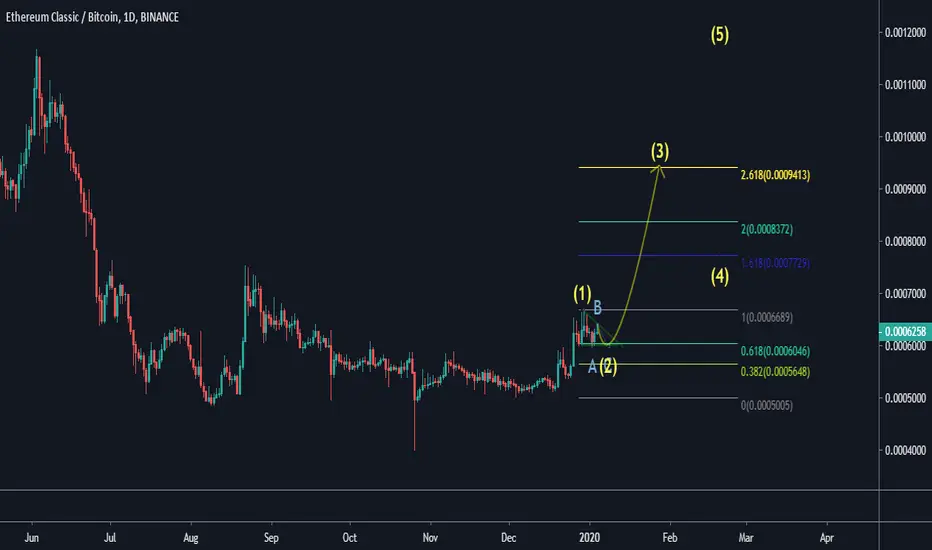
ETCBTC Will Continue to RiseSxc looking Fibonacci lines, sitting above grey line. Movement upward likely.

Potential Top...Have counted 5 waves up here and it's in a potential top area for wave 5 should expect to see a correction down from here.

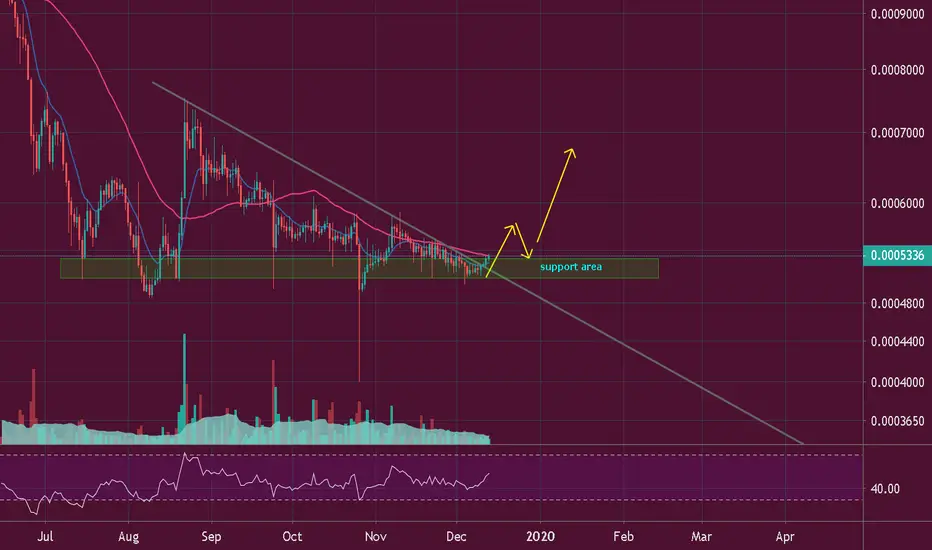
ETC/BTCAfter a massive drop due to BTC's pump, ETC has touched 100MA support on daily and also retraced back to a daily support.
The hardfork is coming in 12 January as well. Bullish !!!!!

ETC THOUGHTS$ETC
I'd cut longs here, bearish divs into HTF resistance; I'd look for a pullback into range POC (yellow).

ETC/BTCExpecting a bounce from here in the next 24 hours.
Red lines are daily supports and the price is sitting right above 200MA on daily.

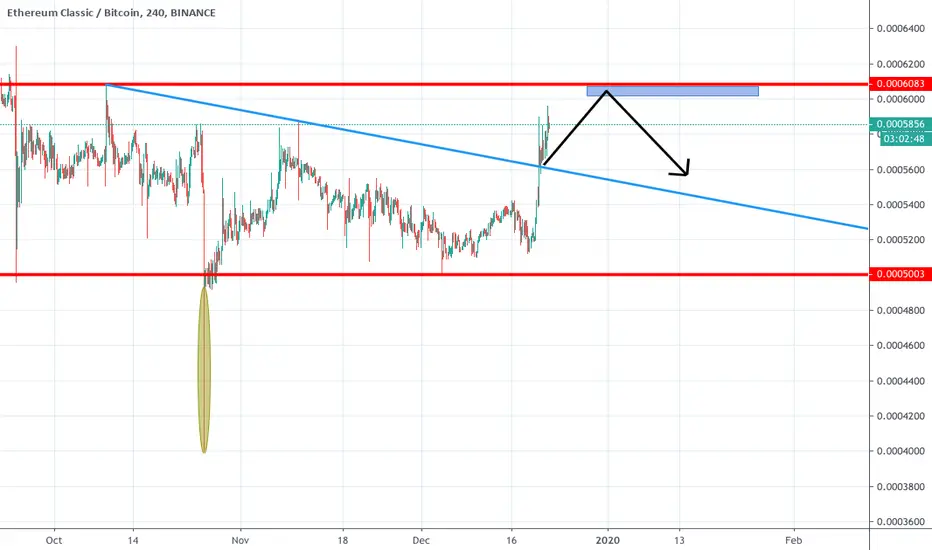
ETC | The first target hit! Whats next?In our last analysis, we went long in $ETC and our first target was reached. If you have missed this move. DO NOT WORRY. Never chase a price.
I would like to wait for a retracement after this expansion and would like to see 6012 satoshi level acts as support where you can add into existing long / open a new long.
Our next target would be 7480 satoshis.
Many "leaders" do not write about risk management but you should never risk more than 1-2% of equity on a single trade.
Invalidation of this idea would be, if we will lose our S/R Flip on 6012 and close daily below that, then I will leave this idea.
__________________________________________________________________________________________________________________
I do a daily observation of major currencies in forex and crypto. Do not miss any move, high-valued analysis or educational content.
Free Telegram: t.me
Twitter: twitter.com
__________________________________________________________________________________________________________________
I've been analyzing for some time which exchange/broker is best for trading all-assets (crypto, forex, gold,..).
PrimeXBT (tight spreads, up to 1000x leverage, 24/7 support, lowest fees, no slippages, no overloads, quick withdrawals, No KYC).
go.primexbt.com
__________________________________________________________________________________________________________________

ZOOM: ETC NEXT TARGETSETC pumped good, my entry was 5800 sat, but missed to share it.
next sell 7600, 8700sat.
good luck

$ETC, Crossing over ~55k sats resistance level...$ETC
Crossing over ~55k sats resistance level with UCTS trendfinder turning green(buy) on ALL low TFs & 1D/2D charts
Crossing above EMA50, Volume is not what I was expecting but if R/S flip happens on this level retest we may aim for a new leg up (~64k / ~73k)
#ETC

ETC shows strength, daily swingEthereum Classic is at an all-time low and shows some strength.
I would like to buy at re-testing daily support and have it as an intra-week play, probably swing play as well. You can setup up to three targets but remember as soon as possible lock your profits or move your stop loss at break-even (BE).
Why do I like Ethereum Classic?
- shows strength on daily and has created a support
- above monthly VWAP
- 50/100 DMA and has a lot of room to upward
This thesis will be invalid if price will not show any strength at our support.


ETCBTC lond and shortA sharp impulse up the price, then the same candle returned to the support level. After that, the price flew up to the resistance level.
I look forward to further growth to the level of resistance.
ETC-BTC Trade SetupETC seem trading in triangle pattern and seems to be breaking out on Daily TF.
RSI seems to be breaking out on Daily TF as well.
MACD is rising
SBS Indicator signaled BUY
BUY at the breakout
SL and Targets are on the chart
Target 1 is more of a scalping target. target 2 is mid term as ETC is a slow trade.

Ethereum ClassicOn the ETCBTC chart,
Below 0.0010251 is a long-term investment area.
In the ETCUSD chart,
It is moving around the downtrend line.
You should check if you can move outside of the downward trend line.
----------------
It is expected to take a long time to raise prices in the normal market flow.

Ethereum classic regression analysis0.94 regression downtrend, there is no good entry until a shift in trend can be observed and Pearson's R value declines, as it is quite strong currently in this downtrend.


ETC/BTC TA Udpate (Getting Ready for Breakout?)ETC/BTC
ETC is closely trading outside the trend-line resistance and currently testing the 50 Day MA resistance.
If the price can close above the 50 MA in the coming days, it will give extra momentum for bulls to completely change the trend.
ETC podemos ganar algún porcentajeHola a todos, dejo mi analisis del bot, esperando para un profit de 2% y salirme, espero que le sirva

ETC/BTC (Ethereum Classic)| 300% Profit Potential.!!ETC/BTC (Ethereum Classic)
Forming Falling Wedge Pattern in Monthly Chart & Holding the Support Since July 2019..
Now Need Some Strong Volume For Bounce back & Wedge Breakout..
If You're Longterm Investor/Trader or ETC Believer then It's a Golden Opportunity to Grab it at Bottom..
Support & Resistance Levels Are Mentioned in Chart..!!
Please, give us your opinion in the comments.!!
If you like the idea, please hit the Like button and subscribe to the profile in order not to miss our updates.
The information given is never financial advice. Always do your own research.


Ethereum classic (regression analysis)0.86 regression downtrend, a lot of accumulation can be seen in the past couple of weeks.

ETCBTC BINANCE 1D BB RSI MACD#Binance
#ETC/BTC
Chart ETCBTC BINANCE 1D BB RSI MACD
Advised Buy Levels
BUY: 0.0005411
SL: 0.0004845
TP: 0.0005843 > 0.0006290 > 0.0006760
ETC has been on down trend though on the daily charts we can see some support holding at this range.
We advice if your are looking to trade ETC to look on the longer timeframe for this movement to come into play, while ETC is in a nice buy range at the moment this may end with a sudden move to the upside.
As always DYOR
Who are we?
Signalyze Market Metrics.
Signalyze.co.uk is your swiss army knife of trading tools which takes market data, trend data from social media and utilizes advanced algorithmic A.I to initiate trades to your advantage as well as you receiving advanced analysis on signals and information around cryptocurrency and prices that will help you make the best decision when trading at the most important times.
With custom in-browser alerts from the website direct to your telegram channel you will have access to the best custom alerts available FREE to ensure you never miss a market movement.
Join the community today!
—Links—
Website : signalyze.co.uk
Discord : discord.gg
Telegram : t.me
Twitter : twitter.com
Investment Bot : t.me
