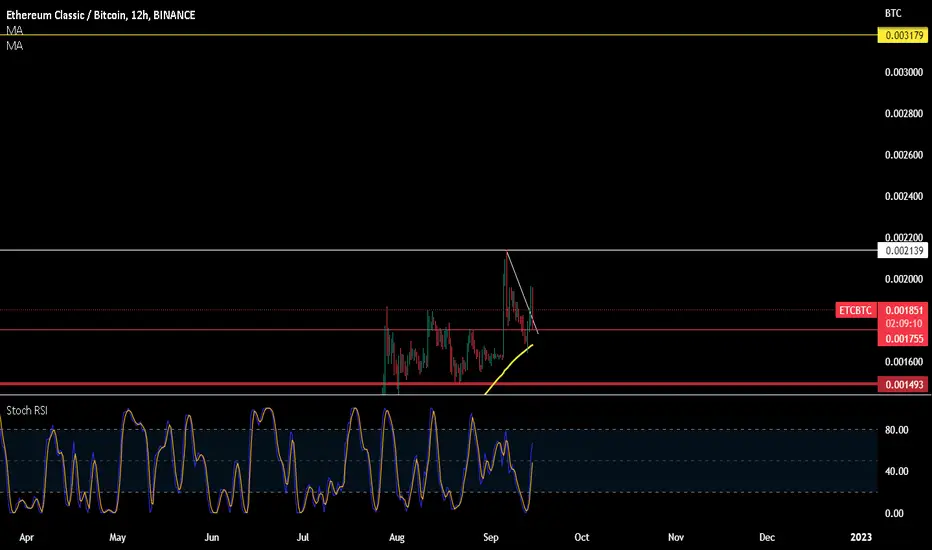
ETC/BTC 1 year patternETC/BTC looks like it is repeating the same pi RSI pattern from exactly 1 year ago October - November 2021. If you compare the pi RSI pattern around October 22nd 2022 with October 21st 2021, they definitely have very similar attributes. Here's levels on the 1 day chart:
FibSMA89 = .001549
FibSMA55 = .001507
FibSMA34 = .001279
FibSMA144 = .001258
FibSMA233 = .001093
Do your own due diligence, your risk is 100% your responsibility. This is for educational and entertainment purposes only. You win some or you learn some. Consider being charitable with some of your profit to help humankind. Good luck and happy trading friends...
*3x lucky 7s of trading*
7pt Trading compass:
Price action, entry/exit
Volume average/direction
Trend, patterns, momentum
Newsworthy current events
Revenue
Earnings
Balance sheet
7 Common mistakes:
+5% portfolio trades, capital risk management
Beware of analyst's motives
Emotions & Opinions
FOMO : bad timing, the market is ruthless, be shrewd
Lack of planning & discipline
Forgetting restraint
Obdurate repetitive errors, no adaptation
7 Important tools:
Trading View app!, Brokerage UI
Accurate indicators & settings
Wide screen monitor/s
Trading log (pencil & graph paper)
Big, organized desk
Reading books, playing chess
Sorted watch-list
Checkout my indicators:
Fibonacci VIP - volume
Fibonacci MA7 - price
pi RSI - trend momentum
TTC - trend channel
AlertiT - notification
tickerTracker - MFI Oscillator
www.tradingview.com
ETCBTC trade ideas

Ethereum Classic (ETC) formed bullish BAT a good buy opportunityHi dear friends, hope you are well and welcome to the new update on Ethereum Classic (ETC) with BTC pair.
Previously we caught a nice pump of ETC:
Now on a 4-hr time frame, ETC has formed a bullish BAT pattern.
Note: Above idea is for educational purpose only. It is advised to diversify and strictly follow the stop loss, and don't get stuck with trade

ETCBTCETCBTC trend for the next weeks...
There would be a rising swing I suppose...
Trade at your own discretion...

$ETC/BTC 12h (#BinanceSpot) Bull-pennant breakout and retestEthereum Classic is looking bullish in satoshi and seems ready to push higher after Hashrate went up!
⚡️⚡️ #ETC/BTC ⚡️⚡️
Exchanges: KuCoin, Binance
Signal Type: Regular (Long)
Amount: 10.8%
Current Price:
0.001758
Entry Zone:
0.001692 - 0.001548
Take-Profit Targets:
1) 0.0019950
2) 0.0023260
3) 0.0025970
Stop Targets:
1) 0.0013190
Published By: @Zblaba
Risk/Reward= 1:1.25 | 1:2.35 | 1:3.25
Expected Profit= +23.15% | +43.58% | +60.31%
Possible Loss= -18.58%
Fib. Retracement= 0.786 | 1.272 | 1.618
Margin Leverage= 1x
Estimated Gain-time= 5-6 weeks
Tags: #ETC #ETCBTC #PoW #Mining #Ethash #EthClassic #Dino #Hardfork #SC
Website: ethereumclassic.org
Contracts:
#Mainnet

Ethereum Classic formed bullish Gartley for upto 27.50% pumpHi dear friends, hope you are well, and welcome to the new update on Ethereum Classic (ETC) with BTC pair.
Previously ETC was very close to complete a Gartley pattern , but pumped before the completion:
Now on the 4-hr time frame, ETC has formed another bullish Gartley pattern. There is also a hidden bullish divergence as the priceline is forming a higher low and RSI is setting a lower low.
Note: Above idea is for educational purpose only. It is advised to diversify and strictly follow the stop loss, and don't get stuck with trade

ETCBTC long tradeOn one day time frame etc formed bullish pennant which is bullish continuation pattern wait for breakout to enter a trade
TP. 0.0021897

ETHEREUM CLASSIC: WHICH ONE?Hi guys, here you can see 2 similar pattern as in the past but with 2 different end.
Based on the coming merge, what do you think will happen?
Most of us hope for a green pattern, but are we sure?
I'm not, so let's see and plan to take profit if price start to fall.

Ethereum Classic (ETC) forming Gartley | A good buy opportunityHi dear friends, hope you are well and welcome to the new update on Ethereum Classic (ETC) with BTC pair.
In previous trade ETC slightly move below the potential reversal zone, however, recovered soon and pumped well.
Now on a 4-hr time frame, ETC is about to complete a bullish Gartley pattern:
Note: Above idea is for educational purpose only. It is advised to diversify and strictly follow the stop loss, and don't get stuck with trade

Ethereum Classic Inverse Head & Shoulders Pattern (45% Target)We looked at this pair recently and just today we are having a bullish breakout.
The Altcoins vs Bitcoin pairs normally correct when Bitcoin breaksout but I guess the bear market has been so strong that everything wants to grow...
Not really, Ethereum Classic (ETCBTC) is an exception... Let's read the chart.
We have a break above all EMAs today including MA200.
(EMA10, EMA21, EMA50, EMA100 and MA200.)
We have a volume breakout and the RSI went through the roof.
Easy peasy...
The daily candle closes in just a few minutes which confirms MA200 being conquered.
This can lead to higher prices.
Namaste.


ETHEREUM CLASSIC: DREAMING AGAINHi guys, this is not ta like you imagine or a prediction.
I found just this similarities on rise and fall, if happens again will be so ridiculous as wonderful.
If will happen, mmm...i'm dreaming so hard today.

ETHEREUM CLASSIC: NOT BE TOO HAPPY FOR NOWHi guys, in these days we are seeing many pumps in alt market, and it's beautiful to use it to accumulate more Btc.
The main question is how long it will be last?
I'm not sure this is the real start of the next bull market, maybe we can see a fake pump and only after this pump and dump will see the next raise.
So, for me, red and yellow are the main pattern for these days, but doesn't mean i'm short...just that i ready to exit at some point to reaccumulate later.
Let's see what will happen.

Ethereum Classic Falling WedgeLooking at Ethereum Classic (ETCBTC) we have a falling wedge pattern that is yet to break.
We have two levels where this pattern can be completed.
(1) Reaching the 0.5 Fib. retracement level at 0.0007107.
(2) Reaching the 0.618 Fib. retracement level at 0.00006799.
The second level is normally the stronger support but prices can bounce anytime.
There is a 17% target mapped on the chart, short-term.
Mid and long-term there will much more growth.
Namaste.

ETC buyThe best time to buy.
On the chart there is a huge figure of the Head and Shoulders Pattern.
Not financial advice, do your own investigation.

$ETC/BTC 4H Look$ETC and many other alts are in the same bounce or die situation, for now just chill don't enter any trade is a great trade, wait for the market gives a clear direction, then follow the trend

Ethereum Classic not as Ethereum Modern
Ethereum Classic is a decentralized computing platform that executes smart contracts. Applications are ran exactly as programmed without the possibility of censorship, downtime, or third-party interference.
Ethereum Classic is a distributed network consisting of a blockchain ledger, native cryptocurrency (ETC) and robust ecosystem of on-chain applications and services.
Rank #29
Coin
On 282,810 watchlists
Ethereum Classic Price (ETC)
$55.98
1.05%
0.0008644 BTC0.48%
0.01207 ETH1.07%

Ethereum Classic Bullish Breakout After 300 Days (100%+ Easy)Ethereum Classic (ETCBTC) moved together with the rest of the Altcoins.
It peaked May 2021.
What followed was a correction that latest 300+ days.
We have a falling wedge pattern and higher low...
A bullish breakout is taking place today.
We can expect additional growth...
Thanks for always coming back.
You are appreciated.
Namaste.

ETC BTC Bullish divergence TP2 (TP1 would be around 0.0012)ETC BTC Bullish divergence TP2 (TP1 would be around 0.0012)

ETCBTC Gann AnalysisUsing the Gann tool we can plot down trends and uptrends
Plotting both, it gives a support point for price, and also a resistance point
I expect a bounce off the support from the downtrend Gann line at some point
This bounce will hit the resistance Gann line (in red)
A large up channel can also be plotted if you place this up move (dotted line)
The indicator is what I expect will occur as price moves (in white)

ETC/BTC buy opportunity Hi followers,
BINANCE:ETCBTC showing first positive signs for a reversal.
After buyers stepped in on a demand zone, the price formed the first higher low since the large pullback began on may 2021.
If we break the big down trendline, there is more upside.
Don't forget to manage your risk! 👌
Good luck and trade with care 🙏
If you like my content - 👍 Like, 💬 comment, 👆 follow and 👉 share!
❗❗❗
Disclaimer: This information is not a recommendation to BUY or SELL. It is to be used for educational purposes only

ETCUSDT Technical analysisAfter breakout of trend line and pullback, we can go long on this pair.
Don't forget to move your stop loss up when you are in profit.
Follow me for more TS.
Cheers :)

ETCBTC Long Opportunity ETCBTC holds its RSI support. Also, you can easily see that it has broken its RSI descending channel.
From the MACD point of view, it has a hidden divergence, as shown in the chart.
From an overall perspective, it is a golden time to buy ETC!!
The target points are indicated in the charts.
