I would be switching from Ethereum to Ethereum Classic nowThe daily ETH to ETC chart looks massively bullish for ETC on the MACD and RSI indicators
ETCETH trade ideas

Descending Wedge Pennant... ETC ETH Mining WarYou have to start to wonder if ETC will have a run up on the back of ETH considering they share mining equipment... A bullish looking Pennant squeezing the hell out of ETC ... Pressure makes Diamonds !!
These work best at yearly lows.. exactly where we are !!
Does it hurt to buy a yearly low ??

A Different Way to Look at AltcoinsWhen looking at some of the smaller altcoins, we can look at the /btc and the /eth chart to supplement our technical analysis.
When we see bullishness on the /btc or the /eth chart and the /usd chart, we know that the breakout is much more likely and have more confirmations on our analysis.
Looking at the etc/eth pair, we see that the price is forming a falling wedge. Each time a falling wedge formed in the past, the price made immense surges. Why would this time be any different? By taking the length of the opening of the wedge and adding it to the bottom of the wedge, we get a first target of 0.06 ETH. That almost doubles our money... in terms of ETH. If you expect ETH to continue rising, this trade could more than double our money!

ETCETH - This looks like a classic textbook bottomETC has been hammered against ETH but here look like a 10X opportunity for contrarian investors. Volumes are low, no one interested so there is an opportunity to get in before others get interested. All minimum requirement for the diagonal triangle have been met. Looks like the low is already in place or it would form in the coming sessions. As with any low, the initial rally attempt is always weak so we could expect that but long there is a 10X potential here if it revisit ICO time high.

ETC - 5th correction waves completed, confirmed by double bottomETC bull cycle is coming. The last correction has ended at the bottom. Price bounced up and confirmed that support 59 days later. Cleary two strong signals for a bullish market.
On the daily chart, MACD is crossing the signal line and goes bold-ish up. Volume is getting positive. RSI shows also a lot of space to accumulate.

ETH vs ETC (The Sleeping Giant)Upon my studying of the massive long term wedge formed on ETH chart I looked at it's comparison to ETC in lieu of recent spike and low and behold we have a buy signal. This is before our signal in ETH has triggered a buy or sell. Early entry here with tight stop below the trendline.

ETC/ETH buythis is it. legging in from ethereum to ethereum classic. 4 hr chart moving average crossover buy in.

ETCETH breakout weekly downtrendline ETCETH breakout weekly downtrendline
Good news for ETC in coming weeks.
targets for 1 ETC
Target 1 @ 0.095 ETH
Target 2 @ 0.165 ETH

long @ 04666 and underbecause of the upcoming Hong Kong conference +existing and growing Eastern Market/ exchange interest
ongoing ETH volatility will lead to sell opportunities above 0555 in the next 15-30 days

ETC/ETH - SHORT Look at Fibo Retracement, you could see clearly that ETC/ETH will short till the end of October
Then, in the November, ETC may grow up very strong


Long ETC vs ETHETH seems to slow down or might even retrace, at the same time ETC started an uptrend.
going long on this pair

ETCETH LongETCETH is finally gettin' closer to SMA50 on 4h tf, for the pair to go to the projected levels ETH should fall to 220-240 USD.

ETCETH downtrend squeezingETCETH downtrend is getting squeezed. If it breaks this line then going to be a solid coin to invest


ETCETH Trading IdeaPrice passed from the kumo and DMI confirms strong upward movement. We have buy opportunity. We can open long trades based on a trading signal from Ichimoku indicator. But in such way our entry is near 0.100000 level. It's the strong resistance level and price can bounce from it and drop to the uptrend line. RSI is in the overbought zone and it's an additional confirmation for possible retracement. How we should trade in this market? It's better to wait when price breaks the resistance level and after that returns to Tenkan or Kijun lines. When we get a reversal signal from one of these lines, we'll be able to open long trades above 0.100000 level. Stop orders will have to be below the local swing low. Profit targets for long trades will be at 0.130000, 0.150000 and 0.180000 resistance levels. Also if price drops to the kumo and 0.081000 support level and we get a reversal signal confirmed by RSI, we'll be able to buy with profit target at 0.100000 resistance level. Don't forget that all trades must be opened using just a part of your deposit. Proper money management strategy is the key to stable and profitable trading in long term.

ETCETHMaking potential cup and handle on daily chart, break above 0.1 will push pair towards 0.16.
Fits very well with strength in ETH and weakness in ETC VS BTC

ETC/ETH - Up for a great bullrun!I don't like to write descriptions, but I will post future updates along the way. Good luck this will be a great run!

ETCETH
Time for ETC to outperform ETH is upon us.
Break above 0.08 will opne 0.1 as target
Clear up trend developed.

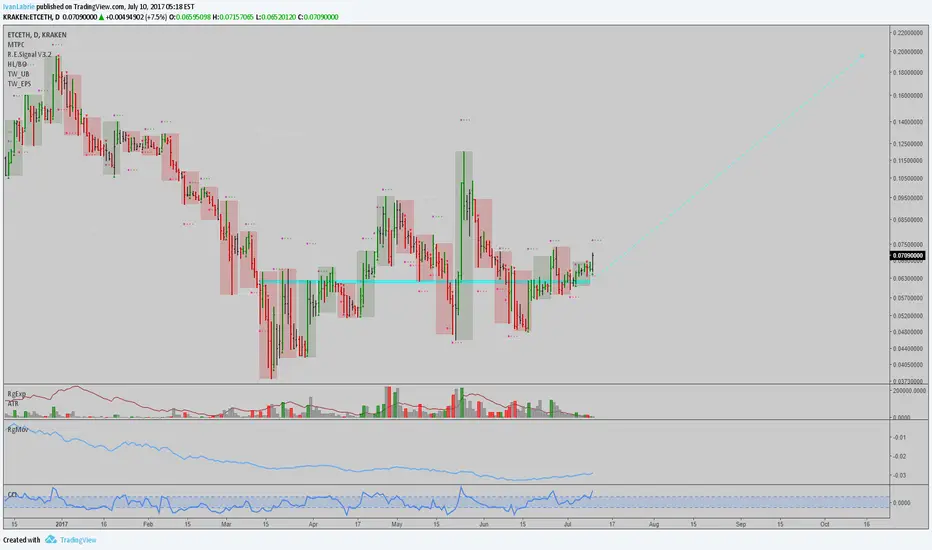
ETCETH: Interesting pattern here$ETCETH implies that $ETC will outperform $ETH to the tune of 200%, give or take. By this week's close, we will trigger a 14 week rally, the daily chart is already in a strong uptrend here, just taking off.
I added to my $ETC position, now holding a half position, and waiting to add some more on dips, after making some more progress. I think this is an interesting trade right now, with $ETCEUR's upside potential, and also as a hedge to our $ETH exposure.
Best of luck,
Ivan Labrie.
ETCETH 8H: First resistance broke. More up possible.Etc could become a real alternative to eth in the future. Etc wants to do some things for the future (updated monetary policy, hard fork). Do not forget, etc also has support from china.
Let's see what happens. Happy trading. :-)
