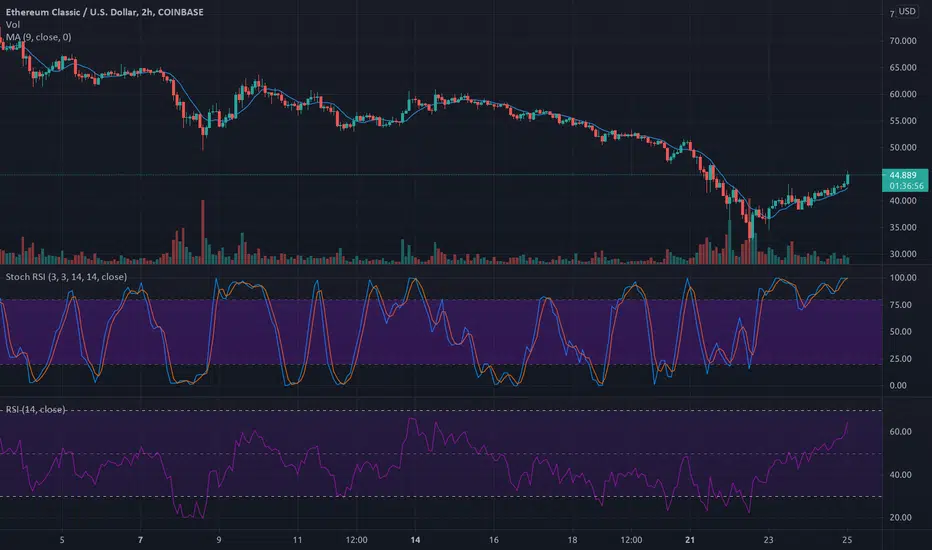
ETC looking strong 27% increase for ETC Compared too the 4 % increase of BTC. Its looking good for ETC too hit new all time highs
ETCUSD.P trade ideas


Slow marketsHello Traders
On the H4 chart we can see more Consolidation within the Support and Resistance.
Im expecting a bullish breakout above resistance soon.
Stay with the market, lets see what happens

Ethereum Classic (ETC) - June 29Hello?
Welcome, traders.
By "following", you can always get new information quickly.
Please also click "Like".
Have a good day.
-------------------------------------
(ETCUSD 1W Chart)
If the price holds above the 36.305-47.296 range, it is expected to create a new wave.
(1D chart)
We need to see if we can find support at the 37.180-47.947 area and break out of the downtrend line.
If the price is maintained in the 47.947-69.480 range, it is expected to turn into an uptrend.
If it moves down from the 37.180 point, you should touch the 25.179 point and watch it move up along the uptrend line.
--------------------------------------
(ETCBTC 1W chart)
If the price holds above the 0.00097-0.0013736 range, it is expected that the uptrend will continue.
(1D chart)
We will have to wait and see if we can move above the 0.0012739 point.
In particular, we need to see if we can break out of the downtrend line.
If the price holds in the range of 0.0012739-0.0016415, it is expected to turn into an uptrend.
If it goes down, you should see support at the 0.00097 point.
------------------------------------------
We recommend that you trade with your average unit price.
This is because, if the price is below your average unit price, whether it is in an uptrend or in a downtrend, there is a high possibility that you will not be able to get a big profit due to psychological burden.
The center of all trading starts with the average unit price at which you start trading.
If you ignore this, you may be trading in the wrong direction.
Therefore, it is important to find a way to lower the average unit price and adjust the proportion of the investment, ultimately allowing the funds corresponding to the profits to regenerate themselves.
------------------------------------------------------------ -----------------------------------------------------
** All indicators are lagging indicators.
Therefore, it is important to be aware that the indicator moves accordingly with the movement of price and volume.
However, for the sake of convenience, we are talking in reverse for the interpretation of the indicator.
** The wRSI_SR indicator is an indicator created by adding settings and options to the existing Stochastic RSI indicator.
Therefore, the interpretation is the same as the traditional Stochastic RSI indicator. (K, D line -> R, S line)
** The OBV indicator was re-created by applying a formula to the DepthHouse Trading indicator, an indicator disclosed by oh92. (Thanks for this.)
** See support, resistance, and abbreviation points.
** Support or resistance is based on the closing price of the 1D chart.
** All descriptions are for reference only and do not guarantee a profit or loss in investment.
Explanation of abbreviations displayed in the chart
R: A point or section of resistance that requires a response to preserve profits.
S-L: Stop Loss point or section
S: A point or section where you can buy to make a profit as a support point or section.
(Short-term Stop Loss can be said to be a point where profit and loss can be preserved or additional entry can be made through split trading. It is a short-term investment perspective.)
GAP refers to the difference in prices that occurred when the stock market, CME, and BAKKT exchanges were closed because they are not traded 24 hours a day.
G1 : Closing price when closed
G2: Opening price
(Example) Gap (G1-G2)

💥ETCUSD- BREAKOUT & PUMP TO $100, $120Right here is Etherum classic in a tight zone making effort to breakout of the descending triangle.
Before the breakout, price may sell to the support trendline at $32 before pumping.
Once it breaks out the trendline, I expect a long setup to $100, $120 and more.
What do you think?
Share your opinion in the comment section✍️
Please support this idea with a LIKE👍 if you find it useful🥳
Happy Trading💰🥳🤗

We Are In Phase C of the Wyckoff Accumulation PatternHi Everyone,
I have applied the Wyckoff Accumulation Pattern to ETC.
I previously posted a Wyckoff analysis on the Total Crypto Market, and it clearly shows we are in Phase C of the pattern.
For ETC, I argue we are also in Phase C; however, sellers have been more aggressive in ETC, than the overall crypto market.
I suspect we have gone through most of the selling, and as volume picks up we will see more buyers and an eventually push into $62-$72 by the end of July.
We still have to breakthrough the 50 and 100 MA on the 4hr before we are truly heading to $62, but once broken, there should be nothing stopping it.
If ETC fails when exiting the upper end of the support, then I suspect we will be heading much lower into the $20 range.

Ethereum Classic - Should see a push into the $50 range?Ethereum Classic - ETC - Should see a push into the $50 range?

ETHEREUM CLASSIC BULL RUNIf you look at my previous ethereum idea i was spot and and called the short.
now that we came to the exact price and technicals show a bull run.
this could potentially be the last low before rising and surpassing 200$
but lets keep an eye out

ETHEREUM CLASSIC SHORT to $35 -Price action showing us lower swing highs
-broken structure and retested
-respecting resistance levels
-respecting this downhill channel
-SUMMARY= technical wise we should be seing a downfall from this area it looks clear on the chart but anything can happen so use proper risk.

Ethereum Classic Hi guys, i hope you held your cryptos with diamond hands and did not panic sell during this dip.
ETC has presented us with a beautiful buying opportunity. Following the bullish impulse that occurred in May, price has dipped to a sweet spot. Price is currently testing previous resistance turned support at the 38$ area. The 200 EMA and the 78.6% Fibonacci retracement are also being tested in this area. If this area holds, its nothing but up.
The RSI (Relative Strength Index) is oversold at 29.9.
Nevertheless we must acknowledge the possibility of price making one more dip to liquidate some traders/investors, something to definitely keep in mind.
Never invest more then you can afford to lose
This should not be considered financial advice. DYOR


A BTC Dump will bring ETC hereFibs, EMAs, MAs, Oversold target, Elliot wave all lead to a target of $13-$13.3.
Very Bloody.


etcusdtClassic eth Currency itself has no seller. However, the upward trend in the btc dominance and decline of bitcoin will lead to the forced fall of this currency.
Currently, the most important range is $ 40 to $ 50, which is the annual limit of this currency. With this decline, it can be said that in the daily time and weekly, the pullback is being done to the previous ceiling, and we will face a good climb in the upper time.
----------------------------
In low time, however, the route will be high according to the chart.

IS ETC READY FOR BLAST OFF? #BLESSEDPIPS CRYPTOS HAVE BEEN VERY SILENT LATELY, WITH GOLD AND SILVER NOW BULLISH. WILL THE METALS LEAD THE WAY FOR THE CRYPTOS LIKE THE FIRST BULL RUN WE HAD THIS YEAR. VERY EXCITED TO SEE WHATS NEXT.
#BLESSEDPIPS

ETC/USD (ETHEREUM CLASSIC)If the market structure stays below this zone we could possibly see
a downfall to around $35. into a buying zone.
we have already hit highs above $200 so long term we are expecting to surpass.
overall target
$1,000


💥ETCUSD - TO DIP TO $43, THEN PUMP TO $90Etherum classic as we can all see is in a downtrend with five (5) credible resistance trendline and two (2) credible support.
Sellers are still winning the battle. Therefore, I expect etherum classic to dip to $43 and pump to $90.
Let's wait and see what happens.
What do you think?
Share your opinion in the comment section✍️
Please support this idea with a LIKE👍 if you find it useful🥳
Follow me to receive more updates on this pair🤙
Comment any coin you need my analysis or forecast on📈📉
Happy Trading💰🥳🤗
Thank you for your support!💓

NO MANS LANDThis is a wait and see. Not a terrible accumulation zone if you're into the coin, but not a tradable area.

ETCUSD 6/6/2021Note: NOT A FINANCIAL ADVICE TO BUY/LONG OR SELL/SHORT
_____
Monthly
Still bullish but need some pullback to previous all time high or even to EMA 9.
Weekly
In the chart.
Daily
The reason for pullback.
4 Hour
1 Hour
______
Note: NOT A FINANCIAL ADVICE TO BUY/LONG OR SELL/SHORT
