What's next big resistance for ETC
according to my opinion we can expect retracement since we are close to major resistance levels and the up trend seems to be to linier, therefore correction can be expected at the marked resistance levels.
ETCUSD trade ideas

ETC to revisit ATH?gm frens,
If you follow me, you know I've stayed bullish $ETC.
Revisiting the $65 region seems inevitable, as miners realize that $ETC can be a way to recycle their $ETH gear. Then it's a virtuous circle of higher hashrate, project becomes more interesting to build on, prices goes up, mining becomes more attractive, etc.
So far my January 2022 prediction has been correct (e.g. $60 before Q2).
The real resistance is at $80. If we break it, then I think we're going to repeat what happened a year ago, meaning we could currently be a fractal of the green rectangle I highlighted. $ETC can reach $500 before summer. $1k is possible, but less plausible.
What would invalidate this scenario is a strong rejection at $60 and the whole crypto market going back bearish because of macro.
DYOR.

Is ETC dead now? Where to rebuy (NFA)ETC surprisingly beat my 55% target increase in just a few days from posting that. Curious if they have bragging rights or awards you can get on here for being so spot on, lol.
Anyways, I found 3 things on my chart that all pointed to the same spot for ETC to make a higher low in the uptrend. The peak had a bullish penant it broke down from, I measured it and drew a yellow arrow on my chart. It just happened that it aligned exactly where I had a support / resistance line (not sure what time frame admittedly I have a lot from short time frame margin trading), and even cooler was that the 100 or 200 EMA depending on if on 2 or 4 hour chart also aligned at the same spot (or will as it falls).
That’s where my limit orders will be, but admittedly I feel lost without my ETC coins. I’ll probably DCA a few in beforehand. I need to work on the no emotion thing. What can I say even at the peak I believe it is way undervalued. I just won’t miss out on great trading opportunities while holding a bunch of it. I’ve been shorting since the breakout downwards of the triangle (there was a false break to upside originally on smaller time frame that’s why pattern looks a little weird.)
**The rebuy area the chart points to in yellow is not financial advice. Do your own due diligence. I have been extremely accurate in the past with predictions and forecasts but that does not guarantee future success.

Dont you worry bout a thangwe could retrace to $29 or $37 .... we could also just blow past $50 after consolidation. Been mining ETC for a few months and todays pump was a good day to SCALP profits for a quick retrace.
Sold at $52
Current price: $48
watch for volume and retrace, if not, were pumping, just a guess

[ETC/USD] Long term: What is the future of ETC?TREND:
Trending line has clear bearish tendencies since the end of February.
SUPPORT:
We are currently missing any major support line until around 2.662USD. Either we will create a new support by side action or we will fall in correlation with the trend line.
VOLUME:
Volume is proving to be not big enough for bulls. We can clearly see that bears are taking the lead. Should we see some change? If yes, then already mentioned side action is needed with higher highs.
RSI (100days):
It is currently on 42 (meaning of life?) which is not hugely oversold, therefore there is still lots of room for selling action.
Summary and prediction? I see ETC slowly falling down to the area of 2.662USD until the half/end of January.
If you agree, then your like is appreciated :)
Happy trading.

ETHEREUM CLASSIC Resistance levels Honestly this caught me off guard so far but as we can see is a nice strong price movement going up so far breaking through resistance levels and continuing on its way upwards too a new ath like last year.

ETC stopping target detected, 14% more leftWe have seen strong bullish momentum on ETCUSD coin. The momentum will continue until around $49 level. I will need to evaluate once we are at this level. I expect the price to consolidate and to form a fractal.

ETC rise begins
etc have production cuts expected
The trend of the daily line also forms a double bottom structure
An outbreak is expected in late March or April
It is recommended that you plan on dips
Follow me to take you to achieve financial freedom

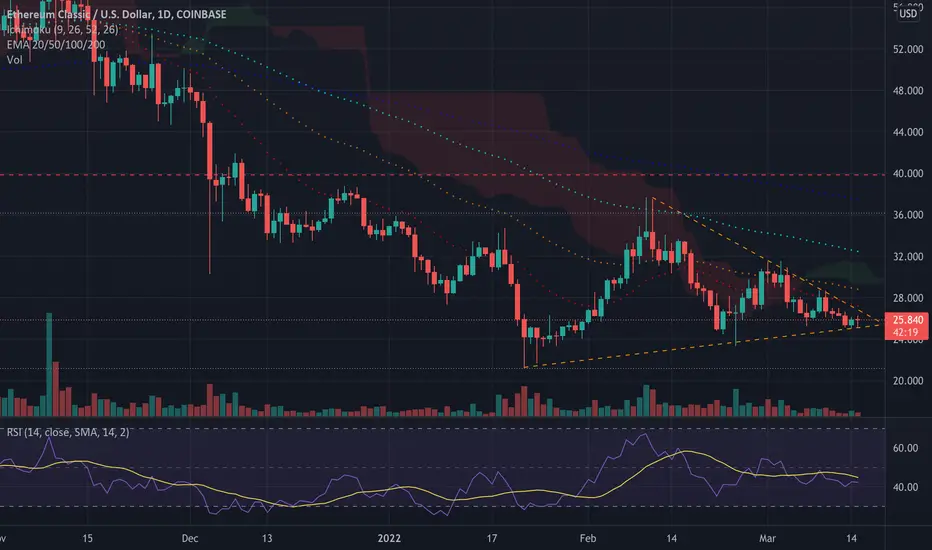
ETCUSD Still not bullish long-term until this breaksEthereum Classic has had a +45% rise in just the past 2 days and is currently testing the 1D MA200 (orange trend-line). That level has been intact since the November 10 2021 Lower High.
Unless the 1D MA200 and the Lower Highs trend-line just above it break, ETC won't reverse the long-term bearish sentiment and will continue trading within the Channel Up that started at the begining of the year. A break below the bottom of this Channel Up, constitutes a sell signal targeting the Pivot line.
--------------------------------------------------------------------------------------------------------
** Please support this idea with your likes and comments, it is the best way to keep it relevant and support me. **
--------------------------------------------------------------------------------------------------------

55% upside target I called for Eth Classic is within reach.You can go through my previous ideas but about an hour before the breakout I posted that up to a 55% move was imminent for Ethereum Classic, which was largely trading sideways for a while after being bearish for a long time. I’ve been posting bits and pieces of how the fundamentals are changing even just from all the new development teams releasing projects lately, not to mention record wallet addresses and more transactions than Doge and BCH.
Anyways, we have seen an increase of 47-48% over the past two days, and there are two patterns in play in confluence with my 55% target- an ascending triangle we broke out from, and a bull flag (a lil ugly but it works) with a pole measuring almost exactly to where my original target was from the huge triangle pattern it broke out of starting all this off. Current price= $38.40/coin target is around $42.40/ coin and then there is always FOMO and short covering with ETC. I
t went from $30-$180 last May, and last year around this time it went up around 65% in a few days while BTC was stagnant or red. This is feeling like both of those times.
Already crushed through the last fib target in between current price and price target, and it should serve as a support if there’s a drop in the market, but I wouldn’t count on it given how fast it has gone up.
3 months of gains in less than 3 days.
Not financial advice. Also ETC getting bullish usually precedes entire market crashes. WAtch your other coins. Not even joking.

Etc bearish divergencePrice is going up but momentum and MFI is coming down, also overbought. Is it time to short ? Not financial advise

AMC & Ethereum Classic CorrelationI believe institutions are using Crypto for the purpose of leveraging their positions on meme stocks.. like AMC. Ethereum Classic, is one that has been extremely correlated with AMC's price action lately. As you can see here, ETC started leading the way in February of 2021, and shortly after it dropped, AMC began creating the same patterns. They were traded against each other up until November 15th, when they started tracking identical (in time). In our current state, both seem to be very correlated in pattern movements; they are still tracking identical. However, I believe things are about to change. ETC is up 20% today (Saturday March 19th, 2022). I think this upcoming week we will start to experience their correlation (in time), slowly stray away from one another. The pattern tracking will continue, except, it will occur on different time frames. This process would allow the institutions to, once again, trade the two against each other in preparation for the next runup, or.. the squeeze. If true, the manipulation of AMC would seem inevitable.

etc looking good etc is looking great to accumulate down here,
could potentially be close to breaking the down trend
hopefully you got in a week ago when i called

Ethereum Classic (ETC) UPDATE 255.24Ethereum Classic has been trading within a descending channel (yellow) since the start of the month. As of press time, the $25.24 support level had held firm. Moreover, the price has compressed in the past 24 hours (white), just beneath the channel’s upper beneath. This could see the price break out to the upside, or face rejection at the channel’s upper boundary and move beneath $25.24.

ETC, breaking the triangle.The following are machine translations:
Pullback to the bottom narrowed.
Rising along an uptrend line.
and the downtrend line forming a bottom triangle pattern.
The current breakout of the triangle pattern is bullish.

55% breakout coming for Ethereum Classic, but up or down?Ultimately a breakout with heavy volume following will be the signal to long or short, and obviously paying some attention to Bitcoin, as everything follows it to some degree. Ethereum Classic broke out of a massive falling wedge a few weeks ago which gave us the high for this symmetrical triangle. Also, it’s in a falling wedge that eerily goes just below the breakout point of the triangle, so many be a fake out breakout and then a bullish push forward.
I’m holding ETC long term as I see the fundamentals growing stronger by the day with the new Dev teams pumping out one cool project after another. But if I can avoid a huge drop and buy back lower I keep about 100 coins just for trading situations like this.
Anyways, you can see on 4 he chart it looks more like a bullish penant, and it already broke out in RSI. Just came and did a back test that so far seems to be holding: Today should be interesting. When ETC moves, it rockets, regardless if it’s up or down.
The targets line up pretty well with some key fib levels also. Sorry for all the extra blue support/resistance lines they are leftovers from small time frame margin trades. I really need to clean up the chart some for 4 he and daily.

Ethereum Classic Forms Key Pattern.The crypto sector has become frustrating for bullish investors because it now appears to have entered into a long-term bear cycle, with little indication of direction and many of the most popular coins continuing to trade sideways. If a catalyst hits, volatility could enter into the sector and Ethereum Classic is likely to follow the apex cryptos. Although negative news could cause Ethereum Classic to break down from the horizontal pattern the crypto has been trading in since Jan. 5, Ethereum Classic’s chart currently leans bullish. Ethereum Classic has been trading sideways between about $21.10 and $36.80 since that date, but on Wednesday the crypto tested the $25.25 level as support and bounced. The price action, when combined with similar price activity on March 7, Sunday and Monday, has set Ethereum Classic into a bullish quadruple bottom pattern on the daily chart.
If the pattern is recognized, bullish traders will want to see Ethereum Classic rise up on Wednesday and regain support at the eight-day exponential moving average, which is currently acting as resistance. If Ethereum Classic reacts bearishly to any upcoming catalyst, traders can watch for the crypto to break below that level on higher-than-average volume, which could indicate a strong move to the downside is on the horizon.
Ethereum Classic has developed medium bullish divergence on its chart, as the relative strength index has made a series of lower highs, while the crypto’s lows have remained flat. Medium bullish divergence indicates a bounce may be in the cards. Ethereum Classic is trading below the eight-day and 21-day EMAs, with the eight-day EMA trending below the 21-day, both of which are bearish indicators. The EMAs are trading in line with the 50-day simple moving average, however, and if Ethereum Classic can regain all three moving averages as support, a strong sentiment change could quickly take place.
Ethereum Classic has resistance above at $27.65 and $32.17 and support below $24.58 and $20.45.

Ethereum Classic (ETC) - March 11Hello?
Traders, welcome.
If you "follow", you can always get new information quickly.
Please also click "Like".
Have a good day.
-------------------------------------
(ETCUSD 1W Chart)
(Full: )
Above 19.220 point: expected to continue uptrend (long-term perspective)
Above 36.280 point: Expected to create a new wave.
(1D chart)
38.376-49.785 section: section that determines the trend
Therefore, it is important to maintain the price above the 38376 point.
If the price declines below the 26.542 point, there is a possibility that it will fall near the 19.220 point, so you need to trade cautiously.
To turn into an uptrend, it must move above the 32.740 point.
However, it is expected that the upward trend will continue only when it rises above the 57.505 point.
The next volatility period is around March 22.
-------------------------------------
(ETCBTC 1W chart)
(All: )
0.0009 Above 70 points: Expected to create a new wave.
------------------------------------------
We recommend that you trade with your average unit price.
This is because, if the price is below your average unit price, whether the price trend is in an upward trend or a downward trend, there is a high possibility that you will not be able to get a big profit due to the psychological burden.
The center of all trading starts with the average unit price at which you start trading.
If you ignore this, you may be trading in the wrong direction.
Therefore, it is important to find a way to lower the average unit price and adjust the proportion of the investment, ultimately allowing the funds corresponding to the profits to be able to regenerate themselves.
------------------------------------------------------------ -------------------------------------------
** All indicators are lagging indicators.
Therefore, it is important to be aware that the indicator moves accordingly with the movement of price and volume.
However, for convenience, we are talking in reverse for the interpretation of the indicator.
** The MRHAB-O and MRHAB-B indicators used in the chart are indicators of our channel that have not been released yet.
(Since it was not disclosed, you can use this chart without any restrictions by sharing this chart and copying and pasting the indicators.)
** The wRSI_SR indicator is an indicator created by adding settings and options to the existing Stochastic RSI indicator.
Therefore, the interpretation is the same as the traditional Stochastic RSI indicator. (K, D line -> R, S line)
** The OBV indicator was re-created by applying a formula to the DepthHouse Trading indicator, an indicator disclosed by oh92. (Thanks for this.)
** Support or resistance is based on the closing price of the 1D chart.
** All descriptions are for reference only and do not guarantee a profit or loss in investment.
(Short-term Stop Loss can be said to be a point where profit and loss can be preserved or additional entry can be made through split trading. It is a short-term investment perspective.)
---------------------------------

ETC Ethereum ClassicETC looks clean we have one more step to hit the targets we need first to complete C wave which breaks 21.18 level before that i think its going to make a running flat or it will be ( C ) on WXYXZ before the dump 30%
peace :)

A look at ethereum classicHello traders,
RSI bullish divergence from price action, with a bullish MACD crossover. I don't expect much from it short-mid term, unless it can trade above the ~34.05 level.
Let me know your thoughts! DYOR
Have a nice day.
M

Ethereum Classic may see a reversal .Ethereum Classic is trading higher Friday as the crypto market pushes higher, bouncing back from a couple of days' losses. Ethereum Classic trades higher alongside Ethereum ETH and Bitcoin as they lead the market higher. The crypto was unable to cross back above the $40 level and held the area as resistance. It then saw a period of downward movement for a couple of weeks.
Now, the crypto looks like it may be seeing a bottom and turning back around once more. The $40 level may hold as an area of resistance again if the price can reach it
The crypto trades below both the 50-day moving average and the 200-day moving average, indicating the crypto is seeing recent bearish sentiment. Each of these moving averages may hold as an area of resistance in the future.
The Relative Strength Index saw a period of downward movement and is now climbing back higher once again and sits at 46. This shows that there are slightly more sellers in the market than there are buyers, but more buyers have been entering the market lately.
Ethereum Classic is looking to see a reversal if the price can start to form higher lows again. Bullish traders are looking to see the crypto form higher lows and go on to test the $40 level and be able to cross above it once again. Bulls then want to see this level hold as an area of support and trade in the channel once more. Bearish traders are in control of the crypto and are looking to see it hold below the $40 level as well as the moving averages.

Ethereum Classic breaking out?$ETCUSD has broken upwards from a bearish penant, it’s just lacking volume confirming the breakout, and with the overall bearish sentiment in the overall equities markets it may be hard for people to get bullish. We have bullish divergence on the RSI on 30 min, 1 and 2 hour charts and momentum indicator is turning white getting ready to flip green on these time frames.
There are a few roadblocks though, mainly the pesky EMA ribbon that for 30 min and under charts it is climbing through, but higher time frames are giving resistance. If bullish volume confirms the breakout though I’d expect a measured target to the top of the green arrow, around $26.50/coin for around an 8% move to the upside (or downside if it comes back inside and breaks the other way.)
This coin is priced at 1/8th it’s all time high it set in 2021 right now, and has tons of new development bringing users to the undervalued chain. Check out all the new dapps and NFTs at EthereumClassic dot org
If you’re not aware ETC is the original Ethereum but upgraded over the years without ever compromising integrity, decentralization, or most importantly the immutability of the ledgar, like the overlords of ETH did. They have tried to kill this coin so many times but it will not go quietly. That’s why I put all my profits from shorting the stock market into buying the dip!
