ETC/USDT - Potential 293% SetpHello Traders!
ETC continues to move in a downtrend, completing the previous business cycle.
The price range of $11.30 - $14.50, from which the acceleration of upward movement began in the spring of 2021, will be a comfortable zone for formation of a medium-term position.
It will be necessary to close the position by stop-loss only in case of decrease of the price under the support level of $7.28.
It will be a good opportunity to fix profit on such deal within the price range of $29.00 - $44.50
Good luck and watch out for the market
P.S. This is an educational analysis that shall not be considered financial advice
ETCUSD trade ideas

New Session Bars this is not a trading idea its only an update to my sessions bars script from a long time ago. I only changed the time values so it would work with Cryptos or at least the one im looking at. Anyone is welcome to them. I tried publishing them but i guess they are to old and have to be converted to a newer version and i dont know how. Hell a guy made the original one for me and i dont even know who that was.


ETCUSD: correction unfolding?The linear regression channel pattern is sloping downwards, supporting a bearish trend.
Furthermore, remains below its 200-day simple moving average - confirming a bearish play.
Below 33.20 supports a bearish trend direction.
RSI leaves enough room for further downside price potential.
Wait for the trend to develop further before increasing exposure.

Ethereum Classic (ETC) - February 14Hello?
Traders, welcome.
If you "follow", you can always get new information quickly.
Please also click "Like".
Have a nice day.
-------------------------------------
(ETCUSD 1W Chart)
(All: )
Above 19.220 point: expected to continue uptrend
Above the 36.280 point: Expected to revert to an uptrend.
You need to break out of the downtrend line to accelerate the uptrend.
(1D chart)
If the price is maintained by rising to the 38.376-49.785 section, it is expected to rise above the 57.505 point and continue the upward trend.
If it falls in the range of 14.363-19.220, it is highly likely to enter the mid- to long-term investment area, so careful trading is required.
------------------------------------------
(ETCBTC 1W chart)
0.0009 Above the 70 point: Expected to turn into an uptrend.
0.0018 16 - 0.0023 34 or higher: Expected to create a new wave.
------------------------------------------
We recommend that you trade with your average unit price.
This is because, if the price is below your average unit price, whether the price trend is in an upward trend or a downward trend, there is a high possibility that you will not be able to get a big profit due to the psychological burden.
The center of all trading starts with the average unit price at which you start trading.
If you ignore this, you may be trading in the wrong direction.
Therefore, it is important to find a way to lower the average unit price and adjust the proportion of the investment, ultimately allowing the funds corresponding to the profits to be able to regenerate themselves.
------------------------------------------------------------ -----------------------------------------------------
** All indicators are lagging indicators.
Therefore, it is important to be aware that the indicator will move accordingly as price and volume move.
However, for convenience, we are talking in reverse for the interpretation of the indicator.
** The MRHAB-O and MRHAB-B indicators used in the chart are indicators of our channel that have not been released yet.
(Since it was not disclosed, you can use this chart without any restrictions by sharing this chart and copying and pasting the indicators.)
** The wRSI_SR indicator is an indicator created by adding settings and options to the existing Stochastic RSI indicator.
Therefore, the interpretation is the same as the traditional Stochastic RSI indicator. (K, D line -> R, S line)
** The OBV indicator was re-created by applying a formula to the DepthHouse Trading indicator, an indicator disclosed by oh92. (Thanks for this.)
** Support or resistance is based on the closing price of the 1D chart.
** All descriptions are for reference only and do not guarantee a profit or loss in investment.
(Short-term Stop Loss can be said to be a point where profit and loss can be preserved or additional entry can be made through split trading. It is a short-term investment perspective.)
---------------------------------

etc finished abc corection etc just finished abc zigzag correction , about to start a new impulse wave to the top a good buying opportunity , not financial advise

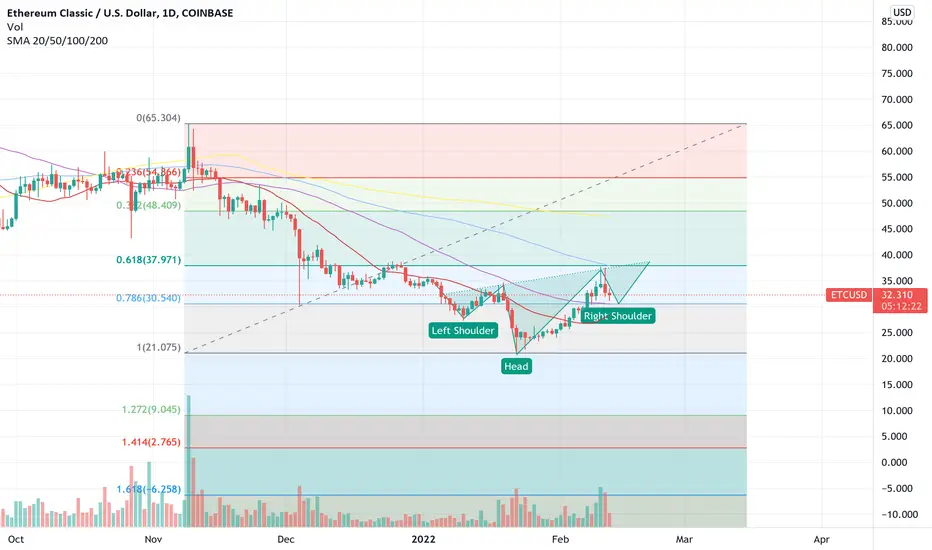
inverted head and shoulders?am not a financial advisor.
ether Classicoutperformed many Alts in 2021 possible to do the same in 2022 and reach 170 dollars again or more.
please take a look at bitcoin. we are not in a bear market yet. Elliot wave of 12345 is not yet finished in bitcoin.
once inflations calms down. we will see a reversal.
btc might hit 40.8- 41 which is the cme gap
but before that happens. we may get a chance to grab some at 30.52 which is the 50ma.
I have my buying order set already
happy trading and happy profit taking
Short Trading Signal For ETC! Time to end this :)Trading Signal:
There is a Trading Signal to Short in ETH/USDT
Traders can open their short trades NOW
Bearlish Bat Pattern:
Bearlish 113 bat Short Signal
Entry:36.40
Stoploss:38.50
tp1:31.50
tp2:27.80
What are these signals based on?
Harmony Pattern Technical Analysis & RSI
If you liked MY ideas, please support me with your likes 👍 and comments.

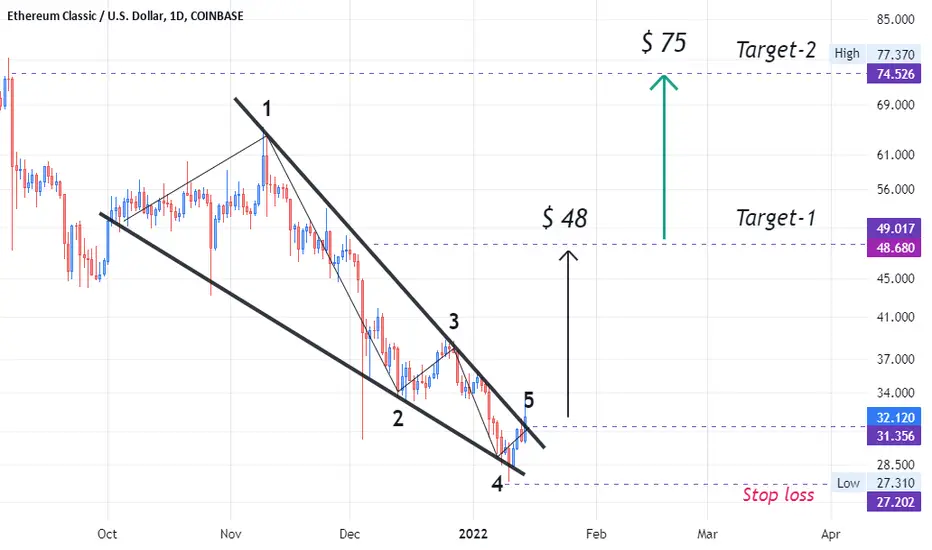
my way to 100k from 1000$ high risk high reword
my target 33
i will ST when i hit 33.9 /34
ps
im up now more than 500%

Ethereum Classic breaks out of falling wedge that started in NovEthereum Classic broke up bullishly from a falling wedge that started back in November and and a general downtrend since hitting it’s all time high last May at $185. Besides the falling wedge, with a target ironically at $55 (one of the points of most resistance this past year), there is a cup and handle forming that is close to breaking out with a shorter term target right near the 2017 and original 2021 ATH of $44.... Either way this is not a coin to count out once it gets bullish unless BTC dumps.
This post is focused on Tecnical Analysis of ETC, I will soon post a detailed fundamental analysis pointing out why the sudden bullish break, exceeding most other altcoin gains and those of BTC+ ETH over the past week.
To sum up the fundamentals though, there is a lot of 3rd party development happening that includes ERC-21 standard NFT’s minted on ETC (for super cheap gas fees), a new DEX (HebeSwap) that brought the community from Hebe token to ETC, HebeSwap has an iOS and Android app featuring a multichain wallet, play to earn game, bridges to every major blockchain, Defi/ yield farming for ETC and other coins, and much more. It’s an all in one tool that will grow in useage exponentially once translations are finished for the daily news and the play to earn games. The rest of the app is in English already, and is available in Apple’s App Store right now.
Daily transactions have been outpacing Dogecoin, Bitcoin Cash and at peaks Litecoin as well over the past 3-6 months, and it’s still growing. Hash rate is near all time highs showing the network is more secure and faster than ever, and there is a record number of active ETC wallets.
Basically the idea that ETC is a dead project or unused network is verifiably false, as now it is one of the fastest growing chains for new development, and the chain itself has a major upgrade coming soon. #Bullish #Long

Crypto Recovery AttemptCryptos have been down really hard but they all show the same pattern like they hit a wall on the bottom
These lows may be a temporary bottom
They may try to turn them around and make an uptrend


ETCCrypto Report
ETC has been steadily going down. It is currently at support if that support is not held then it is headed to $20 support level. That drop will be another 17% down. Any quick run up in ETC will just be faded. So ETC has to start basing to show some strength.

ETC Normal cyclesDont panic this is normal for etc. etc will keep going down keep in mind a rebound is still in the works before the year is over


ETC in short-termHi everyone
A Possible scenario is shown in the chart (there is buying pressure, falling wedge pattern).
Long term analysis:
ETC and Dogecoin Correlation
Seems, the composite operator changes the price behavior!
ETC bottoms outAll ETC indicators have deviated from the bottom
There will be a rebound in demand in the short term
In the short term, I am optimistic about etc
Follow me to take you to achieve financial freedom

Is $32 the new support for ETC?ETC been falling ever since May 2021 with a peak of $175. I believe we are in huge upswing. I believe ETC just broke its first downtrend and is testing $32 as the new support. I believe it will have a rally bounce from $32 and finally break from $34 resistance. If not ETC probably retest $29 but I doubt that.

Ethereum Classic (ETC) - January 15Hello?
Welcome, traders.
If you "follow", you can always get new information quickly.
Please also click "Like".
Have a nice day.
-------------------------------------
(ETCUSD 1W Chart)
Above the 16.722 point: the uptrend expected to continue
Above 36.305 point: Expected to create a new wave.
A stop loss is needed to preserve the profit and loss as it declines from the 36.305 point.
However, if it does not fall below the downtrend line, it is expected to rise, so trade cautiously.
At this point, it needs to rise at least 42.1 points to turn into an uptrend.
However, to accelerate the uptrend, you need to break out of the downtrend line.
-------------------------------------
(ETCBTC 1W chart)
Above 0.000970-0.001374 section: expected to continue upward trend
Above 0.001816-0.002334 section: Expected to create a new wave.
Since it fell from the 0.000970 point, it is entering the mid- to long-term investment area.
Therefore, it is important to keep the price above the 0.000629 point.
------------------------------------------
We recommend that you trade with your average unit price.
This is because, if the price is below your average unit price, whether the price trend is in an upward trend or a downward trend, there is a high possibility that you will not be able to get a big profit due to the psychological burden.
The center of all trading starts with the average unit price at which you start trading.
If you ignore this, you may be trading in the wrong direction.
Therefore, it is important to find a way to lower the average unit price and adjust the proportion of the investment, ultimately allowing the funds corresponding to the profits to be able to regenerate themselves.
------------------------------------------------------------ -------------------------------------------
** All indicators are lagging indicators.
Therefore, it is important to be aware that the indicator will move accordingly as price and volume move.
However, for the sake of convenience, we are talking in reverse for the interpretation of the indicator.
** The MRHAB-O and MRHAB-B indicators used in the chart are indicators of our channel that have not been released yet.
(Since it was not disclosed, you can use this chart without any restrictions by sharing this chart and copying and pasting the indicators.)
** The wRSI_SR indicator is an indicator created by adding settings and options to the existing Stochastic RSI indicator.
Therefore, the interpretation is the same as the traditional Stochastic RSI indicator. (K, D line -> R, S line)
** The OBV indicator was re-created by applying a formula to the DepthHouse Trading indicator, an indicator disclosed by oh92. (Thanks for this.)
** Support or resistance is based on the closing price of the 1D chart.
** All descriptions are for reference only and do not guarantee a profit or loss in investment.
(Short-term Stop Loss can be said to be a point where profit and loss can be preserved or additional entry can be made through split trading. It is a short-term investment perspective.)
---------------------------------

ETC, rising from the bottom.The following content is machine translation:
Formally, it rebounded after repairing the lower shadow line on December 4.
Today's strong rise broke the downtrend line.
The indicator macd is golden fork, and the energy column rushes to the zero axis.
It is expected to continue to rise and see more.


Bullish Flag ETC $600 End of the year?Its been over 8 months since ETC leg up to $175. We have touch the bottom probably 4 times. Is it time for reversal. ETC has form what it looks to be a bullish flag. Ripe for a strong leg up 1.618 fib suggest $280 minimum. Higher fib suggest $500 or $600.
