ETC Is Gearing Up for a Massive MoveOctober, November, and December are going to be historic, and memorable for #ethereumclassic $etc.
Trade and invest at your own risk.
ETCUSD trade ideas


ETCUSDI think ,we can see triangle pattern.
Price is weighting trend line.
I think this line not break.

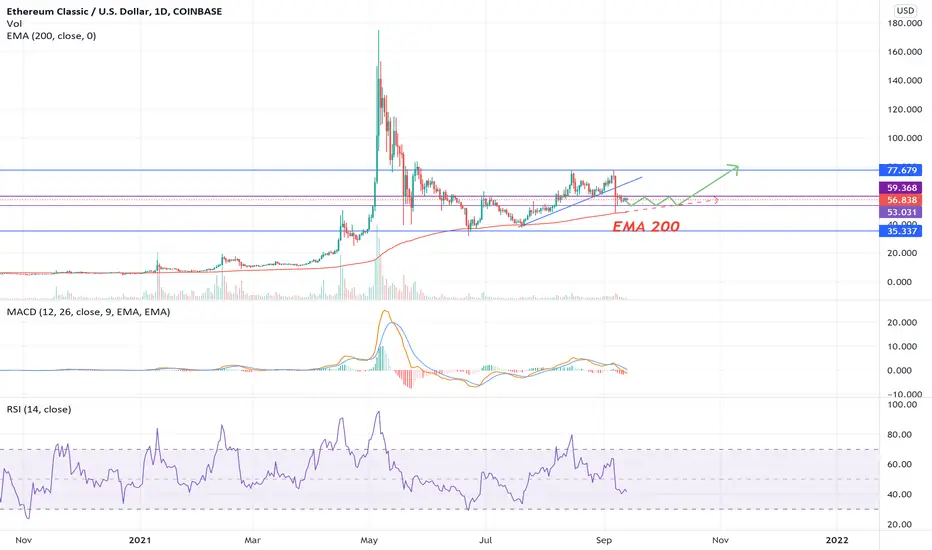
ETC/USD: Bullish butterfly PatternEthereum Classic forming a bullish butterfly pattern. This it's an Harmonic Pattern and it's bullish signal. We're in Daily timeframe and also, Ethereum Classic make support in the EMA 200. So, in medium term, Ethereum Classic could to move up toward $60.25 USD next resistance key and $78.28 USD next up 2nd resistance key. The 2nd resistance key it's my target in $78.28 USD. So, Ethereum Classic it's bullish.
Now, in this screenshot, I make an analysis of Elliot Wave Cycle and we pass the Elliot Wave cycle and Elliot Wave correction. Right now, Ethereum Classic coud to forming a new Elliot Wave Cycle so similar in the past when Ethereum Classic went from $7 USD to $130 USD aprox. Then, Ethereum Classic pass for the correction toward $130 USD toward $40 USD in average. Right now, Ethereum Classic continue ascending in this model where forming like a channel, but I called it what this could to make an explosion in the price in the incoming months.
So guys, what do you think of Ethereum Classic like investment or making a position trading in the market price $51 USD aprox. and put the SL in the $35 USD approx and my target toward $1,000 USD and keep this positon trading during months. This could be a extraordinary profit of over 1,800% if you keep this position during the next months. But yes, using a small average but depending the collateral what do you use for deposit your crypto assets. You can to use 25% of your 100% of your collateral and keep this posiiton to generate your favorite cryptocurrency.
Guys, if you like this analysis, please hand up, share this analysis with others crypto-enthusiastic, traders and people who interesting to know this information about Ethereum Classic.
So, I just entry in this long position toward $78.28 USD. This it's my target and I entry around of $51 USD and I put my SL at $40.50 USD. Now, I think that Ethreum Classic in my own opinion it's that has future, I do not going to invest in this cryptocurrency, but in the future, I may to interesting or I can to make a small leverage to invest a position trading and keep this position trading until $1,000 USD just keeping this position during months.

Ethereum Classic to $1,300 USD in the next monthsI just want to share my idea what I thinking about of this cryptocurrency. There's an interesting sight to look how Ethereum Classic it's preparing to make a new ATH to mark over $1,000 USD in the next months. This it's just my idea. Look, ETC break out the historical maximum price of $46.85 USD and this cryptocurrency could to repeat this pattern multiply x2 the 1,355%. This could to put this cryptocurrency to overpass to $1,000 USD or more.
Now, do you hold this cryptocurrency or you're interesting to trade this cryptoucrrency during this bull rally?

ETCETC close to making a double low high close(DLHC) reversal candle. This is a huge bullish signal. Hope we have a follow through.


ETCUSD Movement for this week (13-21 September 2021)Hellooo...My Dragon Friends
ETCUSD movement for this week...
Lets See
Happy Trading
Smart Trading
Money Management
Risk Management
Disclaimer On

Possible rebound of ETCUSD!!??Hi, guys, this is my first contribution to this community. I just started learning Technical Analysis not long ago, I am studying TA using Technical Analysis of Financial Markets. The current EMA 200 on the daily chart is rising and is about to converge with the price. As you can see on the red dotted line, which is basically an extrapolation of the EMA 200 with the same slope. Now the price is moving in between the 59.368 resistance level and 53.031 support level. currently, as we can see, the EMA 200 is approaching to the support 53.031. I personally believe this will become a very strong support level since both 53.031 support and EMA 200 will provide support. As you move toward the left of the chart, you can see, there are couple incidences in the past . The price bounce off the EMA 200 with substantial gain and none of them penetrate below EMA 200 before the rebound. This time with the EMA 200 higher than before. If the price successfully bounce off the EMA with enough "momentum," we might be able to break thru the 77 price level and reach a new height. What is your thought?
ETCETC now has a clear trend line. But it is still bearish cause its doing a bearish flag. If it can get above $63 we will be back in the bull trend. If ETC breaks below the trend line with volume we might see a big sell off which will take it down to $31 area.

ETCUSD - 1-2 1-2: more correction or imminent wave3 of 3 coming?Hello traders and investors,
If we still consider the idea of a 1-2 1-2, and we keep a bullish long term sentiment on this pair, we could consider last week deep impulse (someone called it the liquidation spike) as part of wave 2 correction. In particular, a-b-c flat regular. with wave C ending at 61.8% of wave minute green degree.... (what a coincidence?).
I think we still need to see a clear bullish impulse that resumes the main trend (which I call wave 3 minutes of wave 3 minor of wave 3 intermediate).
Know, we can discuss the wave degrees, but something very clear to me is: I keep my ETC in my portfolio!!!
Thanks for reading and your appreciation for the recent analysis.

ETCETC just broke down to the lower part of the channel. I would look for a bounce at the bottom support.

ETCETC is setting a clear range. It is not trading in the upper half of the channel. I will look for a break to the upside for long and down side for short.


ETCWatch for resistance at 50% fib retracement and the previous dip. If the price can get above the resistance zone we might be back into a bull trend.

Ethereum Classic (ETC) - September 8Hello?
Welcome, traders.
By "following", you can always get new information quickly.
Please also click "Like".
Have a nice day.
-------------------------------------
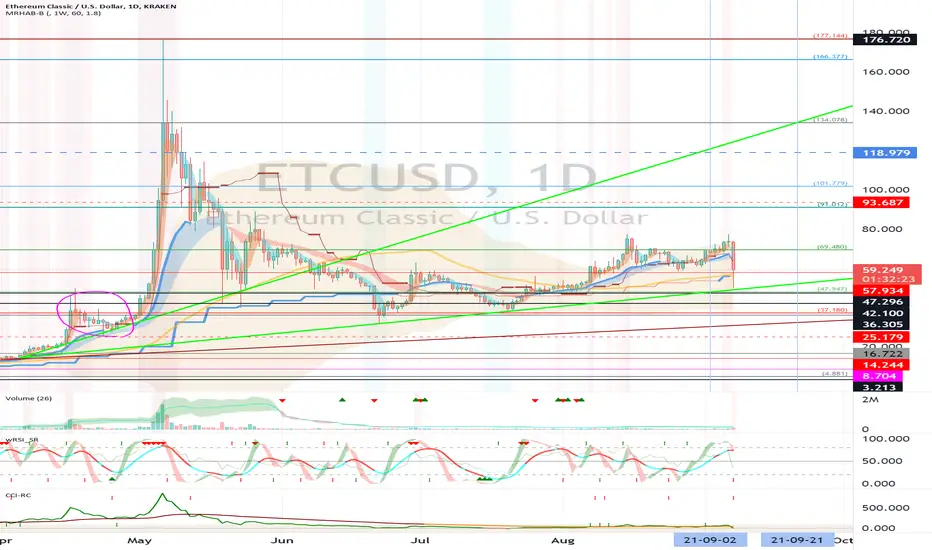
(ETCUSD 1W Chart)
If the price maintains above the 16.722-25.179 range, we expect the uptrend to continue.
In particular, if the price is maintained above the 42.100-47.296 section, it is expected to create a new wave.
(1D chart)
You should see support at point 57.934.
If the price is maintained in the 47.947-69.480 range, it is expected to turn into an uptrend and rise.
If it falls in the range of 37.180-47.947, Stop Loss is required to preserve profit and loss.
However, it is possible to touch near the 16.722 point and rise, so you should also think about reacting to it.
If the price is maintained by moving up to the 69.480-91.012 range, we expect to re-establish the trend in the 91.012-110.779 range.
A significant resistance interval is the 118.979-134.078 interval.
--------------------------------------
(ETCBTC 1W chart)
If the price holds above the 0.000970-0.001374 range, it is expected that the uptrend will continue.
(1D chart)
If the price is maintained in the 0.001274-0.001642 range, it is expected to turn into an uptrend.
If it goes down, you should see support at the 0.001213 point.
If it falls in the range of 0.000723-0.000906, it is possible to enter the mid- to long-term investment area, so careful trading is required.
We need to watch to see if there is any movement to stock up on the upward break through the volume profile spanning the 0.001816-0.002334 section.
------------------------------------------
We recommend that you trade with your average unit price.
This is because, if the price is below your average unit price, whether the price trend is in an uptrend or in a downtrend, there is a high possibility that you will not be able to get a big profit due to the psychological burden.
The center of all trading starts with the average unit price at which you start trading.
If you ignore this, you may be trading in the wrong direction.
Therefore, it is important to find a way to lower the average unit price and adjust the proportion of the investment, ultimately allowing the funds corresponding to the profits to regenerate themselves.
------------------------------------------------------------ -----------------------------------------------------
** All indicators are lagging indicators.
Therefore, it is important to be aware that the indicator moves accordingly with the movement of price and volume.
However, for the sake of convenience, we are talking in reverse for the interpretation of the indicator.
** The wRSI_SR indicator is an indicator created by adding settings and options to the existing Stochastic RSI indicator.
Therefore, the interpretation is the same as the traditional Stochastic RSI indicator. (K, D line -> R, S line)
** The OBV indicator was re-created by applying the formula to the DepthHouse Trading indicator, an indicator disclosed by oh92. (Thanks for this.)
** See support, resistance, and abbreviation points.
** Support or resistance is based on the closing price of the 1D chart.
** All descriptions are for reference only and do not guarantee a profit or loss in investment.
Explanation of abbreviations displayed in the chart
R: A point or section of resistance that requires a response to preserve profits.
S-L: Stop Loss point or section
S: A point or section where you can buy to make a profit as a support point or section.
(Short-term Stop Loss can be said to be a point where profit and loss can be preserved or additional entry can be made through split trading. It is a short-term investment perspective.)
GAP refers to the difference in prices that occurred when the stock market, CME, and BAKKT exchanges were closed because they are not traded 24 hours a day.
G1 : Closing price when closed
G2: Opening price
(Example) Gap (G1-G2)
etcusd coin boometcusd coin is about to explode don't miss this one. get rich with me guys. 400usd boom

SHORTING ETHEREUM CLASSIC - liquidation $77 im shorting ethereum classic with my entire account on x9 leverage
-100k liquidation at $77.1

