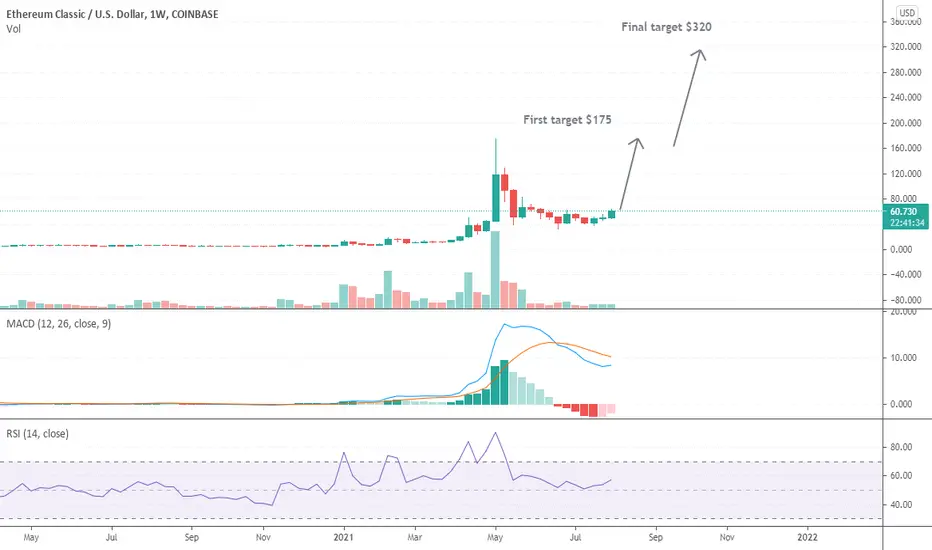
Possible Cup and Handle I believe we may be starting a cup and handle right now and if so all time highs will be in the move before 2021 is over. Good luck and hope my prediction is pretty close.
ETCUSD trade ideas


ETCUSD hovering over crucial price ! Breakout Soon ? ETC is hovering over the top of the retracement rally of 30th June and finding some resistance.
Break of this would take ETC to 130usd i.e the 0.702 retracement.
ETC current structure is quite similar to its entire bear market from 2018 that lead its way to $180.
In this structures,ETC sets a low ,retraces to 0.236 and falls down without setting a new low.
When ETC retraces back to 0.236 ,it really had to work hard on this area before the breakout.
But once it broke that level, there wasn't any real resistance after that.
So ETC may retrace to 0.702 after breaking the 66usd price/0.236 retracement level or it may follow its previous structure and head straight to its ATH.
NFA

ETC is primed for a massive breakout ! [SHORT UPDATE]ETC has been hovering over the 58-60usd region since last few days.
Now it has cleared the 0.702 retracement of the fall down from 8th August.
The structure looks bullish.
Next Target in ETC : 130USD i.e the 0.702 retracement of the whole move up to the bottom of the correction.
#NFA

ETC/USD Spot buy signal on 9th August 2021On 9th August , we have signal to buy ETC/USD on spot or small margin around 53-54 usd which is strong support area, also when RSI on H1 touch the 30 zone (oversold zone)
Trading plan : buy ETC around 53-54usd when it pullback to the strong support zone, move stop loss to entry when have profit, target TP1 : 56 usd TP2: 58 TP3: 60

Ethereum Classic ETC - MASSIVE parallel channel + TRIANGLE!- We have a huge parallel ascending channel on the daily chart, which provide us with great support/resistance!
- Bullish volume is much higher, than bearish volume!
- Ascending triangle is also very bullish!
- The price is above 200 daily moving average.
- For expected duration of the trade, probability, stop loss, profit target, entry price and risk to reward ratio (RRR) - please check my signature below ↓
- If you want to see more of these ideas, hit "Like" & "Follow"!

ETC to test ATH soon?Weekly MACD bullish cross-over forming.
ETH now PoS, ETC hashrate increasing... does higher demand = higher price?
Many people missed the first ETC rally.
Could go huge......

My trade We have seen in many pairs before (xrp, btc,doge) the same formation. 7 waves before a massive increase in price.
Let’s not forget we are testing the previous All time highs.
Amazing trade right now.

Triangle Breakout Hello Traders
On the Daily chart we can see Etc is currently in a Triangle Pattern.
We are not far from a Bullish Breakout, be Patient to Receive the reward.
Im preparing to go for a Long position.
stay with the markets, lets see what happens

Ethereum Classic (ETC) - August 3Hello?
Welcome, traders.
By "following", you can always get new information quickly.
Please also click "Like".
Have a nice day.
-------------------------------------
(ETCUSD 1W Chart)
If the price maintains above the 16.722-25.179 range, we expect the uptrend to continue.
In particular, if the price is maintained above the 42.100-47.296 section, it is expected to create a new wave.
(1D chart)
If the price is maintained in the 47.947-69.480 range, it is expected to turn into an uptrend and rise.
If it goes down from the 37.180-47.947 range, you can touch the 16.722 point, so you need to trade cautiously.
-------------------------------------
(ETCBTC 1W chart)
If the price holds above the 0.00097 point, it is expected that the uptrend will continue.
In particular, if the price is maintained above the 0.0013736 point, it is expected to create a new wave.
(1D chart)
If the price is maintained in the range of 0.0012739-0.0016415, it is expected to turn into an uptrend.
If the decline from the 0.0012739 point, you can touch the 0.0007226-0.0009064 range, so you need to be careful with your trades.
------------------------------------------
We recommend that you trade with your average unit price.
This is because, if the price is below your average unit price, whether it is in an uptrend or in a downtrend, there is a high possibility that you will not be able to get a big profit due to the psychological burden.
The center of all trading starts with the average unit price at which you start trading.
If you ignore this, you may be trading in the wrong direction.
Therefore, it is important to find a way to lower the average unit price and adjust the proportion of the investment, ultimately allowing the funds corresponding to the profits to regenerate themselves.
------------------------------------------------------------ -----------------------------------------------------
** All indicators are lagging indicators.
Therefore, it is important to be aware that the indicator moves accordingly with the movement of price and volume.
However, for the sake of convenience, we are talking in reverse for the interpretation of the indicator.
** The wRSI_SR indicator is an indicator created by adding settings and options to the existing Stochastic RSI indicator.
Therefore, the interpretation is the same as the traditional Stochastic RSI indicator. (K, D line -> R, S line)
** The OBV indicator was re-created by applying a formula to the DepthHouse Trading indicator, an indicator disclosed by oh92. (Thanks for this.)
** See support, resistance, and abbreviation points.
** Support or resistance is based on the closing price of the 1D chart.
** All descriptions are for reference only and do not guarantee a profit or loss in investment.
Explanation of abbreviations displayed in the chart
R: A point or section of resistance that requires a response to preserve profits.
S-L : Stop Loss point or section
S: A point or section where you can buy to make a profit as a support point or section.
(Short-term Stop Loss can be said to be a point where profit and loss can be preserved or additional entry can be made through split trading. It is a short-term investment perspective.)
GAP refers to the difference in prices that occurred when the stock market, CME, and BAKKT exchanges were closed because they are not traded 24 hours a day.
G1 : Closing price when closed
G2: Opening price
(Example) Gap (G1-G2)

ETCUSD - Ethereum Classic Trading PlanETCUSD - Ethereum Classic Trading Plan
We have a three wick rejection on the trendline with support bouncing back, with the confluence of fib I am expecting the 63- 66 level being a particularly area of interest to determine the next move. This area could be broken with ease to the higher levels to 95 and dropping lower before going to 170's or bounce off the 63-66 level and drop back to initial support before the next big move is determined.
Please like, share and comment - I am always happy to meet likeminded traders - Please check out my previous ideas.
Thanks


ETCUSD 8/1/2021Note: NOT A FINANCIAL ADVICE TO BUY/LONG OR SELL/SHORT
_________
Technical Analysis
Elliot Wave
I have been buying this coin in a price range of $ 35.00 to $ 43.00. Seems like, my previous TA works well. Ethereum (ETH) is in a proof of stake this year. I think ETH miners will be mining Ethereum Classic (ETC). Since, they have the same mining algorithm. If you see the global hash rate chart of ETC, there is a sudden surge of hash rate. I think, some ETH miners are now slowly transferring to ETC. I know also that ETH hash rate is currently recovering as of the moment. As of the moment, It’s still more profitable to mine ETH than ETC. ASIC & GPU Manufacturers releases their new product to supply the big demand for Crypto Mining. Bitmain releases Antminer E9. Innosilicon release ASIC miner too. On GPU manufacturers, there is a rumor that Nvidia may release 4000 series in 2021 while AMD releases 7000 xt series. That’s my bullish argument to support ETC’s price action in this Elliot Wave. Not a financial advice.
Weekly
Daily
4HR
1HR
_________
Note: NOT A FINANCIAL ADVICE TO BUY/LONG OR SELL/SHORT

💥ETC LIKELY MOVE - FALL TO $35, THEN LONG TO $60, $80Please support this idea with a LIKE👍 if you find it useful🥳
We have Etherum classic in a descending triangle. A breakout from this triangle could confirm a good buy to the neckline at $60 before $80.
We also have a possible double bottom pattern in play. For this pattern to work out well, I expect a fall to $30 - $36 before a long position to $60 and $80
What do you think?
Share your opinion in the comment section✍️
Happy Trading💰🥳🤗


ETCUSD Watch these bullish signalsEthereum Classic broke this week above the 1D MA50 (blue trend-line) for the first time since June 04 but has so far failed to convincingly close above it. However there are a few bullish indicators to keep an eye on as a rally may be in the making.
I have used the Pitchfork to illustrate a few key trend-lines. First I'll start by highlighting the significance of the 1D MA200 (orange trend-line) which has been holding as a Support since January 04. Also both the LMACD and the Ichimoku are on a Bullish Cross (the Ichi has just done so). This has some similarities with the February - March accumulation phase which also was made within a Channel Up.
In my opinion as long as the 1D MA200 is holding here, we may start seeing a sustainable rally on ETCUSD.
** Please support this idea with your likes and comments, it is the best way to keep it relevant and support me. **
--------------------------------------------------------------------------------------------------------
!! Donations via TradingView coins also help me a great deal at posting more free trading content and signals here !!
🎉 👍 Shout-out to TradingShot's 💰 top TradingView Coin donor 💰 this week ==> RyodaBrainless
--------------------------------------------------------------------------------------------------------

Descending Triangle - for ETCUSD On day level, I can see descending triangle is forming and potentially it can push stock-price downwards

ETC LONG to 88.00 From There Short to 16.00 use stopETC LONG to 88.00 From The Short to 15.00 use stop

ETC- Ethereum Classic Possible increase to 60 usd + 30% + inc..Hello trading friends,
ETC shows a possible day trend breakout for the coming time - if this target plays out we could see a 30% increase trend on ETC.
With the trend, it can still break down - but the whale interest on the level increase is still possible, as this coin can get a choice out since whales have some effects to choose a coin. ETC is not only interesting.. but it have also the TA to increase.
Targets
TP 1 56 usd +
TP 2 60 USD + this could be a 30% + increase
As always manage your risk always, and don't enter any coin with no SL.
Have a great time.
we will follow coming time this coin and update the targets as we do always.
Follow like for more. thank you


ETC- Critical zoneif this cryptocurrency fails to break out of the 60s, its doomed and that goes for most altcoins on their last legs of support.
I believe this is the correction we have all been waiting for.
manage risk accordingly!
