Possible move for ETC !!The buying position is between $ 92 and $ 93, this idea will be considered only if we manage to break that resistance from $ 89. Good luck!!
ETCUSD trade ideas


Inverted h&s with negative momentum decreasing Still looks to be in this giant flag?
Possible inverted head and shoulders.
Negative momentum decreasing.
MACD looking to pop over.
EMAs converging.
If Elon can stay off his phone for a few minutes maybe we can see a pattern play out.
Be patient.
Trade smart.

ETC Falling Wedge with Hidden Bullish DivergenceBreakout and backtest complete, higher low and Hidden Bullish Divergence on daily timescale. Dropping volume on the way down adds to sellers' exhaustion argument. Targets: top of the structure, measured move confluent with psychological resistance and 1.618 fib level. By far my favorite crypto chart right now, showing very similar set of variables to BCH trade that got us 100% returns 2 weeks ago.

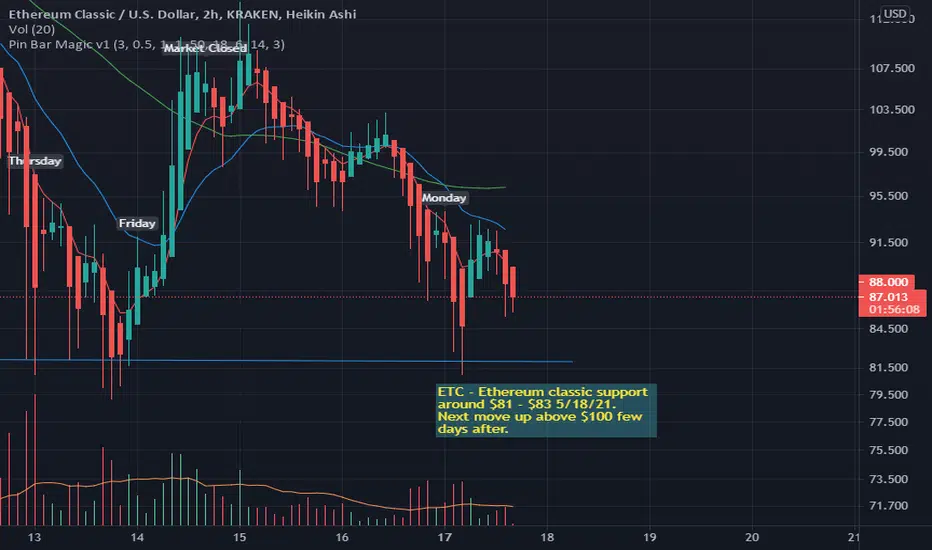
ETC - Ethereum classic support around $81 - $83 5/18/21ETC - Ethereum classic support around $81 - $83 5/18/21. Next move up above $100 few days after.
Just an idea, Not Financial Advice. Your trades can go to $0.00, do your homework!!
ETC DailyNot an advisor.
Here is an update to ETC. This is the daily chart, a lot of time left before this daily candle closes but I thought something was worth pointing out.
We have a potential Hammer reversal candle playing out.
I have this chart under log scale so you can see the rapid growth of ETC and you can see the overall trend just a little bit better.
If this Daily candle closes as a Hammer Reversal, we stand a good chance to start rising up into that pitchfork and seeing further uptrend until ETC is absolutely ready to breakout. I don't believe its quite there yet because the bollinger band isn't squeezing to solidify further breakout.
The Hulling Moving Average is still above the current price, and is acting as a magnet to keep the price from further dropping. It appears to be trying to pull it over to get it above the down trend line we are currently seeing in the consolidation (flag) zone. The longer this flags out the more accelerated the growth should be. In which we were just given price target for $500. Could very well be on our way to that. Time will tell, this still has plenty of time to play out. Daily timeframe and 4 hour are my favorite time frames to watch this unfold. Plenty of time to see what is happening with the price action. This is still in strong uptrend, just currently trading sideways. This is a good thing! RSI is at 54 and appears to be a little flat yet. Watch for that to curl up.
Not much has changed with this, its still in uptrend. Simply waiting for a reversal candle to play out to continue to rise up.


ETC Tight consolidations a large breakout is going too happenSame plaining scenarios Should be seeing a climb in a month max but it could happen sooner or just consolidate some more

ETC - did we find classic support?Following my T2 posts, the market is at the daily low, this presents a nice buy-in spot for classic which follows T2 well
-------------------------
Which coins to buy?
Please message me for the top altcoins each week- track my success
Please message me for information on the latest (ICOs) Initial Coin Offerings; How to buy altcoins before they are tradable.

ETC updateNot an advisor.
As previously posted, I have a price target of 200 for ETC. Giant flag, Simple as that. Well, one thing I'm seeing based off the chart is volume is basically dead. Which is a strong indicator that a price movement is to come about. Average volume usually drops down tremendously before a breakout. We have a nice reversal candle. Bollinger bands are squeezing up, another good sign for breakout after consolidation. Looking for these next few candles to come up and break through the 200 MA, if we don't there is a strong possibility that we drop lower. However, I believe we have the strength to bust through this and get started to to see some new highs, it will take some time to see it. But we should be under way in retesting the previous high. Stoch indicator is curling up on the blue line, once that crosses over the orange that will signal additional strength to the bull run. RSI is at 49.87 currently, I typically consider that bullish once it crosses over the 50 from how I've been taught. (situational- this would be a situational time)

ETC WILL BREAKOUT VERY SOON!!After an amazing run to $175, ETC is in a period of consolidation with reduced volume and has formed a strong support at $80.
IF Bitcoin descends even lower to 46k, ETC will most likely retest the strong support.
HOWEVER I believe Bitcoin should breach its current resistance line meaning ETC will continue its next leg up and form a breakout!
TARGET 1 $180
TARGET 2 $300

ETC support and resistamceHi everyone
In this analysis, I tried to show you the support and resistance of the classic ethereum in the weekly time frame. Take a close look at each of the tools and indicators used on the chart.


Ethereum Classic Unstopable ! Is coming 1240$ It is not an Investment Advice.
The transaction volume is not decreasing. This is extremely important. We managed to turn the direction at $ 90. I said it in the comment in my previous post.
ETH= 4440-4540-4740-4940$ the same time ETC=282-440-540-740-940$ this is my guess.
We say wish. If we bought it again at $ 10-15.
We collect between $ 0-130 just to avoid saying I wish.
We do not have a purpose like selling, we are focused on Collecting at the moment. We are very happy with the thought.
Winter is coming to for you // ETC Bears
What is Ledger Nano and Unknown Wallet?
I say to 1000$ , I am a little fund manager.
I do not like to brag about old writings.
But my Analysis holds 100% so far.
I and my team are on duty 24 hours a day.
We slap the slightest bear ever seen. Our job is to manage funds.
We manage our Clients' money.
In return for this job, we get 10% from 100%.
We report and organize our Purchases and Sales Separately.
We have no lost customers since 2013. There is something called Inflation in the world.
States Print and Distribute Unlimited money.
So why am I sharing this information?
I share it so that people who buy Shit coin or pump coins, which are always making losses in the increasing market, do not lose 100 times when they earn 100 times.
I am aware that I always give long. But while money continues to flow, who sells their goods cheaply?
The stock market is a constantly evolving and news-hungry market.
The market reacts to every bad news or comment.
Reacts with every good news.
Market prices are priced as expected.
Don't be afraid of proven coins.
ETC is in the bull market.
It is important to increase the number in the Bull Market.
You can not own money and become a Millionaire with 1 item.


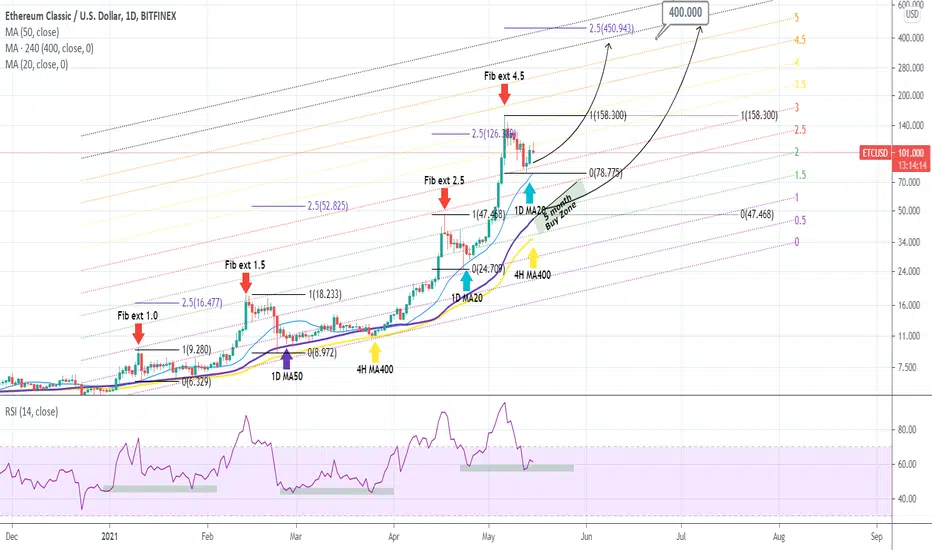
ETCUSD Two Buy Levels for short and long-termPattern: Fibonacci Channel on 1D.
Signal: Buy short-term on the 1D MA20 (light blue trend-line) which has been a confirmed buy level since April 23. Buy long-term within the 1D MA50 (dark blue trend-line) and the 4H MA400 (yellow trend-line) which has been a confirmed buy zone since January 03. 1D RSI on Support (Double Bottom).
Target: 400.000 (below the 2.5 Fibonacci extension assuming 78.000 was the bottom). It is also below the 5.5 Fib ext of the Channel.
** Please support this idea with your likes and comments, it is the best way to keep it relevant and support me. **
--------------------------------------------------------------------------------------------------------
!! Donations via TradingView coins also help me a great deal at posting more free trading content and signals here !!
🎉 👍 Shout-out to TradingShot's 💰 top TradingView Coin donor 💰 this week ==> xBTala
--------------------------------------------------------------------------------------------------------
Time for Bulls The price has hold on 38.2 on the Fibonacci retracement.
We can see the market going Bullish.
There can be some Consolidation after breaking Resistance.
Target can be set 138.20 of the Fibonacci retracement
Price around 260
