ETCUSD Bullish Bat with MACD and VRSI Bullish Divergence We have a Bullish Engulfing at the PCZ of a Bullish Bat with Bullish Divergence on the MACD and VRSI
This is also all happening at the PCZ of a much bigger Bullish Butterfly as seen below but for now i will focus on the current Bat.
ETCUSDT.P trade ideas

Trading opportunity for ETCUSDTBased on technical factors there is a Buy position in :
📊 ETCUSDT
🔵 Buy Now 16.34
🧯 Stop loss 14.50
🏹 Target 1 18.25
🏹 Target 2 20.00
🏹 Target 3 22.75
💸RISK : 1%
We hope it is profitable for you ❤️
Please support our activity with your likes👍 and comments📝

ETCUSDT wants the pullback?The price is testing the resistance after the price had a false breakout from the dynamic support.
How to approach it?
IF the price is going to have a breakout and retest the local resistance as new support we could see a pullback until the 18$ area, so According to Plancton's strategy , we can set a nice order
–––––
Keep in mind.
🟣 Purple structure -> Monthly structure.
🔴 Red structure -> Weekly structure.
🔵 Blue structure -> Daily structure.
🟡 Yellow structure -> 4h structure.
⚫️ black structure -> <= 1h structure.
–––––
Follow the Shrimp 🦐

✴️ Ethereum Classic Weekly | Falling Wedge Clear Picture (120%) It doesn't need any analysis does it?
Ethereum Classic (ETCUSDT) on the weekly timeframe gives a clear picture.
We have the classic falling wedge pattern and a perfect -9 on the TDs showing up.
We have a long-term higher low when looking back at June and the value area also points up.
No need for more analysis... Over 120% possible in 2023 Q1.
Namaste.

Coinbase to delist Ethereum Classic ETC from Coinbase Walletpast chart
Coinbase to delist Bitcoin Cash (BCH), Ethereum Classic (ETC), XRP (XRP), and Stellar ( XLM ) from Coinbase Wallet!
My price targets:
ETC/USDT short
Entry Range: $19 - 20
Price Target 1: $16.77
Price Target 2: $14.24
Price Target 3: $12.82
Stop Loss: $23

ETC/USDT waiting for entry zoneGood morning guys
Next one on our watchlist is going to be ETC token. Well we won't talk much here - we see that we need to exit this yellow zone for our next movement to happen so that's what we are going to wait for. Here we would like you to take a look at BB indicator and EMA zones before entering any position on this trade!
If you like ideas provided by our team you can show us your support by liking and commenting.
Yours Sincerely,
Swallow Team 🔱
Disclamer:
We are not financial advisors. The content that we share on this website are for educational purposes and are our own personal opinions.

Shorting ETC yet! Showing the distribution pattern!! Feel like gonna drop a lot. It is kinda meme coin tbh it looks like a risky trade but I'm taking it with 3 percent of my portfolio.. The meat looks fresh and juicy.

ETCUSDTRisk warning, disclaimer: the above is a personal market judgment based on published information and historical chart data on Tradingview, all analysis is only subjective. Hope investors consider, that I am not responsible for your investment decision.
Thank you.
Good luck


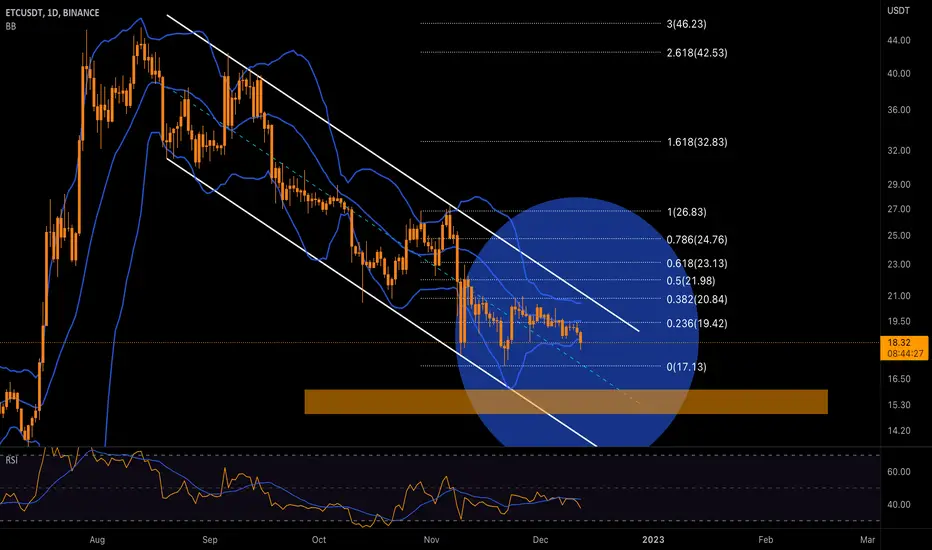
ETC - Technical review and analysisThe price of Ethereum Classic is in a downward trend in many timeframes. A decline in price to the considered support levels is expected. The first support range is $17.75-$16, and there is a possibility of breaking this level due to the lack of buying power.
Therefore, closer but more important support is considered in the range of $14.90-$16. If the price hits this level and forms a possible positive divergence, we can expect a positive swing from This range to be seen up to the ceiling of the descending channel. This support area overlaps with the midline of the main descending channel, and given that the biggest bullish wave of the past few months started from this level, a return to this area could activate some dormant buy orders. We expect the price to return only in case of a good and strong reaction.
ETC/USDTlooking good for spot buying at price 19.15
stoploss 2.5%
target 1 almost 7%
and
target 2 is almost 16%

Ethereum Classic(ETC) is preparing for the fourth BIG move!As you can see on the chart that my indicator showing Ethereum Classic is preparing for the forth Big move!
The first volatility warning signal happened on June 10 with the drop of 35.90%
The second volatility warning signal happened on July 17 with the pump of 212.75%
The theird volatility warning signal happened on Oct 11 with the pump of 23.78%
The fourth volatility warning signal has been maturing.....
I am not going to predict the direction of this movement.
I will follow the trend when there is a big dark(red) or White(Green) occurs.

ETC potential inverse H&SHi everyone,
I will appreciate for ur activity. Thank you!
We have potential Inverse H&S and I think that after some consolidation we will continue to rise into our main resistance zone .
Targets: 22 - 23 - 24.5
Stop: 17.5
RR: 1 to 3
I hope my work suits you and you are satisfied.
DYOR!

ETCUSD ❕ under the liquidity zoneTrading volumes are down, the asset is down under liquidity.
Price successfully tested 50EMA as resistance (4H TF)
I expect the continuation of the decline after the price fixes under the liquidity zone.

ETC/USDT Possible movement Hello guys
Let's kick of today with ETC coin right here. We see that the triangle formation has been broken down and price is currently inside the support zone which means that that zone is weak and might be broken as well. Once we break that level we are good to short this coin until we reach lower levels
If you like ideas provided by our team you can show us your support by liking and commenting.
Yours Sincerely,
Swallow Team 🔱
Disclamer:
We are not financial advisors. The content that we share on this website are for educational purposes and are our own personal opinions.

ETCUSDT 8HI'm bearish on ETC. Bull only when we break the $21 level and fixed above it, otherwise we will go down badly.

ETCJuly was a very productive month for ETC! And the price has risen by about 200%. Then he rolled back almost to his original position. And now it is in the vicinity of a strong price zone. I think that from this mark, ETC will unfold and gain a new growing trend. And most likely after breaking through the price of $25, this level will become a point of no return. And the nearest potential growth will reach the price of $33.

ETCUSDTIt is expected that the rise to the specified areas will be a corrective rise, not an impulse, including the drainage of another strong last downward process

ETCUSDTFormed Descending Channel In h12 Timeframe
Incase Of Breakpout Expecting 70 to 805 Bulish Wave

ETC showing good signsHello,
This is an update to my previous ETC ideas
IDEA 1:
IDEA 2:
In both of those ideas, one can see that we are the support zone.
If it falls below this it's a bad sign.
However, if it rises above $27.00 then we can consider it a proper bullish break .
For now, it's just neutral.

ETHEREUM CLASSIC, a long term vision. ETCUSDTHello my friends, A multi timeframe analysis of ETC and a long term vision for investment if you still trust crypto for next months and years. two points to buy 16$ and 12$ , so you can consider it and manage your money.
Good luck
If you like the idea, do not forget to support with a like and follow me for next analysis :)
Write your comment and opinion below for me

ETC Falling WedgeETC has been following this FALLING WEDGE for quite a while. The IDEAL BREAKOUT TARGET for a FALLING WEDGE is the BASE of the WEDGE.
But everything follows the KING ( btc ). I don't think we have seen the BOTTOM yet. Thus , I don't think this falling wedge will reach it's IDEAL BREAKOUT TARGET. But the 2 marked area can be good QUICK long trades.
PLEASE MAKE SURE , you know how to TAKE QUICK TRADES.
Non Financial Advise. Trade at your OWN risk. Do your OWN RESEARCH.

ETCUSDT continuation of growthHello traders,
Based on the chart, we are in an ascending channel, I assume that the growth will continue.
Targets: 22 - 23.5 - 25
after first target reached move ur stop in breakeven!
SL: ~18.3
Risk/Reward: 1 to 3
Good luck!
Please, feel free to share your point of view, write it in the comments below, thanks!
