ETC: when for $9?If you look at the global price movement, you can see that the coin is now in a downward structure.
The downtrend and the signal of the indicator show that it is better not to buy in long-term deals. Short positions remain in priority.
If we consider purchases, then only within the day and with short take profits.
In the future, I think that the price will continue to decline to $ 9. There is support in the form of an uptrend here, and there has not yet been a buy signal from the indicator.
ETCUSDT.P trade ideas

5 Classic Signals Tells Us Ethereum Classic Will GrowWe have a convergence of multiple classic signals on the Ethereum Classic vs Tether chart.
Let's look at those now.
1) The classic falling wedge pattern.
2) The very common higher low (Nov.-higher vs June-lower).
3) Price bounce after hitting below the 0.786 Fib. retracement level.
4) Strong RSI (bullish above 50).
5) Trading above EMA10.
Each of these signal is strong enough by itself...
In conjuction, the paint a clear for ETCUSDT; The bullish bias here is strong.
Namaste.

ETCUSDT Elliott Waves AnalysisHello friends.
Please support my work by clicking the LIKE button👍(If you liked). Also i will appreciate for ur activity. Thank you!
Everything on the chart. (update)
Almost nothing has changed from my last idea,
We complicated the corrective structure to a double zigzag (wxy).
Entry: market and lower
Target: 27 - 37 - 55
MAIN TARGET ZONE: 50-60$
after first target reached move ur stop to breakeven
Stop: ~13 (depending of ur risk). ALWAYS follow ur RM .
Risk/Reward: 1 to 7
risk is justified
Good luck everyone!
Follow me on TRADINGView, if you don't want to miss my next analysis or signals.
It's not financial advice.
Dont Forget, always make your own research before to trade my ideas!
Open to any questions and suggestions.

The true thinking process of the banks - Forex Master Pattern
Hello there traders, in this article I have compressed information which will be useful for every trader. There is this trading methodology which very little know of (Even though its public information) that revolves around a market cycle which consist of an contraction, expansion, and trend.
This article will just open the doors to your understanding of these principles, and will just go over the basics, to master it you must practice it a lot and identify many different zones in the markets.
Practice Makes Perfect
__________________________________________________________________________________________________________________________________________________________________
What will be gone over in this article?
This article will explain what exactly are contraction phases, expansions, and trends and how to identify these different market phases.
Get a basic understanding of what institutional traders look for and how they operate vs Retail.
What exactly is the value line and how it acts like the "center of gravity".
__________________________________________________________________________________________________________________________________________________________________
What is the Forex Master Pattern?
The “Forex Master Pattern”, is a alternative type of Technical Analysis which shows the true psychological patterns of the Financial Markets. This pattern has 3 Phases, which is known as the Contraction, Expansion, and the Trend Phase, which will complete one market cycle in this term.
This pattern also creates a concept known as the “value line,” which is the fair value zone or the neutral belief zone where buyers and sellers agree is the fair value. Consider it in terms of the center of gravity.
This pattern is present on every timeframe and in every market with enough liquidity and volume, and shows the behavior, psychology and activity of retail, professional traders, institutional traders and investors and market makers.
__________________________________________________________________________________________________________________________________________________________________
The Contraction Phase
The contraction phase is the setup and it indicates a period that the market is in consolidation, with a tight and narrow range. During the contraction phase there is going to be low institutional volume and they are avoiding positions and trades. It is best to avoid trade entries in this phase and wait for a clear trend after the expansion.
The Expansion Phase
The expansion phase is the play and its when the institutional traders begin to accumulate positions. There are many things that institutional traders would do in this phase. If the institutional trader or "market maker", main goal is to buy the asset, they will drive the price lower with their money to draw in retail traders to place shorts and sell their positions which will generate liquidity for "smart money" to buy cheaper. and vice versa.
If the institutional trader or "market maker", main goal is to sell then they will make the price go up a little with their own money to lure in traders who will buy their bags so that "smart money", can sell in a profit and overvalued.
The Trend Phase
The trend phase is the final phase that completes this market cycle. Once the institutional traders feel like it is time for them to start taking profits, will commence the distribution cycle which causes price to move down. All this profit taking from "smart money", will eventually lead retail traders to understanding that they were in the wrong side of the trade and the panic, liquidations, and stops start. Eventually they panic and start buying back in, and this generates liquidity for institutional investors and traders to take profits, leaving retail with overvalued bags, for the cycle to repeat itself again.
For the short scenario it'll be a vice versa too, they will move price up with their own money, cause retail to believe the price is going up so that they get into wrong trades (Retail buys, Smart Money Shorts), they start accumulating short positions or selling their bag and with the trend drive price back to value or even below, and at this point retail again begin the panic, liquidations, and get stopped, and ultimately sell their bags to institutional traders who buy at a discount.
This pattern is also similar to the accumulation and distribution cycle and are basically the same theories with different executions.
__________________________________________________________________________________________________________________________________________________________________
What is the value line?
Previously in this article I have explained how contraction zones create fair value lines. Value lines can be described as the average price and the neutral belief zone for price. It sorta acts like an center of gravity. Knowing the HTF value lines can be your key to success since you will understand the general direction of the market.
Value lines help you visually understand what territory the market is in, like if its consolidating at value you should avoid entering any trade at all cost and wait for the expansion and perhaps the trend.
These value lines and contractions can also be used to find certain broadening wedge ranges and the longer price stays in a proper broadening wedge the more volatile it will get. The broadening wedge starting from the origin of the contraction is rare to find but can create some pretty good scalping environments and conditions.
Conclusion:
Well I hope this was educational, and it gives you another way of understanding the markets. This article was pretty basic in understanding this pattern and methodology but hopefully now you have more awareness. The best way to start understanding these principles is to practice in the charts and learn to identify the three phases.
This isn't a strategy but more like a theory or a concept which explains the behavior of the market. With proper understanding you can create many different strategies since this is extremely versatile and works on any market and timeframe if the liquidity is there.
So go on the charts and try to identify the three phases and see how you can improve your trading game!.

ETC-USDT - November 24ETC is moving under 20 from last few days but over all its moving within 17 - 22 area. Still very limited after dropping from 25 . ETC is in triangle and holding its main support of 17 . If ETC can't h old its main support then it will touch its new low of 2022.
Right now it should hold its main resistance of 22 and if it breaks it then 25 will be its first target but before going up it can retest 22 area. If we see the current scenario of the market then there are less chances to go up but 22 is the strong point which will decide upward or downward movement.
ETC is moving according to the Etherium and if ETH is up then its up and if ETH is down then it will be down as well.
Weekly Chart
-------------------
Note
Please never follow anyone blindly and always remember following key points:
1- First and Last thing in trading is patience.
2- Risk management in trading is a Key so use your money accordingly.
3- Please Don't think I'm always right. I could be wrong, same as every other trader.
4- I always posted my thoughts, not financial advice.
5- Please use your mind and try to get knowledge about market. It will help you in future
Thank you and Good Luck!

ETC/USDTETC/USDT
It is on a support zone where we encountered an upward divergence.
It has also had a good reaction.
I think it can grow up to 23 dollars.

ETC Short-Term S&R>>>>>>>>Hello EveryOne
I Have Tried My Best to Bring the best Possible outcome in this Chart.
In case of more market support,
And in case of hit and stablize above
that area , ETC price can start another short rally price.
But so far,
The ETC price shown weak volume support in the reversal trend.
So We must wait for more signal data for prove this scenario.
All important price in short-term marked on the chart.
It's just a analyze.
Not a financial advise.
(reviewed by TrendAnalyze/technical pattern/PriceAction/supply & demand.)
PLZ DYOR
With hopping success>>>>>>>>>>>

ETC/USDT looks interesting to short soonHello guys
Let's kick of today with ETC coin right here. Well triangle formation was broken + re-test of upper resistance zone failed to be broken so we see a good chance for a free fall here. What do you think guys?
If you like ideas provided by our team you can show us your support by liking and commenting.
Yours Sincerely,
Swallow Team 🔱
Disclamer:
We are not financial advisors. The content that we share on this website are for educational purposes and are our own personal opinions.

ETCUSDT is testing the dynamic support above the weekly
The price is testing the dynamic support above the weekly inside the ascending channel
How to approach it?
IF the price is going to lose the support and retest it as new resistance, According to Plancton's strategy , we can set a nice order
–––––
Keep in mind.
🟣 Purple structure -> Monthly structure.
🔴 Red structure -> Weekly structure.
🔵 Blue structure -> Daily structure.
🟡 Yellow structure -> 4h structure.
⚫️ black structure -> <= 1h structure.
–––––
Follow the Shrimp 🦐

Long idea on ETCExpected shark pattern ,
Long current price
Target D
Immediate stop loss mention in chart

ETCUSDT Elliott Waves AnalysisHello friends.
Please support my work by clicking the LIKE button👍(If you liked). Also i will appreciate for ur activity. Thank you!
Everything on the chart.
Entry: market and lower
Target: 40 - 50 - 60
after first target reached move ur stop to breakeven
Stop: ~15 (depending of ur risk). ALWAYS follow ur RM .
Risk/Reward: 1 to 5
risk is justified
Good luck everyone!
Follow me on TRADINGView, if you don't want to miss my next analysis or signals.
It's not financial advice.
Dont Forget, always make your own research before to trade my ideas!
Open to any questions and suggestions.

Etc now we can see easily bearish momentem ,Etc is a very good project of crypto and etc now available for a mining. I think this crypto currency is the one the best fundamental coin for future , we can see easily now etc us bearish momentem in some High time frame we can see price easily 13.5$to 14$ and and I think this is the bottom off etc but 14$ to 10$ range a very good for a etc he quickly recover for crash may be can be see double bottom on 13to 14$ then price break a one + year downing fall channel ,then etc go to moon , etc add your portfolio

✅TS ❕ ETCUSD: going up✅✅ ETC is going up.
This is a correction.
I expect growth to resistance.✅
🚀 BUY scenario : long to 24.32.🚀
----------------------------------------------------------------------------
Remember, there is no place for luck in trading - only strategy!
Thanks for the likes and comments.

ETC BULLISH FLAG 🤓🚩🤓🚩🤓🚩Hi dear traders
ETC has formed a bullish flag🏁 pattern.
In the daily time, bullish divergence is seen.
I expect the price to rise to the bottom of the ascending channel.
You can wait for the approval of the template to enter.
EMA20 plays the role of resistance, it must pass through this resistance to climb.
All targets specified.
Let's see what happens
This is not financial advice ( DYOR )
Good luck

✅TS ❕ ETCUSD: bounced off✅✅ ETC bounced off the support level.
The price went up.
A correction is possible, after which growth is expected.✅
🚀 BUY scenario : long to 24.32.🚀
----------------------------------------------------------------------------
Remember, there is no place for luck in trading - only strategy!
Thanks for the likes and comments.

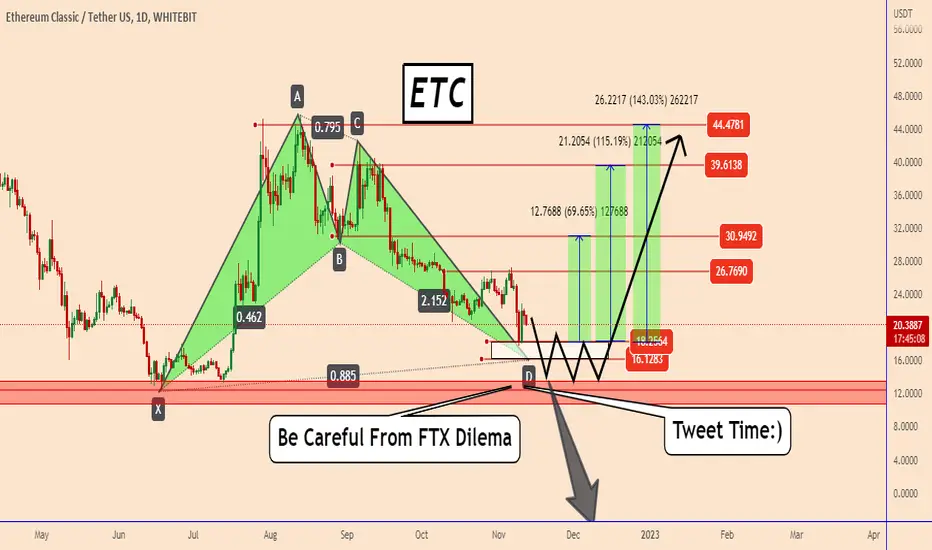
ETC: We Can never Know When The Next TWEET Will Come...ETC: We Can never Know When The Next Tweet Will Come...
I am neither bullish nor bearish during these moments for the crypto market. The current problem with FTX has already created a huge mess in the entire crypto industry and now everyone is expecting the worst.
However, we can't be only bearish just because of the news, and we can't be bullish too. Sometimes it is also better to wait until everything calms down and later you can execute your trading plan.
You might think why are you still positive?
Was it the CEO of Binance who with one TWEET dumped the market and it was his TWEET again that pumped/dumped the whole market?
So we can never know when the next Tweet will come...
PS: This setup is not ready yet...we have to wait to trade it once the FTX issue is fully resolved,
Thank you and good luck.
ETC POSSIBLE H&S formation! Nothing changes after this crash!After the crash of the market bacause of Alameda and FTX I rebild the drawings and the possible figure it's even more beautiful!

ETCUSDTHello traders ,what do you think about ETCUSDT? It is in a low-risk position to buy .You can enter a buying position with a SL below the specified range
If this post was useful to you, do not forget to like and comment.❤️

🔥 ETC Can Fall Much More: Capitulation AnalysisAround two months ago I made an analysis on ETC and the bearish price action I was expecting. It took a while, but over the last two days my last target has been hit.
I think we can potentially fall much further. First target at $14. If things really get out of hand we might even fall to $10, see the dotted bottom support.

Ichimoku Analysis for ETCShorted $ETC here with a sl of 31 as we got a price and lagging both below the kumo cloud.

Trading opportunity for ETCUSDTBased on technical factors there is a Short position in :
📊 ETCUSDT
🔴 Short Now 20.52
🧯 Stop loss 22.52
🏹 Target 1 17.00
🏹 Target 2 13.50
🏹 Target 3 10.30
💸RISK : 1%
We hope it is profitable for you ❤️
Please support our activity with your likes👍 and comments📝

ETCUSDT Prospects for Ethereum classic price movements in futureBefore you is the global graph of the ETCUSDT trading pair
After the rapid growth of the ETC price in 2021 by +3700%, since May 2021 the price has been in a downtrend for more than a year.
The correction of the ETCUSD price from the maximum value of $179 was -93%
It seems that during June-July 2022 the bottom and the completion of the correction and after a powerful shot of the ETCUSDT price upwards by 111% was formed
It is very likely that the banal, ETCUSDT price flew up so rapidly following the price of its expensive fork - ETH (this project is over saturated with promising news in the future)
By the way, here our a global idea for ETHUSDT, which works well.
So, after such a rapid growth, a price correction is needed.
Buy zone where the ETC price can roll back - $18.40-21.40
That is, strong cryptocurrency market = weak correction = $21.40
Again, negative in the cryptocurrency market = deep correction = $18.40 or even lower.
The target from above for the next strong wave of growth is in the area of $44
_______________________________
Since 2016 , we have been analyzing and trading the cryptocurrency market.
We transform our knowledge, trading moods and experience into ideas. Each "like under the idea" boosts the level of our happiness by 0.05%. If we help you to be calmer and richer — help us to be happier :)

ETC LongDaily MS Shifted to bullish. price reclaimed a very strong S/R zone. I would long the retracement to the golden pocket and the daily OB breaker. anywhere between 22.37-23.37 is a good long. stop below the low
