ETC SHORTAfter the rapid trend, ETCUSD is now in static support and the Fibonacci golden zone of 0.618, but it has undergone a sharp correction. I think it cannot break the downward trend and descend to the lower levels
ETCUSDT.P trade ideas
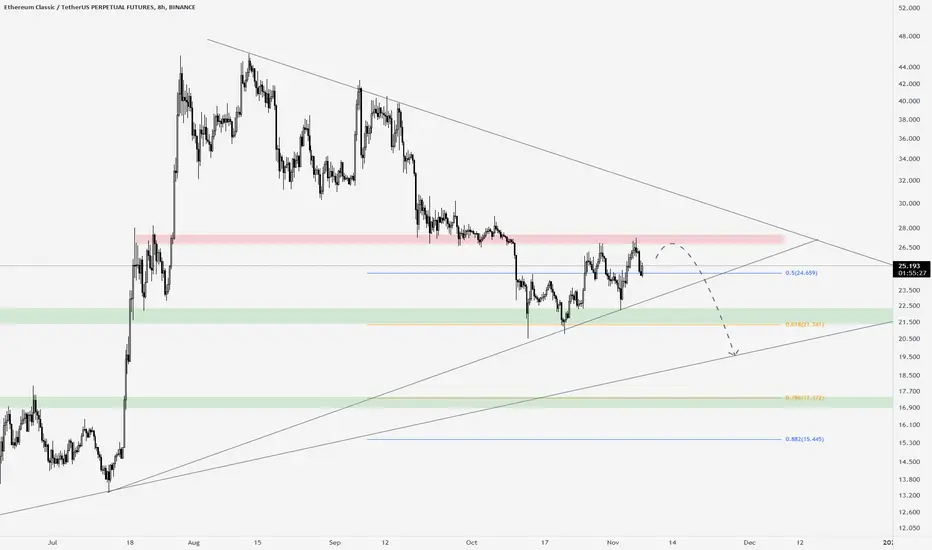
ETCUSDT Support Range And 3 Resistance Levels UpdateAs you can see, after the price hits the 61.8 level and this level becomes a support, you can see how beautifully this level appears in its role and supports the price, and the price goes up to the next resistance, but it cannot Keep it and it will decrease.

ETC BIG LONGWeakening of the downtrend in daily time
A positive divergence in valid timeframes as well as a bullish condition of the entire crypto market index creates an entry signal.

ETC/USDT - LONG SCALPING-- Support me with numbers and follow up on my account for other deals in the future. Thank you for coming to this part. --
-------------------------------------------------------
⚡️⚡️ ETC/USDT ⚡️⚡️
Exchange: ByBit USDT
Trade Type: Breakout (Long)
Leverage: Cross (5.0X)
Entry Orders:
1) 24.71 - 100.0%
Take-Profit Orders:
1) 25.435 - 60.0%
2) 25.925 - 15.0%
3) 26.56 - 15.0%
4) 27.525 - 10.0%
Stop-loss Orders:
1) 23.35 - 100.0%
Trailing Configuration:
Stop: Breakeven -
Trigger: Target (1)

ETCUSDT Support Range And 3 Resistance LevelsThe support range and 3 resistances are drawn in front of the symbol in the chart.

ETC POSSIBLE H&S formation!With the uncertanty in the markets some ALTCOINS are experiencing a pretty good growth!
Here an idea of a POSSIBLE Inverted Head & Shoulders formation with the explanation of the growth! The figure is not formed still and we need to see the complete formation of the right shoulder!

LONG ETCETC on local Support Good for Long
Daily MS Shifted to bullish . price reclaimed a very strong S/R zone. I would long the retracement to the golden pocket and the daily OB breaker. anywhere between 22.37-23.37 is a good long. stop below the low

Ethereum Classic ETC bullish ahead of the FOMC Press ConferenceI am bullish on Ethereum Classic ETC ahead of the FOMC Press Conference.
Those are my price targets:
ETC/USDT
Entry Range: $23 - 25
Price Target 1: $28
Price Target 2: $34
Price Target 3: $41
Stop Loss: $19

ETCUSD ❕ downtrendETC is moving in a downward channel under liquidity.
On the 4H Timeframe, the outermost candle forms an upper ascending shadow, which indicates weakness in buyers.
RSI is in the bearish zone (4H TF)
Price has broken down 50EMA (4H TF)
I expect a decline after fixing in the channel.

Short ETCUSDTUtilizing DOW theory to spot the trend and find out the best possible entry with bullish candle stick patterns.
Looking at the 1h timeframe, instrument is not making more higher highs (HH=26.86), need to confirm the downtrend from new LH,LL. We get the confirmation upon breaking first HH suggesting a bullish trend . I will look for a bearish candle pattern(bearish engulfing forming) in buy range 24.6-24.4 to get best higher possible entry as compared to previous LL (Dow Theory). Hence a possible short position is there with stop loss a little above previous Lower high and take profit at 6.80 and 7.0.
Short Position
Risk 2%
Reward/Risk : 2
Buy zone : 24.6-24.4
STOP Loss : 25.01
TP1: 24.0
Tp2 : 23.50

ETC/USDT might do an interesting move soon! Hello guys
Another one on our watchlist is ETC/USDT but this time on 4hr chart. Currently sitting at support zone near $24 we see that this zone is holding but yet still shows weakness with no impulsive movement from support zone - pressure is pretty big.
So what we are waiting is a smaller breakdown from current level which would then be followed with a correction before another breakdown where we would enter the trade. What do you think guys? will it show a bullish movement or bearish one?
If you like ideas provided by our team you can show us your support by liking and commenting.
Yours Sincerely,
Swallow Team 🔱
Disclamer:
We are not financial advisors. The content that we share on this website are for educational purposes and are our own personal opinions.

✅ETC : Possibility for increase✅ETC: Possibility for increase
it can show coming time on a low time frame increase

ETCUSD ❕ broke down the upward channelETC formed a bearish divergence with RSI, confirmed by volumes (4H TF)
RSI chart has entered bearish zone (4H, 1H and 30m TFs)
I expect a decline with the price fixing under the lower boundary of the channel.

✅TS ❕ ETCUSD: reached resistance✅✅ ETC has reached resistance.
The price has already formed the top and has gone down.
I expect the fall to continue.✅
🚀 SELL scenario : short to 24.35.🚀
----------------------------------------------------------------------------
Remember, there is no place for luck in trading - only strategy!
Thanks for the likes and comments.

#etcetc look bullish , so if you not holder and you are trader
you can get benefit with it
cause we have some refer to go to up

ETC/USDT4h Time Frame we are above the 200 EMA and 200 MA which is acting as support, on the daily time frame for the 200 EMA and 200 MA we are facing a bit of resistance. White lines are the descending channel pattern, which is often a a reversal pattern to the upside, and inside of the descending channel we have a symmetrical triangle which is the green lines, I have labeled resistance and support for the patterns.

ETC/USDETC/USD is making HHs & HLs. made HL with inside bar so probably it will be a trend continuation.


ETC ___ Short signal 🔥🔥🔥🔥Hello every one ❤
Hello traders ✌🏼
This is a short signal in 1H on ETC
🟢🟣🔴🟡This position is set by kasimado Patterns.
QM patterns, which are very old on the surface, but on the inside, they are extremely difficult and confusing, and finding the exact entry point is very difficult.🟡🔴🟣🟢
🔴This signal has been selected with high precision and I hope everyone can use this signal.🔴
🔵My recommended leverage for this signal is 8-10X.🔵
💞💖Please support me so that I can send you more signals and expand my activity.💖💞
Good luck✌🏼

ETC - Head and ShouldersAfter its remarkable run, ETC seems to have topped its price action above $26.
It currently has formed a head and shoulders pattern on the 1H time frame which seems to suggest that further price action to the downside is expected.
Would open a short here with:
TP: $23
SL: $26


$ETC Quick Short TradeETC has been in an overall downtrend since its high at $45.
Leg down should be soon. Highly possible to hit $21.
SL: $24.37
TP: $21.3
