ETCUSDT | Well, miners, are they mining?Hello trader Today I prepared a new idea for you. Like and subscribe to the channel there is a lot of useful information✅
Friends from the last signal, we never came to test the countertrend one.
While you can see that the asset is starting to consolidate in the range of $33-35, I think from this zone you can try to gain a long position for a small percentage of the deposit (3-5%)
ETH is still gaining momentum but it could be a trap, I wrote about it in another post! So be careful and work with risk management!
ETCUSDT.P trade ideas

EtcUSDT Can go again ?etc looks trying fix its value about 40 this week
we have a problem with volume but let see

Prepare for a drop- Resistance around 51.1 - 52.36
- Support at 27.14 and further at 23.55
Wait for BOS (break of structure) or DROPPPP

ETC ready for longterm FLY!ETC is ready to fly. ETC broke out of a long-term bearish channel and hit a nice pullback. No matter what happens to the bloody cryptocurrency market in September, but considering the end of the Ethereum mine, this chart is a spectacular chart!

If Ethereum classic start Bull run, first target could be 45🙂Personal idea: based on the recent movements of Ethereum classic, possibly second run of Elliot waves will start and in this case, with this pull back, first target could be around 45 and second could be around 52-55. Importantly we need price around 30-33 as support. Good 🙂 luck.

ETC | Bullish Flag? Will The Price Rise More?ETC | Bullish Flag? Will The Price Rise More?
As we all know when the news about the ETH merge and the
upgrade from POW to POS we saw that ETC made a very nice bounce.
All was related with the fact that the miners would have moved from ETH to ETC
or other coins and ETC had higher chances for mining.
However, the market is still expecting and the situation is not clear yet with ETH Fork etc
and now ETC is still waiting.
The price is developing a very big bullish flag pattern.
For some time I am expecting the price to move between 30.5 and 45.40
The price can develop in this area for a long period of time.
Once the price jumps above 45.5 it means that something good happened
and the price should continue to grow more.
Thank you and Good Luck!

ETCThe price fell to the lower border of the symmetrical triangle, but bounced up to the daily 100 MA. The bullish scenario will again send the price to the upper border of the pattern. The bearish scenario will lower the price to the area of strong support at $25-26

ETCHELLO GUYS THIS MY IDEA 💡ABOUT ETC is nice to see strong volume area....
Where is lot of contract accumulated..
I thing that the buyers from this area will be defend this long position..
and when the price come back to this area, strong buyers will be push up the market again..
UPTREND + Support from the past + Strong volume area is my mainly reason for this long trade..
IF you like my work please like share and follow thanks
TURTLE TRADER 🐢

Ethereum Classic (ETC) !W scenerioScenerio 1
Short if next wee candle ends in red forming a continuous bearish trend pattern
Scenerio 2
Long if next week candle end in green, breaking the bearish trend line. Wait to bullish reversal candle stick pattern

$ETC - Number Go Up 🚀🚀Short and medium term PTs for $ETC; Using fibs and traditional TA.
Catalyst: $ETC hashrate to the moon.

ETC in tight consolidation!👀holding near recent highs while many other tickers are dumping! this is a good sign for any longs here. Once bull markets back it probably goes parabolic.
watching for longs above 46.04 🟢
shorts below 29.54 🔴

ETC CAN PROFIT THE MOST FROM MERGE!ETC is one of the coins that can profit from the merge, and even more then ETH in %.
There are different reasons why ETC is the one that can benefit from this merger.

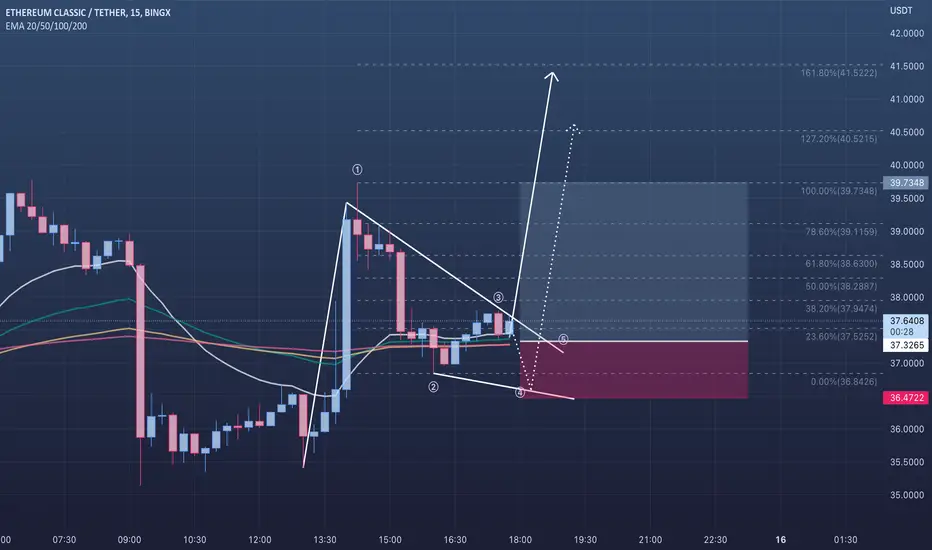
🟢 ETCUSDT - 15M (15.09.2022)ETCUSDT
TF: 15M
Side: Long
Pattern: Cup + Handle / Bull Flag (Potentially)
Entry: Between $37.3265 & $36.4722
SL: $36.4722
TP 1: $37.5252
TP 2: $37.9474
TP 3: $38.2887
TP 4: $38.6300
Possible bullish flag formation on 15M on the back of a cup and handle.

ETCUSDT 12h The medium-term goal is $80 per ETCFirstly, we congratulate all Ethereum fans on the successful activation of The Merge and the transition from POW to POS
The last hours were very tense and accompanied by increased volatility
If the ETHUSDT price reacted with moderate growth
Then the ETCUSDT price look like is preparing for rapid growth.
In order to confirm the serious intentions of miners and ETC buyers, that they want drove its price very high, first the ETCUSD price must be fixed above $44
Well, then the way will be open for growth in $80 are a
Increased trading volumes in the ETCUSDT pair indicate that there is strength and enthusiasm for growth.
_______________________________
Since 2016 , we have been analyzing and trading the cryptocurrency market.
We transform our knowledge, trading moods and experience into ideas. Each "like under the idea" boosts the level of our happiness by 0.05%. If we help you to be calmer and richer — help us to be happier :)

Ethereum Classic Wyckoff RE-AccumulationMost are familiar with accumulation/distribution schematics but, most are not familiar with reaccumulation schematics which you find in STRONG markets & have many similarities to distribution. There are a few ways this can go moving forward. The main thing to look for is the creek forming and the volume when the price action comes down to the lower of the range again. Being that ETC has alot of miners jumping back over to mine ETC since the ETH merge is right around the corner ETC has some strong price action coming in.
Here are the definitions for the for the accronyms on this RE-Accumulation schematic for a better understanding of each move.
PS—preliminary support, where substantial buying begins to provide pronounced support after a prolonged down-move. Volume increases and price spread widens, signaling that the down-move may be approaching its end.
SC—selling climax, the point at which widening spread and selling pressure usually climaxes and heavy or panicky selling by the public is being absorbed by larger professional interests at or near a bottom. Often price will close well off the low in a SC, reflecting the buying by these large interests.
AR—automatic rally, which occurs because intense selling pressure has greatly diminished. A wave of buying easily pushes prices up; this is further fueled by short covering. The high of this rally will help define the upper boundary of an accumulation TR.
ST—secondary test, in which price revisits the area of the SC to test the supply/demand balance at these levels. If a bottom is to be confirmed, volume and price spread should be significantly diminished as the market approaches support in the area of the SC. It is common to have multiple STs after a SC.
PSY—preliminary supply, where large interests begin to unload shares in quantity after a pronounced up-move. Volume expands and price spread widens, signaling that a change in trend may be approaching.
BC—buying climax, during which there are often marked increases in volume and price spread. The force of buying reaches a climax, with heavy or urgent buying by the public being filled by professional interests at prices near a top. A BC often coincides with a great earnings report or other good news, since the large operators require huge demand from the public to sell their shares without depressing the stock price.
AR—automatic reaction. With intense buying substantially diminished after the BC and heavy supply continuing, an AR takes place. The low of this selloff helps define the lower boundary of the distribution TR.
ST—secondary test, in which price revisits the area of the BC to test the demand/supply balance at these price levels. For a top to be confirmed, supply must outweigh demand; volume and spread should thus decrease as price approaches the resistance area of the BC. An ST may take the form of an upthrust (UT), in which price moves above the resistance represented by the BC and possibly other STs before quickly reversing to close below resistance. After a UT, price often tests the lower boundary of the TR.
SOW—sign of weakness, observable as a down-move to (or slightly past) the lower boundary of the TR, usually occurring on increased spread and volume. The AR and the initial SOW(s) indicate a change of character in the price action of the stock: supply is now dominant.
LPSY—last point of supply. After testing support on a SOW, a feeble rally on narrow spread shows that the market is having considerable difficulty advancing. This inability to rally may be due to weak demand, substantial supply or both. LPSYs represent exhaustion of demand and the last waves of large operators’ distribution before markdown begins in earnest.


Did will Ethereum Classic grow up after Ethereum POS .. ?If there is a change that the merge of ethereum will pump ethereum classic this stop order will to his work

ETCUSDT - Targets and Stoploss - Interval 4HHello everyone, let's take a look at the 4H ETC to USDT chart as you can see the price is moving below the local downtrend line.
Let's start by setting goals for the near future that we can consider:
T1 = $ 37.51
T2 = $ 38.41
T3 = $ 39.29
T4 = $ 40.52
and
T5 = $ 42.14
Now let's move on to the stop loss in case of further market declines:
SL1 = $ 36.49
SL2 = $ 35.58
SL3 = $ 34.90
SL4 = $ 34.19
and
SL5 = $ 33.17
Looking at the CHOP indicator, we can see that in the 4H range we have a lot of energy, while the MACD indicator indicates that we are entering an uptrend locally.

$ETCUSDT UPDATE!!!Hi Snipers,
Please refer to the recording for the next price levels and scenarios.
Thanks
MS

Etc is buy In the chart, everything is characteristic.. we have a channel in daily who is trying to break the roof of the channel. First target 41. In case of channel failure You can target from the ceiling tp2:44 tp3,:46.5 tp4;51 Touch it. It has the power to rise up to 61 in the weekly time

ETCThe price has formed a symmetrical triangle. If the fall continues, then the price should consolidate at the support level in the POC area. If the price consolidates above the daily 50 MA, then the uptrend will continue

ETCUSD ❕ potential weakness of buyersETC is moving near the upper limit of the trading range.
RSI is testing the uptrend line.
I expect that the asset may decline if the price fixes below the support level.
