ETC Price ChartThe price chart for Ethereum Classic BME:ETC appears promising. Once it confirms a breakout from the marked blue zone, it could signal a good entry point. It's essential to use a stop-loss for risk management.
Everything is on the chart
ETCUSDT trade ideas

ETC/USD Local work.Logarithm. Time frame 1 day. Local work.
Line chart.
Secondary trend. Time frame 3 days.
ETC/USD Secondary trend. Downtrend channel. Pivot zones.
Main trend. Time frame 1 week.
ETC/USD Main trend. Channel.

ETC/USDT | EthereumClassic |1D 👀Today, we'll consider adding a dinosaur of the market to the portfolio:
1. An old fork of Ethereum, which has faced many issues since 2016 but has nonetheless survived.
2. This clearly isn't the coin that will bring you tens of multiples, but it's worth noting that during the last bull run, the asset was priced at $130.
- Not financial advice, trade with caution.
✅ Stay updated on market news and developments that may influence the price of EthereumClassic. Positive or negative news can significantly impact the cryptocurrency's value.
✅ Exercise patience and discipline when executing your trading plan. Avoid making impulsive decisions driven by emotions, and adhere to your strategy even during periods of market volatility.
✅ Remember that trading always involves risk, and there are no guarantees of profit. Conduct thorough research, analyze market conditions, and be prepared for various scenarios. Trade only with funds you can afford to lose and avoid excessive risk-taking.
#Crypto #EthereumClassic #Investing #ETC

ETCUSDT - BULLISH CONTINUATIONETCUSDT came out of its bearish trend when it printed first HH and HL on Hrly TF. It has again printed HH and HL and no divergence is seen. Its likely that trend may continue so long positions may be looked for.

Ethereum Classic: Grayscale's Hidden Gem Ready for a Bull Run!Hello, crypto enthusiasts! Today, we're focusing on Ethereum Classic (ETC), a coin that's been quietly preparing for a breakout.
ETC has a unique position in the crypto market, largely due to its significant backing by Grayscale, one of the largest digital currency asset managers. Grayscale's Ethereum Classic Trust is its third-most valuable single asset trust, holding more than $280 million worth of ETC. This represents a substantial institutional backing that could potentially attract more investors to ETC.
What's more intriguing is ETC's historical performance during bull seasons. If you've been in the crypto space for a while, you might have noticed that ETC tends to pump quickly and significantly at least once every bull season. This pattern, combined with the current market conditions, suggests that ETC could be gearing up for another impressive run.
Looking at the charts, ETC is showing promising signs. The technical indicators are bullish, and the price has been stable above key support levels. This, coupled with the fact that ETC has been quiet for a while, could mean that a sudden takeoff is on the short-term horizon.

#1 Ethereum Classic. The strong follower.ETC/USDT
Ethereum classic is holding above the big support zone of $23.60 as long as the price is above that region, the move is to the upside.
We might see a sky rocket on it, that's what I am actually expecting, but anyway, an uptrend move has to come, EMA's are positioned well for an uptrend move.
Do not forget, ETC is very good for long term.
A KEEPER.

ETC USDT PHello Trader BINANCE:ETCUSDT.P
The nearest support area is in the 22,996 area and when the bounce area is confirmed, it can be sure to bounce back from the area and continue bullish again.
Please add a comment and Positive feedback and constructive criticism are important to authors and the community.
Disclamer: Not Financial Advice

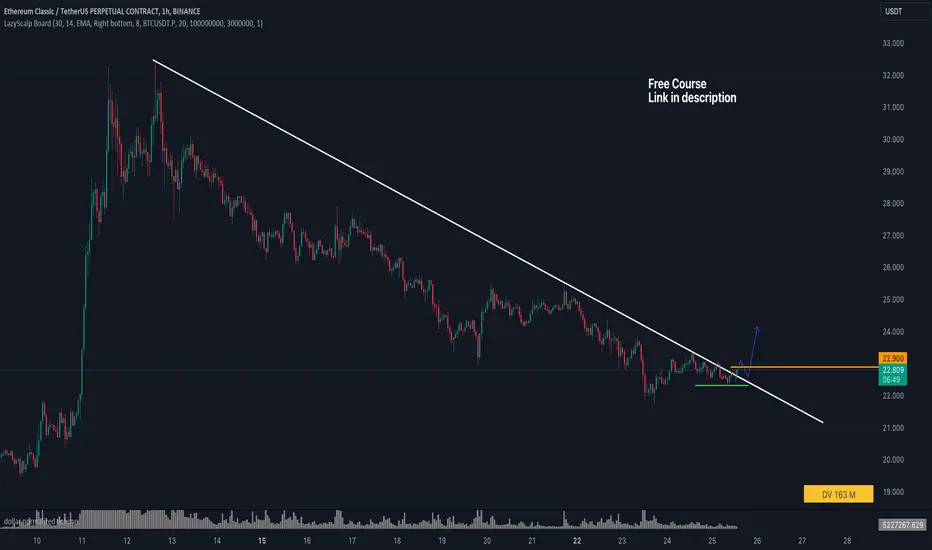
LONG #ETC 1h TF.
The tool has formed an inclined resistance. At the moment, the price is consolidating under resistance. Trading volumes are high, the glass ribbon is active.
There is a potential for price growth. We expect a breakdown of the inclined resistance of $22.9


ETC LongLooks like crypto coming back to life, another nice and easy pullback after a recent upswing.

ETCUSDT.PIt appears that the price is approaching the 4-hour Point of Interest (POI), which looks promising. Additionally, I've noticed that both the 4-hour POI and the 1-hour Order Block (OB) coincide. Therefore, I anticipate a favourable reaction in this zone with a potential upward bounce.
Please write your opinion on this analysis in the comments.
If you find the analysis helpful, it would be appreciated if you share it with your friends.

ETC/USDT Keep an eye on this support. Bounce or Break down ??💎 ETC's market trajectory recently has garnered significant attention. A week ago, ETC successfully breached a key resistance level and is currently in a retesting phase at what was previously a resistance, now serving as support.
💎 If this retesting proves to be valid and ETC bounces off this support level, it could signal an extension of its upward movement, probability challenging the strong supply and bearish Order Block (OB) areas.
💎 However, should ETC fail to maintain this support level, it might indicate a false breakout. In such a scenario, ETC's price could revert to a downward trajectory, possibly reaching the demand area around $18.7 to gather momentum for a potential bounce.
💎 In the event of such a downturn, ETC would be perceived as reentering a bearish phase due to the false breakout. For a bullish resurgence, ETC would need to reclaim and consolidate above the $24 support level. If ETC aims to resume its upward journey and reach projected targets, maintaining this level is crucial. Conversely, a breach of the $18.7 demand level could lead to further decline, potentially driving ETC towards a more substantial support area.

ETCUSDT losing uptrend on 15M, Good RRR for Short positionAs you see on chart ETCUSDT losing uptrend on 15M, Good RRR for Short position (in uptrend) but also for breaking support line (but for that you need to wait for confimation after closing another candles)...


EtcEtc price in near to break the bulishflag i believe we can win 50 %
Targets are
32$
40$
45$
Make your stop loss near 22$

Long ETCIn the rapidly evolving landscape of cryptocurrency markets, the ETCUSDT (Ethereum Classic against the US Dollar) pair is currently capturing the attention of investors. Here are some insights into the investment opportunities for this pair:
Entry: 25
Stoploss: 24.502
Take profit: 27.491
Risk Warning:
Before engaging in any investment activity, investors should also consider potential risks that may arise. Here are some points to note:
Market Volatility: Cryptocurrency markets often experience significant and unpredictable volatility. Such fluctuations can impact the price of ETCUSDT and result in losses for investors.
Fundamental Factors: Events such as global news, economic changes, or even shifts in the economic landscape can have a substantial impact on cryptocurrency prices.
Profits and Losses: Investors should remember that all investments come with risks. Setting profit targets is essential, but it's equally important to acknowledge the potential for losses.
Risk Management: Proper risk management through the use of stop-loss orders and setting reasonable profit expectations is key to protecting investment capital and maintaining stability throughout the investment process.
Before making any investment decisions, investors should conduct thorough research, listen to expert opinions, and, most importantly, invest only what they can afford to lose.

#ETCIn the daily time, it is moving in an ascending channel, which, if it maintains the $21.85 area, it will have the ability to break the resistance and reach the ceiling of the channel. Otherwise, it will correct to the floor of the channel at $19.

ETCUSDT EtcUsd has entered a perfect buy zone. accumulation should be done heavily as breakout is soon to happen.

Short Trade on ETC/USDTOpened a short entry on resistance, 80% Take Profit on Previous low, moved Stop Loss at break even.

ETCUSDTThe price is trading around 26.40, we saw an impulse in the price and from that impulse, 50% Fib retracement is placed around 25.40 which acts as support level. Long position can be considered upon the confirmation. 32.45 acts as resistance level which it breaks then price can test 36.33 and 41.22 level. Stop loss is placed below 21.

✴️ Ethereum Classic Ultra-Bullish Signal ($48 Target Or Higher)Ethereum Classic has been through the longest consolidation phase in its history —The longer the consolidation phase, the stronger the move that follows.
Seeing that ETCUSDT has been printing higher lows since June and is full time bullish, this indicates that a major bullish move is in the making.
That's it, plain and simple.
👉 We expect this move to reach $48 or higher. This can happen fast once the consolidation box/range breaks.
We will keep you updated as the chart moves and the pair grows.
Remember to do your own research to be better prepared.
Thanks again for your support... See you on the next one.
Namaste.

ETC - Long - Elliott Wave 15M Wave 5 formed and ABC in process. Fibonacci zone utilized for target projection with stop loss placed below 5. Let's see if we can get some momentum and scoot on above 30!
