ETCUSDT SHORTThis is a very complicated pattern we have been following for more than a year now.
Ethereum Classic is probably forming a Double Diametric pattern which is a very rare and complex pattern.
We are probably and the end of Wave F of the inside move and we can expect price to form Wave G as the last leg of this pattern. We can expect another rally from this coin at the end of this move.
ETCUSDT trade ideas

$ETC: Ethereum Classic Daily Targets/Pullback (Long-scalp) #NFA(Scalp-Long targets w/ pullback, SL & TP For ETC based on a Daily (algo) Trendline bounce.
Expected pullback target possible.
Always look both ways when crossing the street.
#NFA

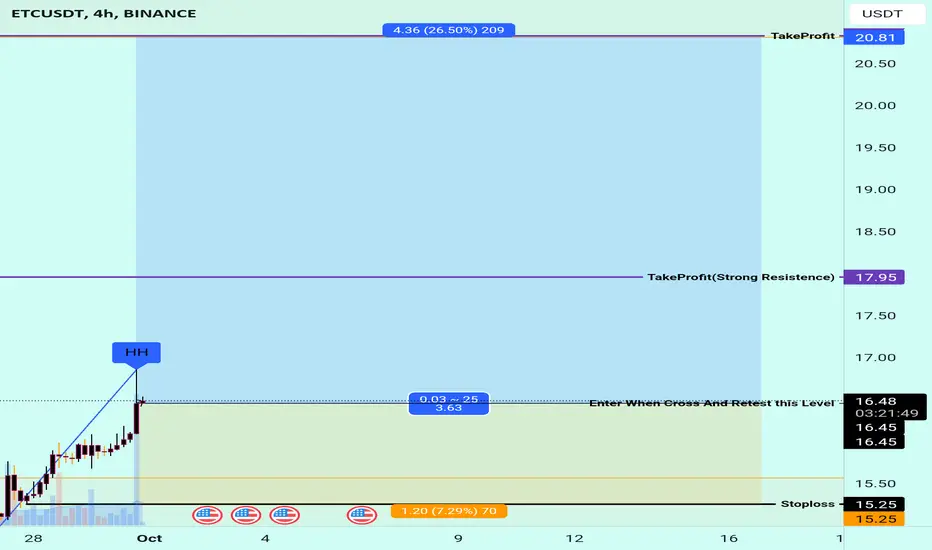
ETC triple bottom breakout Triple bottom form since August 2023 .
finally we can see a breakout above $17 & also 200MAs.
breakout is still valid as long as price stay above $16.50.
MACD bullish bias.
next resistance at $21
DYODD.

Short-term support range : 16.71-17.20Hello?
Hello traders!
If you "Follow" us, you can always get new information quickly.
Please also click “Boost”.
Have a good day.
-------------------------------------
(ETCUSDT chart)
The key is whether the price can be maintained by receiving support around 11.338-16.07 and rising above 19.45.
(1D chart)
We need to see if it can receive support around 16.71-17.20 and rise above 18.80.
If it falls below 15.27, caution is needed as there is a possibility of a new low.
--------------------------------------------------
- The big picture
The full-fledged upward trend is expected to begin when the price rises above 29K.
This is the section expected to be touched in the next bull market, 81K-95K.
-------------------------------------------------- -------------------------------------------
** All explanations are for reference only and do not guarantee profit or loss in investment.
** Trading volume is displayed as a candle body based on 10EMA.
How to display (in order from darkest to darkest)
More than 3 times the trading volume of 10EMA > 2.5 times > 2.0 times > 1.25 times > Trading volume below 10EMA
** Even if you know other people’s know-how, it takes a considerable amount of time to make it your own.
** This chart was created using my know-how.
---------------------------------

🚨 Trade Alert: ETC/USDT (3-5x)🚨 New Trade Alert 🚨
✅ ETC/USDT (3-5x)
📉 LONG Entry Zone: 16.2 - 17.326
⛔️ SL: 15.715
🔒 Breakeven Move: When it moves close to TP2
🎯 Take Profit:
Short Term: 17.5 - 17.8 - 18.1 - 18.4 - 18.8
Mid Term: 19.3 - 19.9 - 20.8 - 22 - 23
📝 Ensure you set entry orders to balance the trade's entry and aim to secure 30% of profits within the first two targets. Once profits are gained, adjust the stop orders to match the entry points or break-even levels.
⚠️ Disclaimer: Historical earnings cannot assure future outcomes. Is there a potential for risk? Certainly. The entire financial market is susceptible to uncertainties; any underlying factor or abrupt shift in market sentiment could overturn the current market trends and lead to losses. Refrain from undertaking undue risks that might jeopardize your financial stability. You are under no obligation to engage in this trade; kindly avoid the trade if you disagree with the trade analysis.
GIS TRADING®

ETC ETC as most coins look Bullish right now
I think that we can expect the coin at 22.49$ soon where I would pay extra attention on how the coin will react.
If it manages to consolidate above that price, and stay above it, in this case it can go higher towards to 40.58$, where we can expect to see strong bearish reaction (n.2)
Otherwise, if the coin rejects from 22.49$ in this case next important level for Bull continuation will be 19.35$ (n.1)
Bullish sceanario invalidates if the coin is not managing to stay above 19.35$ in this case it may go lower or will continue its consolidation above 12.55$ price level

ETCUSDTCouldnt really find a satisfying entry.. but from the structure of the market, im bullish on ETC


ETC Crypto ETH CLASSIC Sell TP = 15.61On the H1 chart the trend started on October 24 (linear regression channel).
There is a high probability of profit taking. Possible take profit level is 15.61
But we should not forget about SL = 17.26
Using a trailing stop is also a good idea!
Please leave your feedback, your opinion. I am very interested in it. Thank you!
Good luck!
Regards, WeBelieveInTrading

ETCUSDT.PMarket has a good opportunity for long position
BE CLEVER AND CHOOSE YOUR SIDE THEN TRADE THE ADVICE .
If u want to have more our private idea text us.
Long position
🔻 Buy ETC
📌Entry: 15.29
🚫 SL: 15.09
🚫 TP: 15.90

ETC grow After Liquidity Sweeps 📈💡Ethereum Classic (ETC) has been quietly making waves, with a remarkable ascent that follows liquidity sweeps of essential support levels. Similar to Solana (SOL), it's primed for what might be another liquidity sweep around critical levels, potentially sparking a new phase of growth. This phenomenon underscores the pivotal role of liquidity in driving price movements. 📈💡
Liquidity Sweeps: Powering Price Action
Liquidity sweeps are market dynamics in action. They involve brief, intentional price surges that clear out buy or sell orders clustered around specific price levels. These sweeps often precede significant price surges, highlighting the profound influence of liquidity as the driving force behind price action. 🚀💰
What Lies Ahead: The Next Move
For ETC, the anticipation of another liquidity sweep, possibly around a pivotal level, could be a game-changer. This event may set the stage for another upswing as orders are cleared out. However, the cryptocurrency market is inherently dynamic and occasionally unpredictable. Staying vigilant and adjusting your trading strategy is essential. 📊🔍
Trading Strategy:
Exercise Patience and Caution: If you're considering a position, it's wise to wait for the liquidity sweep event to materialize and look for corresponding price action confirmation.
Implement Risk Management: Mitigate risk using essential tools like stop-loss orders, which help protect your investments.
Stay Informed Fundamentally: Keep yourself well-informed about Ethereum Classic's fundamentals and any news that could impact its price.
Conclusion:
In the cryptocurrency realm, liquidity plays a paramount role in shaping price movements. Liquidity sweeps, much like with SOL, can be pivotal moments in catalyzing growth. Yet, it's crucial to remember that they are not infallible.
As a crypto trader or investor, it's essential to exercise caution, stay informed, and adapt your strategy to the ever-evolving market conditions. While liquidity provides the fuel, it's your strategy that guides the ship.
❗️Get my 3 crypto trading indicators for FREE! Link below🔑

ETC and strong support levelThe instrument has formed a descending structure that lowers the price maxima along the trend line with the help of limit sellers. The preload goes to a cascade of support levels formed by several touches, behind which the stops of the participants' shorts have accumulated, opening their positions from them.

ETC Week longclose above test, hold and pump
Neque porro quisquam est qui dolorem ipsum quia dolor sit amet, consectetur, adipisci velit

ETC/USDT 12.10.2023 Review ChartHello everyone, I invite you to review the ETC chart in pair with USDT, on a one-day time frame. First, we will use yellow lines to mark the triangle in which the price is approaching the exit and the direction of movement.
Going further, we can move on to marking support areas when we start a larger correction. And here you can see a strong support zone in which the price is currently close to the lower border of the zone ranging from $19.64 to $12.60, but when we break out of it, using the trend based fib extension grid we can determine a second smaller zone from 9 $.61 to $7.48.
Looking the other way, we see that the price has a significant resistance zone from $25.18 to $29.09, only when it overcomes it will it move towards the resistance level of $33 and then $38.62.
Please look at the CHOP index, which indicates that there is still energy in this movement, the STOCH indicator shows exhausted energy, which is also confirmed by the chart, while the RSI indicator shows a strong rebound, but with room for the price to go slightly lower.

Ethereum Classic shortEthereum Classic broke trough the support level. Asset broke trough the ascending trendline. Bearish movement to support level at 13.5 is possible.

ETCUSD ❕ support zoneETC tests 200EMA as support (4H TF)
The chart has reached the support area.
I believe that the asset will rebound after holding above the support area.

ETC/USDT 4HInterval ReviewHello everyone, let's take a look at the ETC to USDT chart on a 4-hour time frame. As you can see, the price is moving above the local uptrend line.
After unfolding the Trend Based Fib Extension grid, we see that the first support is at $15.44, and then we have a support zone from $15.19 to $14.98.
Looking the other way, we will check the resistances in the same way and the first resistance is at $15.65, then the second resistance at $15.96, the third at $16.20, and then there is a resistance zone from $16.44 to $16, $79.
Looking at the CHOP indicator, we see that there is a lot of energy to be used, while the STOCH indicator approached the upper limit, which resulted in a change in the price direction with room for further decline.

No One Is Noticing This Massive Price Reversal Setup Of ETCHi friends hope you are well and welcome to the new update on Ethereum Classic (ETC).
Before starting the analysis of ETC, I would like to share with you my most recent trade signal for Ethereum Classic, which I shared on 21st Sep 2023. That was a harmonic bullish reversal BAT move, which ETC formed on a 4-hour time frame, and recently it has begun a successful bullish reversal form the potential reversal zone of this move.
Formation of huge wedge:
On a weekly time frame, since May 2021 to March 2022 Ethereum Classic was moving in a very falling while wedge pattern and finally in the second week of March 2023, it broke out this big wedge, but got stuck inside in another falling wedge pattern, which was bigger than the previous one.
Broke several wedges and the formation of channel:
While moving inside the bigger falling wedge pattern, the priceline of ETC has been breaking out different other patterns as wel. In the below chart, it can be clearly seen that in the month of July 2022 it broke out another falling wedge and then formed another falling wedge and broke it out in the month of January 2023. Now it has formed a down channel and moving within the bigger falling wedge pattettern.
Targets:
As the down channel is considered a bullish biased move, therefore, there is a very high probability that the priceline may break out this recent down channel rather than breaking down the support. Now if we take a look at the targets, then the target for the channel’s breakout will be approximately 25 dollars, which is the top of the channel, and if the price and reaches there then it can also breakout the bigger falling well, and the target for the bigger falling is $75. And there is a big move still due, which is the target of the falling wedge breakout which was happened in the month of Mar, 2033, and this target is between $180 to $200.
Conclusion:
On a weekly time frame chart, ETC is continuously forming bullish biased patters, therefore, there is a very high probability that the priceline may soon break out the bigger falling wedge pattern for a very massive and long term rally.
Note: Above idea is for educational purpose only. It is advised to diversify and strictly follow the stop loss, and don't get stuck with trade.

Trading Opportunity: ETC/USDT😱 Ethereum Classic is a blockchain platform that provides decentralized smart contracts. It emerged as a result of a contentious hard fork from Ethereum (ETH) in 2016. ETC aims to preserve the principles of blockchain immutability and decentralization.
🟢Green Entry Zone: 14.72 - 16.60
🚀 Targets:
Target 1: 17.99
Target 2: 19.50
Target 3: 21.35
Target 4: 23.25
🔴 Stop Loss: 11.22
📢 Trade Alert: Ethereum Classic (ETC) has caught our attention! With its unique blockchain philosophy, ETC offers a compelling trading opportunity.
🔍 Before you proceed, remember to exercise caution and conduct thorough research. Cryptocurrency markets can be highly volatile, so managing risk is crucial.
Good luck with your trading!
Your Kateryna💙💛

ETC 1w is bullish but... We have two scenarios for ETC, but the great news here that we have huge gains in the future!
Your SL will be closing below the light blue area and this is the best SL I can see.
Keep in mind that the goals will exceed 250%
If the markets suddenly changes to be negative, then expect the price to reach the light blue area.
Otherwise, it will hold the current demand Zone.
All the best insha Allah!

ETC Buy Trade Blueprint: Seizing the Moment for Maximum Gains**ETC Coin**
**Short Fundamental Analysis**
ETC Coin is a cryptocurrency that was created in 2016 as a result of a hard fork of the Ethereum blockchain. ETC is designed to be a more stable and predictable platform than Ethereum, and it does not include the changes that were implemented in Ethereum's Metropolis and Constantinople upgrades.
ETC Coin has a number of advantages over other cryptocurrencies. First, it is based on a proven blockchain platform. Second, it has a strong community of developers and users. Third, it is becoming increasingly accepted by merchants and businesses.
**Recent News**
On September 29, 2023, ETC Labs announced that it had partnered with Microsoft to develop a new enterprise-grade ETC blockchain platform. This partnership will help to make ETC Coin more accessible to businesses and organizations.
On September 28, 2023, ETC Coin was listed on Coinbase Pro, one of the world's largest cryptocurrency exchanges. This listing will help to increase the liquidity of ETC Coin and make it more accessible to investors.
**Disclaimer**
Cryptocurrencies are volatile assets and prices can fluctuate wildly. It is important to do your own research before investing in any cryptocurrency.
However, I am not a financial advisor and I cannot provide financial advice. The information I have provided about ETC Coin is for informational purposes only and should not be construed as financial advice.
ETC has a bullish signal!
🎗#ETC/USDT 🎗
LONG
Leverage: (10.0X)
Entry Targets:
1) 16.44
2) 16.30
Take Profit Targets:
1) 17.05
2) 17.46
3) 17.72
4) 18.09
5) 18.50
6) 18.98
7) 19.41
8) 19.81
Stop Targets:
1) 13.16
🟡Chart is speaking it self!
_ _ _ _ _ _ _ _ _ _ _ _ _ _ _ _ _ _ _ _ _ _ _ _ _ _ _ _ _ _ _ _ _
Thank you for seeing idea .
Have a nice day and Good luck
🔴This is only an idea and not a financial advise ( NFA )🔴

Sooner or later in 2024 or 2025Ethereum classic looks attractive for whales 🐋, why ?
Look at the price 15.80$ at 2.3B market cap
The future Ethereum classic can raise to 40$ before the bull market, after bull market starts, the price can go to 80B market cap, it's mean 500$ , the average for next bull run for the market cap can reach between 40B to 80B , it's mean 250$ to 500$.
Fact!
Let's take an example
One million whales start trading in bitcoin with the capital of 1million dollars
This mean the market cap of bitcoin will raise 1000B dollars , it's mean 2x , around 55000$
If 10% of the whales start trading in ethereum classic, it will add 100B , means 5.3x , around 750$ for 1ETC
