ETC/USDT 4H Chart - -ShortHello, traders! I present you with an interesting short trade opportunity for the asset. Through a detailed technical analysis, I have identified a series of bearish signals that suggest a potential downward movement in the short term.
ETCUSDT trade ideas

Ethereum Classic longEthereum Classic bounced off the lower boundary of descending channel. Bullish movement to resistance level at 18.05 is possible.

ETC S&R>>>>>>>>>>>Hello EveryOne
I Have Tried My Best to Bring the best Possible outcome in this Chart.
Everything is cleared on the chart.
In case of more market support,ETC can test higher colored marked resistance on the chart.
In shrt time frame ETC made head&shoulder pattern's.
It's just an analyze,
Not a financial advise.
PLZ DYOR
With hopping success>>>

etcusdt now in bad conditioni see 15% profit if etc give us a short position. i think we will see result in a few hours.

ETCUSD ❕ downward channelETC is moving in a downward channel under liquidity.
Price has fixed under 200EMA on the 1H TF.
I believe that the price will continue to decline.

ETCUSDTRisk warning, disclaimer: the above is a personal market judgment based on published information and historical chart data on Tradingview, all analysis is only subjective. Hope investors consider, that I am not responsible for your investment decision.
Thank you.
Good luck

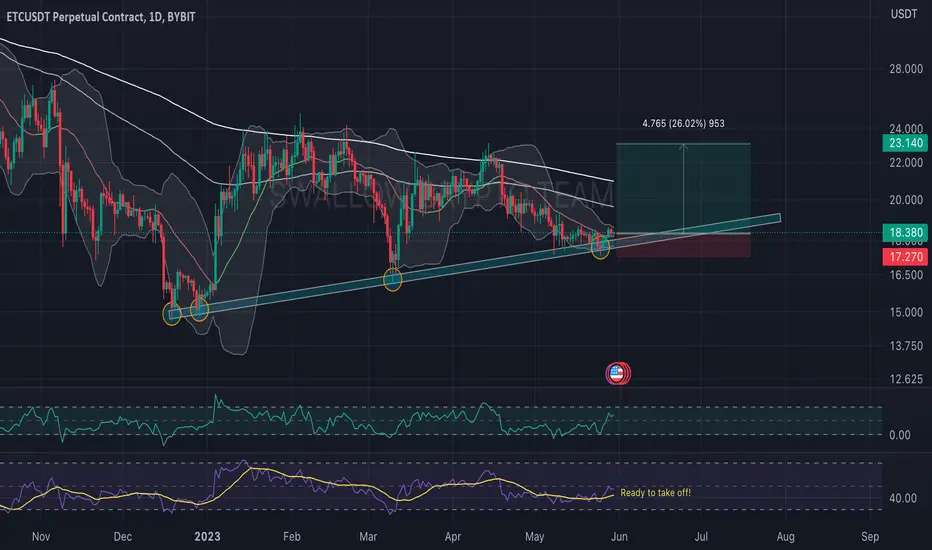
ETC/USDT Perfect Entry? Hey guys 👋
ETC/USDT pair is next that caught our attention here with a nice potential for a long. We see a nice 3touch trend here where the last one seems to be getting ready for a takeoff here. We are looking into bullish movement here, what do you think about that one - Seems nice potential for a growth here
If you like ideas provided by our team you can show us your support by liking and commenting.
Yours Sincerely,
Swallow Team
Disclamer:
We are not financial advisors. The content that we share on this website are for educational purposes and are our own personal opinions.
ETCUSDT: A Strong Pullback or the Start of a Wild Ride?💎 #ETCUSDT has been hugging the lower edge of the Bollinger Band for nearly two months. However, a recent change in the wind has #EthereumClassic bouncing back from the lower band, supported by the 227.2% Fibonacci level. The price has started to climb, and just yesterday, we saw a confirmed break and closure above the resistance downtrend trendline.
💎 This indicates an increase in buying pressure, and control is gradually shifting to the bulls. At the moment, BME:ETC is trading within a broad range, and we could potentially witness a rise towards the upper Bollinger Band.
💎 If the recent low at $17.35 holds firm, #ETC could see a price increase of over 20% with the next move. While this isn't a long-term uptrend, it's more of a strong pullback.
💎 But hold onto your hats, because if the price breaks above the Bollinger Band, we could be in for a wild ride. Stay tuned, Paradisers!

ETCUSDT LONG 26/5/2023Blue Trendline draw by Connecting low of 19.12.2022 with 10.03.2023
This trendline gives support for current price.
Entry: 17.46 (Trendline) / 17.35-17.28 (Previous wick +- a bit, this entry need Luck ya, aim here just expect a wick come down then give strong rejection) *Choose 1 limit.
SL: 2-3% below 17.46
TP: 18.415

🔥 ETC Starting Bull-Market Play: Crazy Potential!ETC has been bouncing off the lower support of the triangle for neatly a year now. The assumption behind this trade is that the support will hold yet again and that ETC will break through the top resistance at some point in the future.
Entry at 18.9 because we have to get above the current trading range first. Waiting for this entry will increase the probability of the bottom being in and the trade to play out positively.
Target of 50 is a longer-term play, but with a very high risk-reward ratio.
A safer play would be to take partial profits around 23 or the top resistance of the triangle.

ETC ANALYSIS (1D)Hi, dear traders. how are you ? Today we have a viewpoint to BUY/LONG the ICP symbol.
For risk management, please don't forget stop loss and capital management
When we reach the first target, save some profit and then change the stop to entry
Comment if you have any questions
Thank You

ETC USDT PERP Hello Trader 👋, today we are looking to BINANCE:ETCUSDT.P
direction : long
entry 16.511
stoploss 15.814
leverage : cross 25X
take profits
17.508
18.125
18.624
19.122
19.832
20.736
Please add a comment and Positive feedback and
constructive criticism are important to authors and the
community.
Disclamer: Not Financial Advice

ETC/USDT according to plan! Hey guys 👋
We back at ETC where we are awaiting for our scenario to happen. We see still a good chance for a drop so let's wait and watch closely. Any thoughts guys?
If you like ideas provided by our team you can show us your support by liking and commenting.
Yours Sincerely,
Swallow Team
Disclamer:
We are not financial advisors. The content that we share on this website are for educational purposes and are our own personal opinions.

ETCUSDT : FOR PLANCTON0618 WITH LOVE : Here's your long entry!In response to a comment on a previous post by @plancton0618 , I've been following ETC, hoping to add a little happy to at least one person's day.
Well, the time has come. It's maybe less obvious on the 15min chart, but what you're looking at is the very bottom of the previous bearish trend and the completion of a double bottom on the 1Day timescale. Remember, chart patterns are fractal, so conforming to this rule, it has to complete the same reversal pattern, ie. the Double-Bottom, on all timescales. It created the first leg a few days ago and is currently at the business end of completing the second leg (clearly visible on the 1D chart), after which it will be free to return to the glorious days of its all-time-high (ATH), at ~$180.00.
Buying at current levels in spot will see your investment reach a realistic profit of around 9x.
This would be the "investor" option and much less exciting than what I'd prefer to do.
Because of the reliable reversal pattern, it is, in my opinion, the ideal time to open a leveraged position, as it's about as safe as one can expect to get trading crypto.
Doing so has additional benefits that spot trading cannot match, even a 1:1 leveraged position (equal to spot, ie. NO RISK OF LIQUIDATION), you will have the opportunity later to modify the leverage and use position profit or margin freed by each higher multiple you choose to adjust your leverage to, to re-invest and scale your position incrementally as the price moves away from the entry level and in the desired direction, reducing your risk profile as it advances. This has profound implications if done correctly, since this is a perpetual position, you are contractually entitled to hold onto (keep it open) or sell (close) the position at your leisure. Sure, this sounds unimportant and you might wonder why I'm mentioning it.
Here's why. Buying crypto in the spot market is not only limiting in terms of the profit always being at 1:1, but additionally, you will never have the option to use your profit to "buy more" of the same coin, because selling it will leave you no different in terms of the number of units/coins purchased when it was cheap. Sure, you will have made a profit, but only relative to the original Dollar value, not relevant to the purchased instrument, meaning that you would have to wait for whatever coin you purchased (ETC in this case), to drop before you can realize your gains by then buying more at a lower price. But wait, there's more..
Trading crypto in spot means that you can only affect a direct profit in the upwards/bullish direction, since you cannot short in that market. Trading futures, even at 1:1 allows you the same Zero-Risk guarantee of safety, but with 100% more opportunity for trade. This really begs the question, why do people still trade spot? Ignorance, would be my best guess. Most people prefer to "think" on other things, or talk about some newly hyped project, in stead of really Thinking for themselves. I'd have preferred a very different opinion on the matter, but in the end, it's not up to me, is it?
If I were wrong, I'd have expected to hear about or see someone mention this strategy somewhere at least once in the past 7/8 years, but I haven't. Not that I really read articles or frequent chat groups anymore. Nonetheless.
I got into this wanting to prove or disprove the existence of a universal theory or formula that would hold true and be reliably applicable to any coin.
The idea being that if such a pattern existed and could be identified, it would, in theory, be the Holy Grail of trading. The "Secret". The thing we all wish for when we're kids, and wish for even more as disappointed adults.
I very much doubt anyone is reading this, and honestly, I don't care either way.. I got a warning from TV that I'm not being descriptive enough in my posts, so, feeling either inspired or spiteful, I'm unburdening myself of some thoughts.
What I mean to say, is, that my quest has concluded, and unexpectedly, I believe that I have discovered that secret pattern. In fact, I have and am able to prove it without much effort.
It's present in many of my posts. And it's the most beautifully elegant picture of simplicity I've ever seen. Hiding in plain sight. Undeniable once you see it.
If market/price movement were indeed "Random", an easily identifiable, reliable, frequently repeating, consistently rule-abiding pattern would not exist. I hoped that it did, but to be fair, it was a tall ask. Nobody has been able to prove anything resembling, even remotely, such a pattern. I took a different approach and it yielded results.
All one would need are three consistent markers. Identify the first and the second can be predicted. Confirm the second and the third is very nearly assured.
I don't claim to be able to anticipate every chart ALL the time, but once you know what to look for and you realize how it sticks to the rules, you're able to trade with confidence.
Note the impressive level of precision for the 3 dots in the following charts. They hit the same targets with almost perfect precision.
There are many additional implications of what I've learned that offer a compelling alternative to conventional market theory and because I've based my method on factual evidence, it cannot be dismissed when it opposes baseless claims that have been absorbed into what is today considered as Technical Analysis. When I look at the Ideas page on TV, what I see is a cluttered, epilepsy-inducing mess for the most part. Contrast that with what you're about to see and consider the self-explanatory clarity in my charts.
* More on the methodology later, to the first serious party that reaches out with intent.
Bullish:
* On the 1Day timescale:
Bearish:
TheMethod Unique Features:
• Most importantly, it's predictive, not retrospective.
• Higher degree of accuracy than any previous techniques, tools, strategies or methods
• Is supported by a logic-based framework of rules that form a clear Methodology
• Developed using a simple Question : Answer research structure, focusing on "Why"
• Identifies both entry and exit levels for Ranging and Trending targets
• Uses only the Fib Retracement tool
• Applicable on all timescales
• Applicable to all coins
• Uses no indicators
• Uses only one reversal pattern : Double Top/Bottom
• Accuracy enables confident trading at high margins
• User friendly at any experience level
Disproves and debunks conventional market theory promoted ideas including:
• Volume
• News and events
• Market manipulation
• Whales
• Bitcoin dominance
• Market cap
• Whitepapers
• Elliot Theory
• Head-and-shoulders
• Impact of world events
With a little practice and some usage instructions (which I will write down as soon as I stop procrastinating), I'm confident anyone, at any skill level will be able to successfully apply to achieve profitable trades. I'm not a very patient person, so I'm prone to dabbling in the minute charts, trying to do what nobody has successfully done before, so, admittedly, I appear to be wrong pretty often. Thankfully, I know that most of you are more patient and will be able to quit fidgeting with it and give it time.
If you're still reading this, and interested in what I'm blabbing on about, do get in touch.
My efforts have seen me become somewhat of a recluse and the absence / disinterest in social media and networking has not helped in terms of reaching the right people in order to move the project forward. Building a social following in order to build credibility so that I can Then be in a position to share something that has the potential to benefit everyone indefinitely, On-Top-Of having put everything into bootstrapping the research & discovery stage on my own steam, seems like too much to ask for.. I can't think of a valid reason other than recognition and credit, and I'm not motivated by either.
I would, however, like to officialize my theories by having them tested properly by independent researchers and also to collect what's in my head into an easily digestible publication.
Just finding myself in a bit of a lull currently, so I'm open to chatting with qualified potential partners to make this happen.
For obvious reasons, I've decided to not yet publish the methodology in its entirety. I worked my cute little bottom off doing this and would like to be appropriately compensated, which I don't think is too much to reasonably expect.
I'd be happy to impart what I've learned and offer time-based exclusivity to the right candidate.
To someone with access to a decent trading balance and some room to take big swings, I can promise this, there's no limitation or ceiling to how much you will be able to grow your wealth.
Have been wondering where or how to look for said partner and didn't intend for it to be this post..
Guess it's as good a place as any.

ETCUSD ❕ downward channelETC continues to move in a descending channel.
The RSI chart is in the sellers area (4H, 1H and 30m TFs)
I think the asset will continue to decline.

#ETCUSDT #LQR #TOBTC #LaqiraProtocol● You could get a maximum of 35% ✌️😉 profit from analysis of May 5
• Support and resistance are specified in the chart
• Levels are obtained from the intersection of the fib and static levels
• You can open a position after confirmation
• This analysis is not an offer to buy or sell

It can consider up to 20.7253.This cryptocurrency is the back-to-back supporter of Ethereum and because it could not confirm its double top in the daily time, it has started to rise and correct the price of the 4hr , which can consider the rise to 20.7253 as the profit limit.

etc analysesethereum classic is in the very important zone in daily and weekly time frame.
you can wait for next candles to see how it makes movements.

What happens after confirmation?
Extrinsic value= $ 22.34
Intrinsic value = $ 95
(To me, this means) If it dips the very next day then I'll buy.
This approach helps keep you one step ahead of market.


ETC/USDT Will we see a breakdown? Hey guys 👋
Well ETC/USDT pair is next on our watchlist where we see a nice formation her with a small pullbacks from trends. We are looking for a breakdown here which should happen on this week. Now all we need is a confirmation so let's wait for it!
If you like ideas provided by our team you can show us your support by liking and commenting.
Yours Sincerely,
Swallow Team
Disclamer:
We are not financial advisors. The content that we share on this website are for educational purposes and are our own personal opinions.

ETCUSDT is testing the supportETCUSDT had a rejection from the daily resistance level around the 22 $ area, which is significant because it has acted as a key level of resistance in the past.
Currently, the market is testing the support level around the 19 $ area, which is also an important level for traders. If the market is able to hold this support level, it may provide a bullish opportunity for traders to enter a long position. However, if the support level fails to hold, and the price of ETCUSDT retests it as new resistance, this would trigger a short selling opportunity according to Plancton's rules.
Short selling is a trading strategy used by traders to profit from a decline in the price of an asset. In this case, if the price of ETCUSDT loses the support level and retests it as new resistance, it would signal a potential reversal in the market. This could provide an opportunity for short-term traders to enter a short position and profit from a potential decline in the price of ETCUSDT.
In summary, ETCUSDT is currently testing an important support level, and traders should closely monitor the price action to identify potential trading opportunities. If the support level fails to hold, and the price of ETCUSDT retests it as new resistance, it could provide an opportunity for short-term traders to enter a short position according to Plancton's rules.

Analysis of ETC Time 1D currency# Analysis of ETC Time 1D currency Ethereum Classic has a decent support at the $17 level, which is increasing in this area, suitable for spot buying and long-term holding. If the trigger is observed, the price is $31 and $38 Friends who have a hold must keep an eye on it.
