ETCUSDT LONG SETUPETC is showing us weakness, I think it is giving falling signals. I expect it to return at least to the support line. But this is my setup for a temporary long.
ETCUSDT trade ideas


ETCUSD ❕ descending channelETC trades under liquidity.
The chart is moving under a range.
The asset will continue to decline.

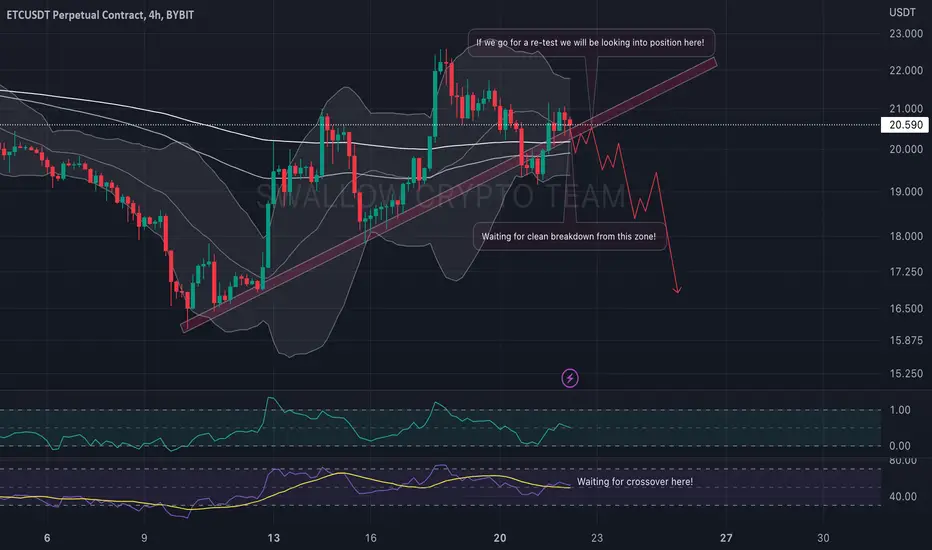
ETC/USDT Possible Breakdown?Hey, guys ✌️
ETC coin seems interesting here while sitting just above trend and trying to hold it. We see a good chance for a breakdown as price has not settled yet (this we can tell by BB indicator where the wide gap has been formed on chart). Waiting for breakdown on this one, after that a potential re-test of the trend!
If you like ideas provided by our team you can show us your support by liking and commenting.
Yours Sincerely,
Swallow Team 🔱
Disclamer:
We are not financial advisors. The content that we share on this website are for educational purposes and are our own personal opinions.
ETCETC technical analysis:
Friends, the harmonic bullish pattern is marked with targets. This analysis is valid until I give a correction analysis of Bitcoin.
The main point is that the targets have been identified in this analysis and now it is not optimal for buying.
Good luck
Karim Heydari

ETC New Target Will Be $36 Per-Share/Formed Ascending TriangleHey everyone, today i'm going analysis ETC/USDT pair, on the daily time frame let's begin...
1)On daily time frame we can see Ascending Triangle formation is going on,so price is squeezed into Ascending Triangle after we finally breakout from Triangle, so there is higher chance we will breakout to the upside, because Ascending Triangle is bullish pattern.
2)We can see we have Diagonal DowntrendLine at $20.5 per-share, so wen we breakout from this DowntredLine at $25.5 and ETC will gets some momentum and next Resistance will be from Ascending Traingle at $24 per-share,if price can breakout from $24 price zone, ETC target will be $36 per-share, that's the main target on this analysis.
3)We have strong Diagonal Support zone and price reacted 3 times already, so after three touch was made on Diagonal Support zone price will must move fast enough,so we can clearly see price was moved fast enough to the upward trend,after 3 touch on Diagonal Support, so price ETC getting more straight, its mean we going to do HIGHER - HIGH and HIGHER - LOW.
4)We are using also EMA RIBBON indicator on this analysis, If price is above EMA RIBBON, its mean good signal for we can moving into upward trend for coming weeks.
5)RSI indicator perfectly was boncued from oversold zone at 30, RSI is breakout from Downtrend Line , so RSI getting more strong, it's also good sign for price gets some momentum and RSI will move to the upward.

Etcusdt Price will Rise again ?While the price is above the support, expect the price to rise above 23$ mark
❤️ If you find this helpful and want more FREE forecasts in Trading View
Be sure to leave a comment; let us know how you see this opportunity and forecast.
❤️ Your support is very much 🙏 appreciated!❤️

ETC ETC looks bullish after the breakout you enter to get some profits
its 1D frame so takes some time
peace:)

✴️ Ethereum Classic Update | Long-Term GrowthSomething is happening here with the Ethereum Classic chart that reveals a bright future.
Notice that back in July 2022 ETCUSDT only lasted a few days above EMA100 consolidating before moving forward.
This forward move was then followed by a strong correction which ended in a higher low.
This time around things are much difference.
Ethereum Classic consolidated above EMA100 but failed to move ahead, it went on to produce a correction yet still, within short-term and long-term higher lows.
This is a revealing fact.
We might be looking at the last time that Ethereum Classic will be available at these low prices in its existence.
For example, $12.5 USD as in June 2022 is already forever gone.
The longer a pair consolidates, the stronger the breakout.
The next time ETCUSDT moves up and peaks, instead of a strong correction to produce a higher low we can end with a long sideways consolidation phase before the next bullish jump.
Or the consolidation can have a downward slope as in a falling wedge pattern but still remaining multiple levels higher compared to now and then growth.
And this cycle repeats over and over for years to come.
Namaste.

RLinda ! ETCUSD->Attempting to break through years of resistanceETC Etehreum classic breaks through the strongest resistance line, which has been holding back the price for several years. If this attempt is successful, then in the medium term, the coin can make the growth of 60%, 120% and 160%. What's next?
ETCUSD stopped its fall in the support area at 12.0-16.0 and the price gained some energy and potential to grow, which might burst out soon.
The key resistance zone is 22.00-23.00, if the price remains above this area, it will open the way to 36.00, 48.00 and in the long term it might reach 54.00 .
Sincerely R.Linda!

Etherium classic is Bullish !This coin will pump because it is on upward trend and it takes out all the liquidity that iis needed for a market movement

I mean ALL INETC on the verge of a major breakout and volume is coming in. No brainer if this breaks.

ETC USDTETC USDT possible move idea
confluence of AST + Harmonic + SMC
sell/short on BRD and buy/long on the D leg if bullish harmonic completed.
details on chart

EthereumClasic Weekly View - March 2023Hello Guys, Weekly Analysis is on the ETCUSDT Symbol in a 1H Time frame, I Hope it Will be Useful for You, Don't Forget to Like, Follow, Comment

🚨 ETC: WHAT??The coin approached the key resistances. To continue the upward movements, it is necessary to break through the range of $21-21.4 with the candle body fixing above this level.
Supports are marked with orange lines. From them I take a long with the risk of the deposit no more than 0.5%.

ETC/USDT We Good Until We Below 200EMAHey, guys ✌️
ETC coin is next on our watchlist here! Currently trading in-between 200 and 100EMA we see how price is pushing to break that 100EMA. Waiting here to see that nice breakdown from this zone which could result the price to move towards $17.455 (Blue box)
If you like ideas provided by our team you can show us your support by liking and commenting.
Yours Sincerely,
Swallow Team 🔱
Disclamer:
We are not financial advisors. The content that we share on this website are for educational purposes and are our own personal opinions.

✴️ Ethereum Classic Next Target Mapped Series ($32 to $42 Next) This is another one of the top Altcoins that I've been tracking/reading for you since November 2022.
We also did great with Ethereum Classic back in June/July before I stopped writing. This one generated great profits and it was my first DEX trade.
The next and easy target is set at $32 but it can go higher, much higher.
The downtrend for ETCUSDT ended December last year.
This is followed by a bullish breakout #1.
The breakout is followed by a correction, which is normal, and this correction ends in a higher low #2.
#3 Is the next leg-UP!
$32 Is just too easy and so we are going with the 2.618 Fib. extension for this one and that's $42 as the next target.
This is mid-term.
✔️ Mid-term for us means within 1-3 months.
✔️ Short-term within 30 days.
✔️ Long-term can be 3-6 months or everything 6+.
After our target is hit we will get another correction.
Remember that it can go much higher or a bit lower than what we see on this chart.
The next major correction should end in another higher low and then a long period of consolidation, we will have to wait and see.
But the low was set last year, the rest is long-term growth.
Higher highs and higher lows.
Thank you for reading me.
Thanks a lot for your continued support.
Oh wait! The invalidation point is December's low.
If prices go below this level this chart analysis becomes invalid and a new one is needed.
All trading above this level and the bullish potential remains intact.
Patience is key.
Namaste.

✅TS ❕ ETCUSD: broke down the support✅✅ ETC is moving in a downtrend.
The range has been broken.
The price will continue to decline. ✅
🚀 SELL scenario: short to 15.24. 🚀
----------------------------------------------------------------------------
Remember, there is no place for luck in trading - only strategy!
Thanks for the likes and comments

what you think aboutt ETC ? Guys what's your ideas about ETC is still Bearish OR its the time for new trend ?

short trem EtcIn the chart, we can see that the price after growth with the momentum that has reacted to the resistance range and is very tight and in the form of Cp is undergoing a downward correction. Currently, the price has reached the support range of $18, and the liquidity before this range has also been collected, and if you see a trigger at this level, you can enter the buy buy position. If this level is lost, the $16 support area becomes an important support for pricing and is very suitable for taking a buy position. Be sure to keep an eye on it

ETC: The Harmonic Pattern Can Be Tested AgainETC: The Harmonic Pattern Can Be Tested Again
During the previous analysis price completed our harmonic pattern
and with the crypto market recovery, we saw also a strong bounce from ETC.
I really like ETC taking in consideration how it usually reacts.
So let's see how it will develop also this time.
You may find more details in the video!
Thank you and Good Luck!

🚀 ETC: Big movements!The level of $19.26 has been worked out. Congratulations on your profit.
The level of $20.16-20.40 is an important resistance. By the way, notice how earlier this level worked as a strong support.
Orange lines are our support levels.
See what the resistance levels are based on. These are shelves by volumes + fibo levels.

ETC/USDT seems readyHey, guys ✌️
Let's kick off this day with ETC/USDT pair here. There are 3 major "Whys" why we see this outcome: Market price is far away from EMAs, Double Bottom, Currently at strong support. Waiting here for last confirmation which will be breaking that neckline zone!
If you like ideas provided by our team you can show us your support by liking and commenting.
Yours Sincerely,
Swallow Team 🔱
Disclamer:
We are not financial advisors. The content that we share on this website are for educational purposes and are our own personal opinions.
