ETC Inverse head and shoulders to target 138$ ETC looks incredibly bullish here, with supports respected and painting a bullish pattern.
Now we are looking at a push towards the neckline and once activated, this should maybe re-test the neckline (time to buy there tight sl) and then go for the target moonshot 138$.
If it flies higher, we are looking at potential bull run to 300$+ in price discovery.
If it rejects there, maybe top.
ETCUSDT trade ideas

ETC shortHi traders.
My idea about ETC
sell position
target :
1) 19.36
2)19
3) 18.86
Always follow risk and capital management.
Good luck


Critical moment for ETCIt reached support level 19.4-19.5$. it is good it didt close 4h below the line.
Once it drops and closes 4 h candle below 19.4 $ then 2nd line will be the support line.
When we consider the huge drop on volume and RSI cross, it seems the price has more potential to drop than to rise. (Not Financial Advise )
What do you think ?

ETHEREUM CLASSIC, a long term vision. ETCUSDT . UpdateHello guys, This is an update of previous analysis (blow link), we made our buy positions at the two points which we wanted and the trend has moved as we expected. For now you can manage your capital and profit until reaching the chosen target.
Good luck
If you like the idea, do not forget to support with a like and follow me for next analysis :)
Write your comment and opinion below for me

$ETC #ETC | LTF SHORTThe lower bound of red box most probably will work as resistance so i looking at bearish breakers around $18.98 . If the price loses red box, the price may dump more than we expect.
Have a nice week!

ETCUSDT SHORT Hello guys , how are you I think you have a great weekend
Today I came with a shorting opportunity on ETCUSDT read and enjoy your weekend.
RSI divergence in a major level of structure
It is also in the over bought region
MACD divergence is also confirmed
we can enter after the double top of the second high i. e
on the higher high.
the market is moving strongly up
due to the news on yesterday "non-farm payroll."

✴️ Ethereum Classic Leads The Altcoins, July 2022 Repeat, 195% PThe last time Ethereum Classic moved above EMA50 was back in July 2022 and this lead to more than 155% growth.
We have the same situation now which we have been expecting and this time around we can have similar results.
We are trading within a higher low which tells us of a potential higher high.
The main target is set at 134% but if we get a higher high we are looking at a potential 195%+ from the current price.
If we get such huge growth... This might confirm bitcoin's low.
The bottom might be already in for bitcoin and this would mean that what we are seeing develop now is not only a relief rally but the start of the next bull market... Stay tuned for more.
Namaste.

ETCUSDT.P LONG Hi, guys.
The Ethereum Classic is on a very good upward trajectory, so you can control the weight of the money and aim for a long RBI.

ETCUSDT Trend reversal!!ETCUSDT (1D Chart) Technical analysis
ETCUSDT (1D Chart) Currently trading at $18.5
Buy level: Above $18
Stop loss: Below $13
TP1: $21
TP2: $26
TP3: $31
TP4: $45
Max Leverage 2x
Always keep Stop loss
Follow Our Tradingview Account for More Technical Analysis Updates, | Like, Share and Comment Your thoughts

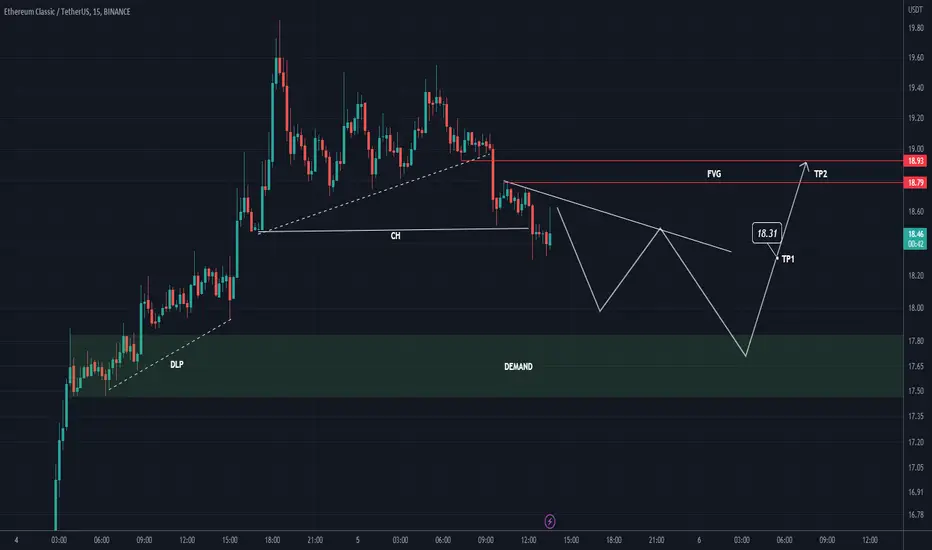
ETC PURSED MOVEMENT, WHY?If price must get to the upper band, price must breakout out at the %30($18.528) or %50($18.758) retracement from the resent ATH, else it may need to retest $17,886 .

ETC Buy Setuphi, I hope you are well. Today is another day to make profit from the market
I think it can move up when it hits the green area. Capital management, volume, leverage and stop setting should not be forgotten
Comment if you have any questions
thank you
ETC Retraced by %30, could price be rejected at this level?Showing on the chat an Order Block formed on 15M TF at the %30 retracement, could this be a rejection sigh? Maybe price will come back to retest the OB, and if broken then we may get to the %50 retracement ($17.314) but if rejected then you may see price moving towards the upper band. What is your opinion on this? Kindly leave a comment
Thanks

ETC make a reverse at 19.186LTC formed an uptrend line at $15,082 region where a new impulsive move was taken to $19.186 region, Where a short opportunity was spotted. At this point price is trying to move further but I think there is a need for price to Retrace by %50 currently at %30 region($18.176) , if there is a rejection at $17.886 it means a long opportunity which may breakout at $19.186 to further the up movement, but if there is no rejection at $17.886 I think we can continue with the short down to $15,082

ETHEREUM CLASSIC, Massive Breakout With Further Pump Ahead!Hello Community,
Welcome to this analysis of mine about the Cryptocurrency Market. As the new year 2022 has emerged there are important coins within the market which show up with interesting developments especially as the volatile movements increase therefore it is reasonable to watch for picked altcoins within the market that are likely to unfold further potential and determine important patterns to move on with. In this case, as I analyzed the cryptocurrency market I found Ethereum Classic with recently completed a paramount formation on high volatile movements in the market and breaking out above the upper boundary of the broadening wedge formation as it is marked in my chart. This is a very strong movement by Ethereum Classic which is suggesting further movements to wait around the corner. Besides the completion of this major formation, you can also watch how Ethereum Classic is developing this confirmational triangle formation above the upper boundaries and is now about to setup further waves in this direction especially once the triangle formation has been completed with a breakout above the upper boundary as seen in my chart. Once Ethereum Classic has shown up with these developments the targets in my chart will be activated and Ethereum has a solid high likelihood possibility to reach out to these target zones in the upcoming times. It will be an interesting journey ahead.
In this manner, thank you everybody for watching. Let's move forward together.
The information provided is only educational and should not be used to take action in the markets.

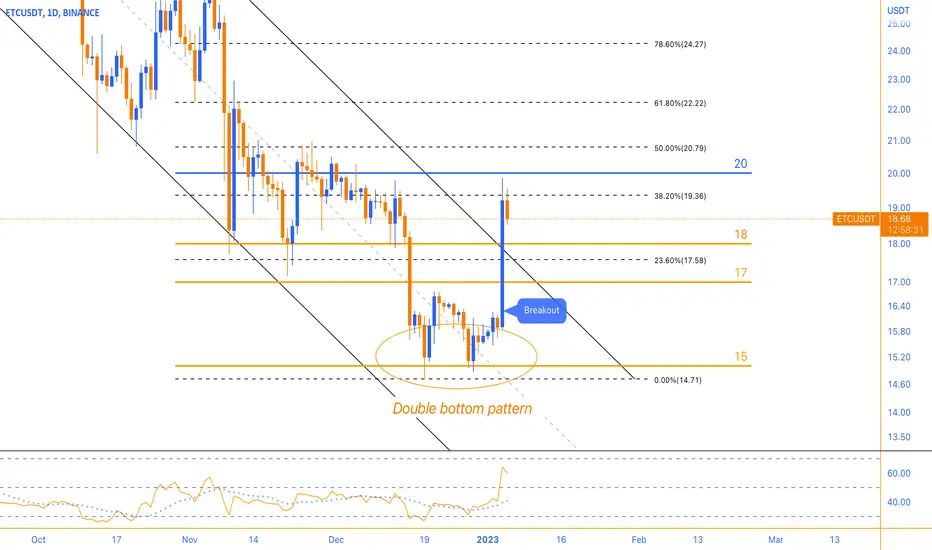
Double bottom patternETC has gained more than 20% in price in the past day. Ethereum Classic, which had formed a double-bottom pattern above the $15 support area, confirmed the pattern with support from buyers after breaking through the $17 area resistance and continued to rally near $20. With this buying pressure, the price has left the medium-term downward channel, and if the price enters the corrective wave, we can expect a pullback to the ceiling of the broken channel in the range of $17. However, note that a strong upward trend in the 4-hour timeframe can have a shallow correction. Therefore, the first support level is considered to be in the $18 range, and if we see signs of support, we will expect the price to grow.
ETCUSDT BATBat
The Bat Pattern is a 5-point retracement structure that was discovered by Scott Carney in 2001. It has specific Fibonacci measurements for each point within its structure and it is important to note that D is not a point, but rather a zone in which price is likely to reverse, called the Potential Reversal Zone (PRZ). The B point retracement of the primary XA leg must be less than a 0.618, preferably a 0.50 or 0.382 and the PRZ consists of 3 converging harmonic levels: 1) 0.886 retracement of the primary XA leg, 2) extended AB=CD pattern, usually 1.27 AB=CD and 3) minimum BC projection is 1.618.
The first target would be the 382 retracement of AD and the second target the 618 retracement of AD. A common stop level would be behind the X-point. Conservative traders may look for additional confirmation. Bat Patterns can be bearish and bullish. TradingView has a smart XABCD Pattern drawing tool that allows users to visually identify 5-point reversal structures on a chart.
Likes and comments if you have questions! 🍌
Thanks!

Aggressive Stuff 🔥If you want to check the aggression level of this crypto you can back test OR just look 4th Jan candle it's 20+ % up , crazy things like this happens only in cryptos, people who had traded yesterday with flow of trend they are joying in Heaven right now 😇

✴️ Ethereum Classic Moves Past EMA50Ethereum Classic (ETCUSDT) managed to move above EMA50 to the upside.
This is the first time this happens since July 2022.
Now, can it stay above EMA50?
We have the long-term higher low and basically the exact same conditions as we did last year.
The prognostications look good.
We can't say if it will or will not stay above this level.
The technicals are bullish and we can expect additional growth but here is how really things work...
If ETCUSDT moves back below EMA50, the mid-term bullish bias is lost.
Staying above this level and the bulls remain in control.
We got the breakout... It is for the market to decide how things will turn.
We should see growth for 1-2 months... Hopefully!
Namaste.

ETC/USDT Main trend. Triangle (pennant). Psychology. Pamp.The coin is the "parent" of the expensive ethereum.
Coin in the coenmarket : Ethereum Classic
Major trend. Which has formed a large upward channel. Timeframe 1 week. Huge pump (fractal repeat of 2017 May). Pullback. Which formed a triangle (potential upward pennant canvas) in case of a breakout of resistance and the price going up to the upper limits of the channel. Zones of levels to work showed on the chart.
Hamsters and "experts" recommend to buy now and even before the decision of the local trading situation on the triangle. After all, the price is now about +1500% of the average accumulation price, and from the bottom of the channel more than +2000%. This is the best time to buy "Hold" and it is very important, if the triangle will be broken through and the price will grow to the resistance of the outer channel, then in no case do not sell, otherwise the main postulate of hamsters and expert bloggers will be broken:
[BUY IN THE MAXIMUM, AND SELL MUST ON THE LOW IN THE POCKET!!! .
There are two potential position reset zones. The price is in just one of them right now. But that does not mean that there will not be waves. For example, on DOGE the position is reset with a partial payoff (pours when holding zones), but the price is growing and significantly. But this is relevant for traders (real, not imaginary), people who are good at risk management and know how to work on the situation, and not the situation leads their emotional decisions and unpreparedness if the price goes against their expectations.
My previous work on this coin.
Posted when the price was in accumulation before this pumping. Working in and out of a horizontal channel. Not a public trading idea. Published 09 26 2020.
ETC/USD Local work. Potential entry points
Press play on the chart, press the left button and pull the chart up, you will see the exact level of the first reset of the hamsters position 43,221.
The price at the pumpe is pushed much higher (no sellers, all liquidity and sales are absorbed at the lower values, usually near the accumulation resistance zone up to +100% of it), so weak market participants are not afraid to buy "cheap" when they see the previous price. The more expensive the price, the more willingly the weak (stupid, lazy) market participants buy the asset for the long term.
Most people are afraid to buy cheap and without a team. Everything cheap to them is scam, but if scam goes up in price, it is whitened in the eyes of stupid market participants. It becomes no longer a scam. There is already a cult of believers in the next crypto phantom of promise. They foam at the mouth to defend their stupidity. Admitting their mistakes confirms the former stupidity of man. Not everyone is capable of this.
A foolish person does not see what was in the past, but only what he has fantasized about. Consequently, he only sees the potential very expensive price, but doesn't see what the price was in the accumulation just 1-2 months ago before pumping. Buying +1500%-2000% is common for the likes of him. It's useless to prove it.
The programmed man of the crowd thinks only by its opinion, single conscious thoughts with a difference from the main mass will be crushed in a moment by "experience and expert opinion of the majority".
The man does not trust himself, he trusts the majority. The crowd always loses. The rare win is nothing more than a planned tactical move to direct the game background of the characters to shape the reality of the players in their game.
Play with dignity, think for yourself. Don't be background characters and "stock players" in someone else's game. Even your erroneous self-made decision is true, at least at the time it is made for you, even if it ultimately turns out to be not quite right. Of your many truths right and wrong is not an easy path to truth.
Publication 10 01 2021 Non-Public Work.
ETC/USD Mid-Term Work
+3100% from accumulation lows/maxims. Over +1000% profit in areas of acceptable liquidity.
Local work. This triangle on a large scale .
ETC/USDT Secondary Trend Pivot Area Triangle 327
In order to make money in the market, you need someone to give you money all the time. If no one is giving, no one is making money! The cryptocurrency market is super profitable, so giving money away is a super fantastic percentage.
I've attached my previous work on this trading pair over the past 3 years under the idea.

ETC/USDT Secondary trend. Channel. Accumulation and distributionSecondary trend. Timeframe 3 days. Which formed a downward reset channel with a significant 108% move after a huge +2000% to 3000% pump. This is what happens when a coin is "forgotten about by all," not advertised in the news, and accumulated for such a long 2.2 years.
The real ether. The “green” parent of the expensive “black” ethereum.
Coinmarket Coin: Ethereum Classic
At the moment the price is approaching the uptrend of the main trend (long-term). Dynamic support (green) of the large channel.
The medium-term reversal zones of the secondary trend are shown on the chart and circled in yellow, on which (breakthrough / not breakthrough) depends on the further development of the trend.
The graph shows the accumulation and distribution zones. Zones of smart and stupid.
Position resets.
"Waves of interest" with price retention is expensive
1—distribution zone. Formation of a 6.5-month triangle). -61% from the reversal level of the triangle breakout.
2—zone after the triangle breakout. Formation of the descending channel.
The whole drop is 10.8 months (327 days).
The price is now at the “Hamster Pump” peak zone (buying back liquidity “expensive” from those who didn't want to sell cheap) $17.22 - $20 before a huge pumping +2244% of the average set price.
Accumulation in the horizontal channel, 2.2 years.
The channel is 100% $3.78 to $7.35. Average liquidity set price of $6.
Maxima—$13.18 (redemption of coin volume “expensive” for subsequent failure under market dump).
Minimums—$3.1 (market dump 13 03 2020).
Expensive and cheap ether. Mining.
Ethereum is moving to version 2.0. There will be a transition from proof-of-work to proof-of-ownership, and mining on video cards will cease to be profitable. This will happen in the second half of 2022, perhaps even this summer.
This very unpopular and painful decision (inevitable) has been dragging on for 3 years now. It is very likely that this year will be the end of this problem. It's not hard to guess which cryptocurrency the miners who mine ETH now will most likely switch to. Consequently, it can very positively influence ETC price.
For those who don't know, let me remind you. ETC is the true ether. ETH is a fork. Forced fork, to get back stolen ETCs during attack on DAO (just to roll back transactions of “hackers” wallets).
That's how 2 Ethers came into existence. ETC (limited quantity of coins) and ETH (unlimited quantity of coins). Of course, they began to promote and develop centralized fork, that is ETH.
The whole story about birth of ETH with ETC and the story (real imitation) with hackers attack on DAO and stealing of ETC coins was made just for “birth” of more centralized crypto-mint for testing technology, especially smart contracts on it.
Under the idea fixed my previous trading ideas for this coin, including closed (pre-pump recruitment zone).

YongTung | ETC: Over 1000% Incredible Pump Starting Right Now!Hello traders, today I want to talk to you about ETCUSDT.
I made a few conclusions about Ethereum Classic.
At the moment ETC price trades near to support zone $14.32-$12.81 levels.
I expect that price can make small correction to support area and then bounce up and start to rise.
Then, I think price can break resistance line and go higher.
I set up my first target locate at the local high and resistance level $49.28 (fibonacci 0.5 level).
Also, I think price can break resistance level and continue move up until resistance zone.
Therefore I set up second target at $129.50 and $117.90 levels.
And I set up my final target at fibonacci 0.886 and ATH level $160.75
This is my opinion, I really hope it will be useful for you.
This is an article not financial advice, always do your own research.
And please don't forget to support this idea with your like and comment, It means a lot to me, thanks.
Be prepared and save your money. Make big profits!
Happy trading!

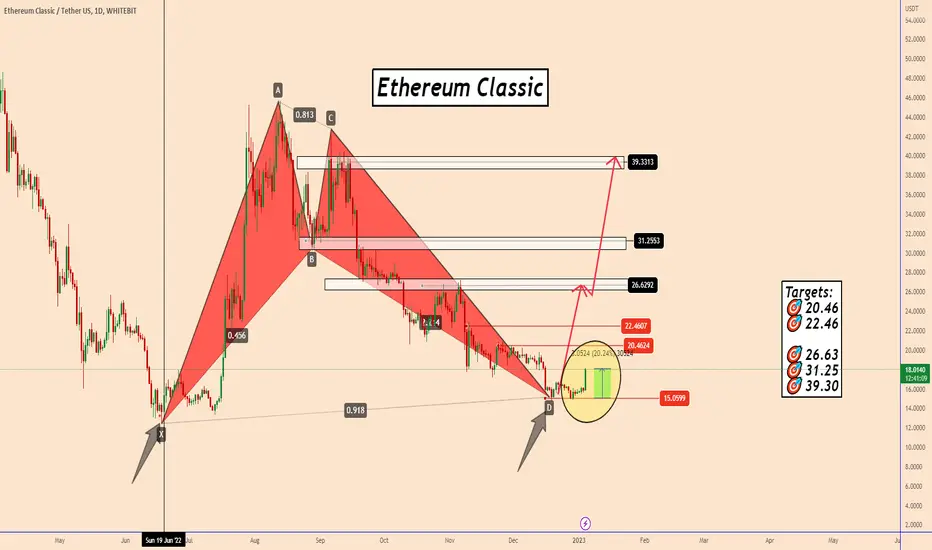
ETC(Ethereum Classic): +20% In One Week...What's Next?ETC(Ethereum Classic): +20% In One Week...What's Next?
This is an analysis that I shared one week ago.
The first bullish move was perfect + 20% profits so far.
So if you are happy you can close these profits also here:)
However, the price completed this beautiful harmonic bullish pattern
and it can be a good signal that the bullish wave should be ready soon.
PS: If all will be well regarding the fundamental outlook of the crypto market the price should rise again from this point.
Targets:
🎯 20.46
🎯 22.46
🎯 26.63
🎯 31.25
🎯 39.30
Thank you and Good Luck!
Previous Analysis: