ETC/USDT looks interesting! Hey guys
Another coin is going to be ETC. Well it followed ETH with this drop where afterwards tried to go back up for breakout but failed the attempt. We see here more of a bullish pattern and candle movement overall so let's see what will happen. This is just an idea and we will enter this trade only once we get a confirmation of a movement!
If you like ideas provided by our team you can show us your support by liking and commenting.
Yours Sincerely,
Swallow Team 🔱
Disclamer:
We are not financial advisors. The content that we share on this website are for educational purposes and are our own personal opinions.
ETCUSDT trade ideas

ETCUSDT Bear FlagETC | Bear Flag? I think it will go down to 25.
Right now all depends on Fed Rates. If rates will be 3.25% then blood bath for every coin. ETC can go down to 15-18. Depends on Fed Rates and FOMC Press Conference .
Use your money carefully and don't be greedy. Its just my opinion, not a financial advice.
Thank you and Good Luck!

Ethereum Classic (ETC) 1DAY UPDATE BY CRYPTOSANDERS !!Hello dear traders, we here new so we ask you to support our ideas with your LIKE and COMMENT, also be free to ask any question in the comments, and we will try to answer for all, thank you, guys.
Ethereum Classic (ETC):-one of the most notable movers on Monday, as the token fell by over 12% to start the week.
Following a high of $33.41 during the weekend, ETC/USD slipped to an intraday low of $27.91 earlier today.
The drop comes less than a week after Ethereum classic was trading above $40.00, ahead of last Wednesday’s Merge.
Monday’s drop sees ETC move to its lowest point since July 27, when the token was trading near $24.00.
As of writing, earlier price declines have eased, with ETC now back above the $30.00 mark.
After a brief breakout, the 14-day relative strength index (RSI) is also tracking marginally above support of its own at 40.95.
Sorry for my English it is not my native language.
Hit the like button if you like it and share your charts in the comments section.
Thank you

interesting setup here! 👀ETC doing temporary break below consolidation zone mentioned in previous post, but seems like potential short trap
watching for break of 30.99 for some more upside 🟢break below 27.38 for downside continuation🔴
drop boost and follow for more! 💛

ETCUSDT Long SignalOne of the most searched coin right now and is a killer gem which is ready to explode in the upcomming days, the ETCUSDT is about to take a LONG.
My Setup for this is:
$23.8 - $31.5
One Time Entry: $28
Short Term: 31 , 32.5 , 36 , 38, 42
Mid Term: 48, 52, 61, 69
Long Term: 75, 81, 86, 95
: 20.75
Please be aware with your money!

ETCUSDT BATBat
The Bat Pattern is a 5-point retracement structure that was discovered by Scott Carney in 2001. It has specific Fibonacci measurements for each point within its structure and it is important to note that D is not a point, but rather a zone in which price is likely to reverse, called the Potential Reversal Zone (PRZ). The B point retracement of the primary XA leg must be less than a 0.618, preferably a 0.50 or 0.382 and the PRZ consists of 3 converging harmonic levels: 1) 0.886 retracement of the primary XA leg, 2) extended AB=CD pattern, usually 1.27 AB=CD and 3) minimum BC projection is 1.618.
The first target would be the 382 retracement of AD and the second target the 618 retracement of AD. A common stop level would be behind the X-point. Conservative traders may look for additional confirmation. Bat Patterns can be bearish and bullish. TradingView has a smart XABCD Pattern drawing tool that allows users to visually identify 5-point reversal structures on a chart.

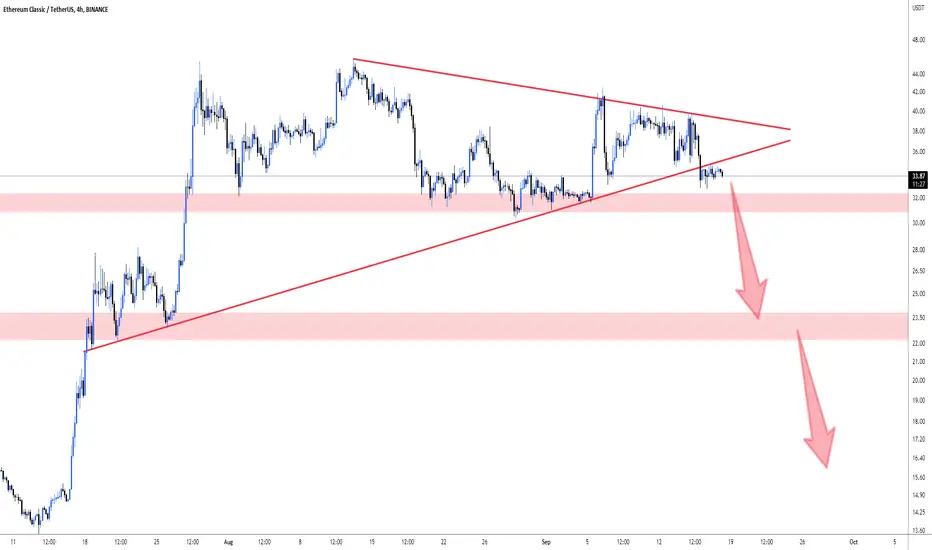
ETCthe price has broken the lower boundary of the symmetrical triangle. If there is no strong upward bounce, then this is a strong bearish signal indicating a trend reversal. Support levels and strong MAs are indicated

🔥 ETC Falling: Bounce From ResistanceOver the last couple of weeks, ETC has been trading alongside a strong resistance. After several failed attempts, the ETC is falling again, boosted by negative sentiment in the market.
In my view, we can see much more bearish price action in ETC. I'm looking at the blue dotted line for a potential entry. Once we close below that line ($30.4 or so) we will likely see more selling occur, so be patient.
Targets in blue placed at recent areas of support.

ETC/USDTETC/USDT
Fill the roof of the descending channel again.
In my opinion, how long can the long-term ascending channel and the $20 area fall.
#ETCUSDT #ETC #BTCUSDT #BTC #ETHUSDT #DOGE #DOGEUSDT

✅TS ❕ ETCUSD: continues to fall✅✅ETC rebounded strongly from the resistance level. The price formed a triple top and went down. now there is movement in the support area. I expect the trend to continue.✅
🚀 SELL scenario: short is below the minimum.🚀
----------------------------------------------------------------------------
Remember, there is no place for luck in trading - only strategy!
Thanks for the likes and comments.

Bullish Pennant on ETC Chart looks very nice. ETC is showing strength throughout the bearish momentum of Bitcoin.
I believe we will se a bounce beginning this week.

ETCUSDT | Well, miners, are they mining?Hello trader Today I prepared a new idea for you. Like and subscribe to the channel there is a lot of useful information✅
Friends from the last signal, we never came to test the countertrend one.
While you can see that the asset is starting to consolidate in the range of $33-35, I think from this zone you can try to gain a long position for a small percentage of the deposit (3-5%)
ETH is still gaining momentum but it could be a trap, I wrote about it in another post! So be careful and work with risk management!

EtcUSDT Can go again ?etc looks trying fix its value about 40 this week
we have a problem with volume but let see

Prepare for a drop- Resistance around 51.1 - 52.36
- Support at 27.14 and further at 23.55
Wait for BOS (break of structure) or DROPPPP

ETC ready for longterm FLY!ETC is ready to fly. ETC broke out of a long-term bearish channel and hit a nice pullback. No matter what happens to the bloody cryptocurrency market in September, but considering the end of the Ethereum mine, this chart is a spectacular chart!

If Ethereum classic start Bull run, first target could be 45🙂Personal idea: based on the recent movements of Ethereum classic, possibly second run of Elliot waves will start and in this case, with this pull back, first target could be around 45 and second could be around 52-55. Importantly we need price around 30-33 as support. Good 🙂 luck.

ETC | Bullish Flag? Will The Price Rise More?ETC | Bullish Flag? Will The Price Rise More?
As we all know when the news about the ETH merge and the
upgrade from POW to POS we saw that ETC made a very nice bounce.
All was related with the fact that the miners would have moved from ETH to ETC
or other coins and ETC had higher chances for mining.
However, the market is still expecting and the situation is not clear yet with ETH Fork etc
and now ETC is still waiting.
The price is developing a very big bullish flag pattern.
For some time I am expecting the price to move between 30.5 and 45.40
The price can develop in this area for a long period of time.
Once the price jumps above 45.5 it means that something good happened
and the price should continue to grow more.
Thank you and Good Luck!

ETCThe price fell to the lower border of the symmetrical triangle, but bounced up to the daily 100 MA. The bullish scenario will again send the price to the upper border of the pattern. The bearish scenario will lower the price to the area of strong support at $25-26

ETCHELLO GUYS THIS MY IDEA 💡ABOUT ETC is nice to see strong volume area....
Where is lot of contract accumulated..
I thing that the buyers from this area will be defend this long position..
and when the price come back to this area, strong buyers will be push up the market again..
UPTREND + Support from the past + Strong volume area is my mainly reason for this long trade..
IF you like my work please like share and follow thanks
TURTLE TRADER 🐢

Ethereum Classic (ETC) !W scenerioScenerio 1
Short if next wee candle ends in red forming a continuous bearish trend pattern
Scenerio 2
Long if next week candle end in green, breaking the bearish trend line. Wait to bullish reversal candle stick pattern

$ETC - Number Go Up 🚀🚀Short and medium term PTs for $ETC; Using fibs and traditional TA.
Catalyst: $ETC hashrate to the moon.

ETC in tight consolidation!👀holding near recent highs while many other tickers are dumping! this is a good sign for any longs here. Once bull markets back it probably goes parabolic.
watching for longs above 46.04 🟢
shorts below 29.54 🔴
