etcusdt ethereumclasic 30min "🌟 Welcome to Golden Candle! 🌟
We're a team of 📈 passionate traders 📉 who love sharing our 🔍 technical analysis insights 🔎 with the TradingView community. 🌎
Our goal is to provide 💡 valuable perspectives 💡 on market trends and patterns, but 🚫 please note that our analyses are not intended as buy or sell recommendations. 🚫
Instead, they reflect our own 💭 personal attitudes and thoughts. 💭
Follow along and 📚 learn 📚 from our analyses! 📊💡"
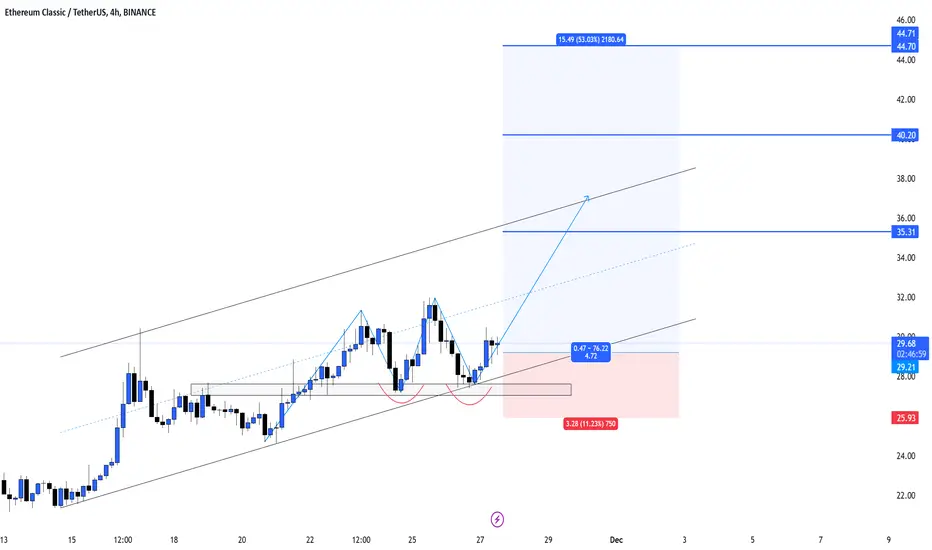
It is possible to start an uptrend in both boxes
ETCUSDT trade ideas

Ethereum Classic Ultra Long-Term Accumulation Phase ContinuesThe longer the accumulation phase, the stronger the bull-market that follows...
Good evening my fellow trader, you are great for reading this now and I would like to thank you.
This is a chart, a pair, a project, that we visit often. It happens with some of the pairs. Some we just tend to gravitate towards them and continue to publish updates. Ethereum Classic looks great long-term.
The accumulation phase continues. This past week closed green sealing five consecutive weeks green, but the action remains within a long-term range which is the consolidation or accumulation zone. This zone has been active now for a long-time, let's say since November 2021. 1,099 days.
Pre-2021 bull-market something similar happened. The accumulation phase lasted 900-1000 days. From the market bottom in December 2018 to the market top in May 2021 total growth amounted to 5,725%. This time around the accumulation phase has been going for longer and market conditions are much better compared to the past, which means we have huge potential for growth.
Just an update to mention that we continue bullish on ETCUSDT. New ATH potential goes between $291 and $390, with a standard bull-market. With a current price of $36 this would amount to 11X and 8X. If we consider the market bottom after the ATH, just to extract the full potential of a bullish phase ending in those prices, we would have total growth of 3150% and 2316%. Not bad. If we get a super bull-market growth potential can go even further, but we are more than happy with 20-30X. In fact, even 10X or 5X is amazing so... The future is bright for us.
Thank you for joining.
Namaste.

EtcThis is a sneaky little guy. However this is a large pattern that has been consolidating for a while.
Although i usually like my patterns much much tighter, if we chart Ethereum the setup pattern is exactly the same with the pattern size and breakout area.
It has been straight up from the lower end of the pattern however according to trend resistance this is a break at 37.30$
It seems to be sitting on top of the trend line breakout using as support. It is a trickier setup as it would suck to but the top of the pattern only to fall back in. My thought is to add here around 37.50. Also to have a buy order at 34.50 for a pull back in just in case this initial breakout trade is wrong for now.
Trade is to bring This back up to around 65-75.00$ to sell half of the position and see how we respond after that
Entry is between here 37.50 down to 33-34$ as potential reload if it does give that I’m still not sure it will but it will follow ethereum.

etherium classic etc usdt daily analyses
time frame daily
risk rewards ratio >1.5
although today we heard a lot about alt season but
my analyse is base on price action and support and resistance
etc moves up and down in parallel lines and my target is top of that.
we have 2 resistance boxes ( red boxes in the chart ) ,if ETC can break those boxes , it can pump to 39 $

Ethereum Classic ($ETC) will show a classic H&S patternEthereum Classic is one of the few old assets that has yet to fire. It will follow the same scenario as XRP, LINK, XLM and others. I love the Head and Shoulders pattern that the market maker often plays on old assets. The simplest reason why Ethereum Classic is being pumped is its age. The global market maker has been accumulating old assets for a large number of years and it's time to reveal the cards. I expect a price hike to the area of 170-180$ and further correction.
Best regards, Horban Brothers.

Eyes on #ETC/USDT sell-side liquidity and 4H FVG & 4H IFVG.Eyes on #ETC/USDT sell-side liquidity and 4H FVG & 4H IFVG.
This will be the long area. The local resistance level is PDH $38.96, and the local support level is PWH $34.04.

ETC/USDT$ETC/USDT
Looking at the chart, Ethereum Classic #ETC/USDT has shown a strong breakout above a significant resistance level, aligning with the previously formed cup-and-handle pattern. Here's a quick analysis:
Resistance Break: The breakout confirms a bullish continuation, targeting higher levels in the upcoming months.
Target Levels:
T1: $56.72
T2: $71.57
T3: $93.7
With a potential 200% profit target, ETC is positioned for significant gains if the current trend sustains. Monitor for pullbacks near the breakout zone for re-entry opportunities.

ETC The price is moving perfectly!#ETC/USDT
🚀 BME:ETC The price is moving perfectly!
The initial targets have been successfully achieved, and with the continued positive momentum, further upward movement is expected toward higher targets.
Successful breakout above the $35.31 range.
The price remains within a rising channel.
T2: $44.71
T3: Further upside potential could bring the price to even higher levels if momentum continues.
Strong Support Zones:


Ethereum Classic Pre-2025 Bull-Market Accumulation Zone & Strat.Hello my beloved trader and soon to be millionaire, the Cryptocurrency market is preparing to shower us with massive wealth.
The true and only way to make money trading Cryptocurrency is by having a well developed plan; by building a strategy before we decide to take action, before buying.
👉 My strategy is super simple: Buy and hold.
One of the main mistakes traders and aspiring traders make which forbids them to extract large sums of money from the market, is to believe that they have to buy and sell, buy and sell, "trade," in order to make money.
All those that have experience and have gone through their first run in this and other markets can tell you this: They would have made so much more money by simply holding rather than buying and selling. When we have no experience, the buy and selling ends up resulting in major losses rather than winnings.
When the bull-market is over, we see that all pairs grew by 10X, 20X and even up to 30X. Then we see our own capital and while it is green, because everything was going up, it only grew by 2-3X. This is because of the countless mistakes we tend to make.
Excitement, greed, inexperience and lack of planning are the main causes of lost opportunity.
This time it will be different because you are reading this.
👉 You are going to focus, you are going to write it down, you are going to plan and you are going to win. This I know, or else you wouldn't be reading this.
➖ Ethereum Classic has the potential to grow beyond $444 in 2025.
➖ Now, let's say that this prediction is way off for whatever reason, and the market grows only to a maximum high price of $110. Even if this turns out to be the case, my strategy would produce massive gains.
👉 Here is my strategy: Buy everything below $20 thinking of the long-term.
Again, buy and hold.
That's it, pretty simple.
No leverage, no margin, no risk.
Buy and hold. That's the sure way to win.
Thank you for reading.
I hope you can trade long-term and win.
Namaste.
__
Ethereum Classic | ETCUSDT (Current price $18.26)

Want this one go more ETC time!İ bought this bag like year ago its so slow processing i dont want to sell it before x2 my gains.İ thought after halving this could be pump its not happened.İf btc not drop so fast we could reach 40-45$ for sure before end of this year.Techinical point we breakout and as u see we pump hard.Maybe we could be slow down some time and make something double bottle in short therm and reach +40 is good realistic number.

Ethereum BUT the ClassicBME:ETC
Ethereum Classic has reached its important resistance
I imagine some price drop for it
Areas are marked by Fibonacci

If ETH goes up then ETC should followPossible small retracement before the next push up, also MACD crossing over to the downside.

Will ETC break out from the upper resistance?Hello everyone, let's look at the current ETC situation considering the one-day interval. In this situation, we can see how the price moved dynamically out of the local downtrend line, giving rise to a large upward move.
Currently, we can see the price approaching a strong resistance point at $34.50, the next resistance should be at the level of recent increases at $39.65, only when the price goes up, it will move towards $54.
Now let's move on to the stop-loss in case the price wants to turn back, and here there is support at the level of $28.40, then the price may quickly return to the level of $24, and only further we may have a strong drop to the support level of $19.
Looking at the RSI indicator, you can see that each rebound of the indicator gives new energy for a quick upward movement, which is worth keeping in mind until the BTC price starts making larger movements, increasing its dominance over the market.

ETCWill follow the market if it closed above 31-32$ daily candle so it can officially break over the bearish momentum that has been persisting since 2022.
Not sure if it can go back to it's ATH , but ETCBTC is also moving well and potentially can lead to ignition.
ETC made a huge return with ETH in Q1 last cycle , so this can be potentially a no-brainer play.
DYOR and GL

#ETC 1W: Stable Asset with Growth Ahead. 11/28/24This is a long-term, consistently stable asset. Its price is influenced by Ethereum’s (ETH) dynamics, often following ETH’s price movements.
For over 1,000 days, the asset has traded within a sideways range, suggesting liquidity accumulation and a consolidation phase, where the price remains relatively unchanged. Such phases often precede significant growth.
Currently, resistance is at the upper boundary of the range, which may not be broken on the first attempt, potentially causing a pullback to current levels. In any case, it’s reasonable to begin building a spot position from current levels and consider swing trades with further accumulation on corrections. Targets are shown on the chart.
Personally, I anticipate further growth after breaking through resistance and plan to open a long position on the pullback.
DYOR.

ETC/USDT Analysis:$ETC/USDT Analysis:
#ETC Current price at 29.77 is forming a bullish structure with a potential breakout. Key targets:
T1: 35.31
T2: 40.20
T3: 44.71
Ideal entry near 29.50-30.00, with a stop loss at 25.93. A confirmed move above 30.00 signals further bullish momentum within the ascending channel. 🚀
#ETC Ready For Bullish Surge or Bearish Breakdown? Key Levels Yello, Paradisers! Is #EthereumClassic about to make a major bullish breakout, or will it fall back into seller territory? Let's see the latest analysis of #ETC:
💎#ETCUSDT is showing some positive signs, holding strong near the critical support range of $16.9-$17.8. However, #ETC must maintain momentum and stay above this support zone to confirm a bullish continuation. This positioning could pave the way for a breakout above the internal resistance.
💎For a genuine breakout, BME:ETC has to decisively move beyond the internal resistance at $23.1. Look for robust, engulfing candles and sustained upward momentum as key indicators of strength here. Diving in too early without these signals could lead to unnecessary risk exposure.
💎The risk of losing momentum remains. Should ETC fail to break above $23.1 and show signs of fatigue, sellers may seize control. In this scenario, the $16.9-$17.8 support zone becomes even more crucial, as it has previously withstood significant downward pressure.
💎If this support range holds, the bullish potential remains intact, with a possible bounce sparking renewed buying interest. However, a break below $16.9 could invalidate the bullish setup, potentially leading to a sharp decline toward the next demand level at $14.71. A fall below this secondary support could signal even further downside, marking a critical juncture for #EthereumClassic’s trajectory.
Don’t let FOMO get the best of you; wait for clear confirmations before making your move.
MyCryptoParadise
iFeel the success🌴

#ETCUSDT #1D (Bybit) Descending wedge breakout & retestEthereum Classic regained 50MA support and seems to be heading towards 200MA resistance, probably after a pull-back.
⚡️⚡️ #ETC/USDT ⚡️⚡️
Exchanges: ByBit USDT
Signal Type: Regular (Long)
Leverage: Isolated (3.0X)
Amount: 4.6%
Current Price:
20.620
Entry Targets:
1) 19.256
Take-Profit Targets:
1) 24.837
Stop Targets:
1) 16.459
Published By: @Zblaba
CRYPTOCAP:ETC BYBIT:ETCUSDT.P #1D #EthereumClassic #PoW ethereumclassic.org
Risk/Reward= 1:2.0
Expected Profit= +86.9%
Possible Loss= -43.6%
Estimated Gaintime= 1-2 months

Etc chartEtc chart wanted to do a breakout but got a bit pushed under the green support lines.
To confirm a bull run to 34 - 37 area it needs to hit one of the two points.
ETC ANALYSIS (update)🔮 #ETC Analysis
🌟🚀 As we sail earlier, #ETC performed the soo well & 78% Profit booked. Currently #ETC is trading around its consolidation point. We could expect a breakout and reach towards resistance 1 zone and could expect a potential bullish move📈 Expect a bullish wave of around 20-25% in the coming days
🔖 Current Price: $26.88
⏳ Target Price: $33.83
🏷Remember, the crypto market is dynamic in nature and changes rapidly, so always use stop loss and take proper knowledge before investments.
#ETC #Cryptocurrency #DYOR
