ETCUSDT_1W_Buyhello
The analysis of the ETCUSDT symbol is from the cryptocurrency market in the long term and the analysis is based on Elliott waves
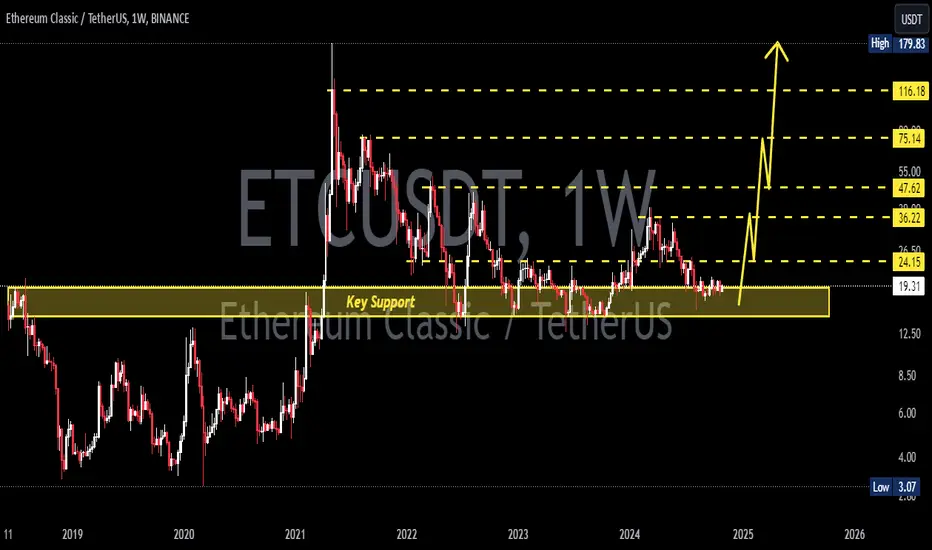
Main support 20.00
The long-term target is 200.00.
ETCUST trade ideas

#ETC/USDT#ETC
The price is moving in an ascending channel on the 12-hour frame and is sticking to it to a large extent
We have a bounce from a major support area in green at 17.70
We have a downtrend on the RSI indicator that was broken upwards, which supports the upward trend
We have a trend to stabilize above the 100 moving average, which supports the upward trend
Entry price 18.40
First target 20.38
Second target 22.33
Third target 24.37

Target-1: $ 50ETC- Trade Plan (No. (1))
Short-term overview
Bias: Bullish
Trade entry: $ 23 -$ 25
Stop level: $ 20
Target-1: $ 50
Target-2: $ 77
Appendix: Oct 29, 2024
Fundamental:

ETC/USDTETC/USDT
shows strong upward momentum after breaking out of the consolidation zone, with the price currently at $22.98. The first target for the upward move is $24.55, followed by $29.71, and with sustained momentum, the price could reach $34.40.

Ethereum Classic Moving Above $450 Means 2000%+ Growth PotentialGood morning ladies and gentlemen, are we there yet?
This is truly the longest accumulation phase ever for Ethereum Classic, the current price at which it trades happens to be within a range that has been active since January 2022, almost three years. The longer the accumulation phase, the stronger the bullish cycle that follows.
Back in 2018 and leading to the 2021 bull-market, the accumulation (consolidation) phase lasted 805 days. The bottom was hit March 2020 and please keep in mind that the bottom doesn't have to hit at the end of the accumulation phase. Present day the accumulation phase has been ongoing for 1,022 days but the bottom hit in June 2022.
Anyway, the 805 days of consolidation produced a bull-market in 2021 with total growth, from bottom to top, of some 5,700%. This time around the consolidation phase has been ongoing for much longer.
On the chart, growth potential shows 1,300% and 2,150%. But if we were to calculate these same targets coming out of the June 2022 bottom, total growth would be around 3,500%. This is huge for a project like Ethereum Classic which is not small. The small projects can grow even more.
This same project can also surprise and do better than anything we expect because we are going to have a friendly market and friendly regulations for Cryptocurrency and this has never happened before. How it will all truly develop, we don't know, but we know it is going to be big, it is going to be beautiful and the market will continue to grow and evolve.
We use adversity to learn and improve in everything that we do.
From our mistakes we learn.
Thanks a lot for your continued support.
Are you ready?
2025 is getting closer, we are already in the accumulation phase.
Buy and hold.
Thank you for reading.
Namaste.

#ETCUSDT#ETCUSDT
BINANCE:ETCUSDT shows Assembly area formation on 2 day timeframe🔍
Current support zone offers excellent entry points for long trade position🤔
Looking for bounce with targets at $24.00, $26.30, $33.00, and $45.00

Ethereum Classic (ETC): Possible Buying Opportunity!!Ethereum Classic has a good possibility of up to 6% of upward movement to happen soon. Keep an eye on a possible MSB and a conformational breakout from BOS and we should be good for a smaller push here!
More in-depth info is in the video—enjoy!
Swallow Team

ETCUSDTETC ~ 1W
#ETC So far it continues to maintain this support block. Buy in stages here. with a target of at least 20%++ from here.
Bullish Surge Ahead? Key Levels ETC Must Hold to Skyrocket!ETC/USDT Analysis
ETC (Ethereum Classic) is in a down trend after making high in March and trading within a descending channel. The price is consolidating between support zone Purple at $16.48 to $17.19 and resistance zone Blue at $20.90 to $21.56.
Bullish Scenario
For a convincing breakout, ETC needs to surpass the resistance zone Blue at $20.90 to $21.56. If it manages to break and hold above this level, it could attract further buying interest.
In this bullish path, the next major resistance zone to watch is at $24.74 to $25.36 in Yellow. Breaking through this could set the stage for a move towards the resistance zone in Pink at $29.72 to $30.46 .
Look for strong bullish candles with increasing volume to confirm a breakout, minimizing the risk of a false move.
Bearish Scenario
If ETC fails to sustain above support zone Purple at $16.48 to $17.19 and shows signs of weakening, sellers may attempt to push the price lower.
A break below the Pink support zone could expose ETC to further downside risks, with the next significant support around $14.48.
A breakdown below $14.48 could accelerate the decline, potentially challenging even lower support levels and indicating a bearish trend continuation.
As long as ETC maintains support above $16.48 - $17.19, the bulls retain a chance to initiate a rally. However, a break below this zone could signal increasing bearish pressure, with significant downside potential if lower supports are tested.
Everything is marked on the chart

Crypto Market on the Bearish TrendHi, we meet again in this post. Isn't it quite accurate what I analyzed in BTC/USDT to take a short? And now the market is bearish and I am also quite interested in this ETC/USDT market because the drop is so fast that I made 3 TP phases within 1 day.
Isn't it clear that the price chart cannot break into bullish conditions? See how the price chart collapses after breaking upwards past the 200 EMA. since then the bearish trend has begun.
For this technical analysis, I am very confident to be able to touch my TP 3 haha.

TAO USDT- MUST WATCH THIS ANALYSISIf price rejects from the resistance, Then we can watch the below support level

Too old Too slow Still believing Etc Buddy'sİn daily, 25 Ma crossing above 50 Ma meaning in short term(bullish).İt rejected from 100Ma sometimes it takes to break at second attemps.24$ is line of resistance short term.İf we could pass $24+$24.40(200Ma).we could reach and fill FVG(area of fair value gap).$27.5-$28.5 targets looks legit and reasonable.

Etcusdt trading opportunityETCUSDT is currently displaying a double bottom formation, which is a classic technical indicator often associated with a reversal of the prevailing downtrend. In conjunction with this pattern, there has been a recent upward breach of a descending trendline, further reinforcing the bullish outlook.
The 'bull area of interest' mentioned refers to a zone that is deemed attractive for accumulation. The rationale behind this is that after breaking out from the trendline, the price often retests it, which in this case is expected to serve as a pullback target where the market may seek to confirm the trendline's role reversal from resistance to support.
The immediate upside objective is identified as the 'potential neckline' of the double bottom pattern. This level is significant because a decisive break above it would confirm the double bottom formation, suggesting a strong possibility of continued bullish momentum. Beyond the neckline, the 'supply level' indicated on the chart represents the next target for profit-taking.
We welcome your thoughts on this analysis and encourage you to acknowledge our efforts by liking this post if you find it insightful.
Thank you for your engagement and feedback.

ETCUSDTETC ~ 1W
#ETC If you have Conviction on this coin,. This is a great time to start buying again. So far this support block has been able to withstand selling pressure on sellers. this proves the Buyer is stronger.

ETC/USDT 1D Chart Hello everyone, let's look at the 1D ETC to USDT chart, in this situation we can see how the price has broken out of the downtrend line.
Let's start by setting goals for the near future, which include:
Target 1 - $19.43
Target 2 - $20.10
Target 3 - $21
Now let's move on to the stop-loss in case the market continues to decline:
SL1 = $18.79
SL2 = $17.76
SL3 = $16.72
Looking at the RSI indicator, we see
as we again exceeded the upper limit of the range, which may translate into limiting further growth.

Etc Preparing For Solid Recovery Seems Like Etc Has Already Completed Its Correction And Finally Preparing For Massive Recovery
Falling Wedge Breakout Has Already Confirmed Expecting 2x Bullish Wave Incoming Days Keep Eyes On It

Buy Trade Idea for Ethereum Classic (ETC)Description
Ethereum Classic (ETC) is one of the original blockchain networks, born from the Ethereum hard fork, and it retains a strong foundation built on immutability and decentralization. Here are the key fundamentals supporting a buy trade on ETC:
- **Immutable Ledger:** Ethereum Classic prides itself on maintaining the original Ethereum blockchain, ensuring that transactions and smart contracts remain unchanged and transparent. This adherence to immutability continues to attract users who value decentralization.
- **Strong Decentralization:** ETC operates with a focus on preserving the decentralized nature of blockchain technology, free from centralized influence. This aspect is appealing for developers and investors looking for truly decentralized platforms.
- **Smart Contract Capability:** Similar to Ethereum, ETC allows for the creation and deployment of smart contracts, which opens the door to various use cases in decentralized finance (DeFi), non-fungible tokens (NFTs), and other blockchain applications.
- **Support from Mining Community:** With Ethereum’s shift to Proof of Stake (PoS), ETC has seen increased support from miners, strengthening the security of its Proof of Work (PoW) consensus and adding to the network’s resilience.
Considering these strong fundamentals, ETC presents a promising buy opportunity for those looking to invest in a blockchain that values decentralization, security, and long-term stability.
Disclaimer
Trading and investing in cryptocurrencies involve significant risks and can lead to substantial losses. The information provided here is for informational purposes only and should not be taken as financial advice. Cryptocurrency markets are highly volatile, and prices can fluctuate due to various factors. Always conduct thorough research, assess your risk tolerance, and consult with a financial advisor before making any investment decisions. Past performance is not indicative of future results.

Ehthereum classic📊 #ETCUSDT
⏱ TIME: 1D
📝Two suitable buying ranges have been specified (purple box) and the price is expected to move up from these two ranges.
⭕️risk:MID
📍The initial buying limit: 14.5$ AND 13$
📌TP1: 20%
📌TP2: 40%

ETC/USDT 4HLet's start by setting goals for the near future, which include:
Targets 1 = $18.58
Targets 2 = $19.55
Targets 3 = $ 20.48
AND
Targets 4 = $ 21.84
Now let's move on to a stop-loss in case the market continues to fall:
SL1 = $17.99
SL2 = $16.73
SL3 = $15.56
Looking at the RSI indicator, we see that there is still room for price movement down.

Understanding Price Movements in Stocks and CryptocurrenciesA person's mouth can lie, but charts do not lie.
The first chart is for a stock called Palm Story, and the second is for Ethereum Classic.
Palm Story (2021-2022)
Ethereum Classic (November 2023)
The two charts above are quite similar.
For those who know nothing about charts, it might take 1 to 2 years to understand these reasons.
Commonalities:
Large Trading Volumes at Specific Price Levels:
You can see that trading volume increased significantly at certain price levels on both charts.
Volume Increasing During Uptrends:
It is crucial to note that trading volume spikes during uptrends.
Questions:
Can High Trading Volume Indicate a Trend Reversal?
It depends on the situation. Typically, one reason for a significant drop from high levels is a decrease in trading volume.
When trading volume decreases gradually, the price may either rise further(not much) before dropping or create a double top.
If volume continues to decrease and there’s no one left to absorb the supply, a significant decline occurs.
However, if someone buys heavily to counter a downtrend, the price might continue to rise, similar to a bull market.
Thus, I dislike decreasing volume.
Analogy: It’s like choosing to eat cold food instead of warm dishes at a buffet.
Volume Decreases During Corrections:
The average trading volume decreases, while volume spikes only during significant price increases.
This indicates that while public interest diminishes, some individuals are quietly accumulating shares at specific price levels.
Long Wicks and Closing Prices:
In Ethereum Classic, the long lower wicks in the recent sharp drop (watch the closing price) are significant.
Note the closing price: they tend to close around similar levels, suggesting difficulty in accumulating above certain levels.
You can observe similar behavior in Palm Story’s closing prices at specific levels.
Bull Traps Exist:
In a major trend, accumulation occurs, but short-term bull traps are common.
Bull traps, however, do not determine long-term trends. When a bull trap forms, prices often drop sharply.
Support and Resistance:
It is crucial to recognize that important resistance levels turn into support and that breaking resistance often leads to significant upward movements.
Can Beginners Catch This from the Chart?
It is challenging to grasp these details without closely analyzing the chart. Understanding these nuances usually requires 1-2 years of trading experience and not just reading books.
This is just one aspect of chart movements, and there is a significant difference in detail and skill between experienced traders and beginners who read about it only once.
There are ways to predict potential explosions in price movements before they happen.
Why Did Palm Story and Ethereum Classic Show Different Movements?
Palm Story dropped dramatically, while Ethereum Classic showed tremendous growth.
The reason for this is trading volume.
Failing to consider trading volume in trading is like going into battle with a firearm without knowing how to use it.
Think about this, and if you’re really unsure or have questions, leave a comment.

ETC/USDT
Hello everyone, I invite you to review the ETC pair to USDT chart on a one-day time frame.
Let's start by identifying the downward trend in which the price is moving using the yellow channels.
Currently, you can see how we bounced off the lower border of the channel, which resulted in a 23% price rebound.
Going further, we can see how the price reacted in our strong support zone from $21 to $18, when the price dropped to the lower border of the zone, we could see a strong rebound. However, if the price were to break down, the next very strong support is at $15.5.
Looking the other way, we can determine resistances in a similar way, and as you can see, the price is currently struggling with the resistance at $22.5, when we break out of it, the next resistance is at $25.4 and then very strong resistance at the price of 29.8 $.
On the RSI indicator, we can observe a movement at the lower end of the range, which in the longer term may translate into the expected upward price movement.

ETCUSDTETCUSDT can double from here with in few years. Sl below the trend line.
Chart is self explanatory. Please follow the price action & take the trade as per your appetite.
The information provided here is only for educational purpose. The information provided here is not intended to be any kind of financial advice, investment advice, and trading advice. Investment in stock market is very risky and trading stocks, options and other securities involve risk. The risk of loss in stock market can be substantial. Moreover, I am not a SEBI registered analyst, so before taking any decision or before investing in any Share consult your financial advisor and also do your analysis and research.
Request your support and engagement by liking and commenting & follow to provide encouragement.

ETC Price Update in 3-Day TimeframeETC has precisely hit the entry range between $14.7 and $16.4. The current price is $19.38, which is a 24% increase from the lower range.
The rebound, along with the RSI, indicates a bullish divergence. If the price continues to stay bullish, we are likely to see ETC reaching the $30 range very soon.
The targets remain the same, with primary support at $18 and lower support at $14.7.
DYOR. NFA.
Please hit the like button to support my content and share your thoughts in the comment section. Feel free to request any chart analysis you’d like to see!
Thank you!
#PEACE
