$ETH \ $BTC GONNA SEND INCOMING!The Ethereum-Bitcoin parity saw a local bottom after a long-term correction phase and began to move upward. The upcoming process will continue with a sharp upward trend.
Related coins

Ethereum Looks BullishThe weekly chart looks downright incredible. As discussed, ETH has finally broken bearish market structure and made a higher high, also breaking above the 50 MA for the first time in years. Now it has retested those levels multiple times as support and is outpacing Bitcoin, which is trading sideways

ETH/BTC: Golden Cross Reloaded?This is ETH/BTC on the daily chart.
A major event is about to unfold: the golden cross, where the 50MA crosses above the 200MA.
The last time this happened was in early 2020, around the same price zone, right after a bounce off the 2019 low double bottom and a rejection from the 0.5 Fib level, whic

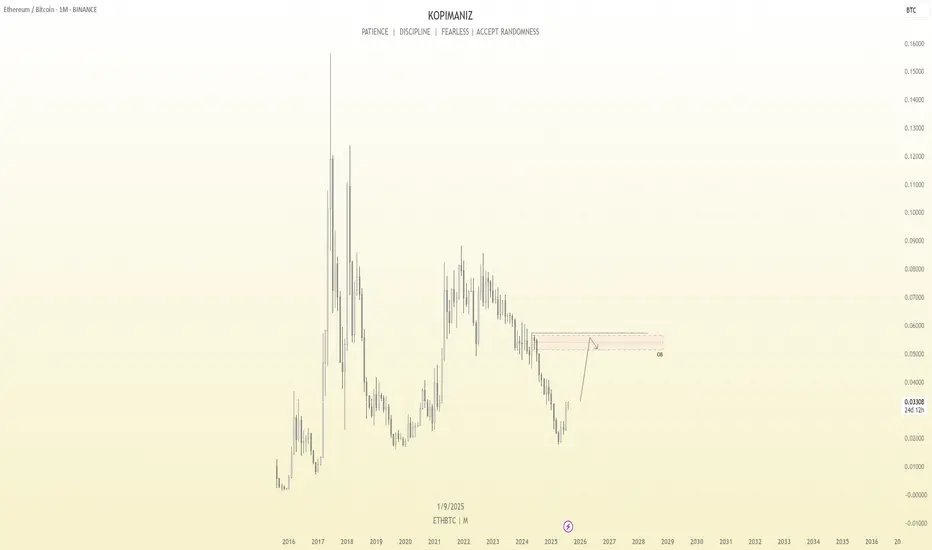
ETHBTC Monthly Outlook: Ethereum Poised to Outperform BitcoinEhereum is showing signs of strength against Bitcoin on the monthly timeframe. After a prolonged downtrend, ETHBTC appears to have formed a potential bottom and is now gearing up for a bullish move.
My projection suggests that ETH will likely outperform BTC in the next 1–2 months, with price target
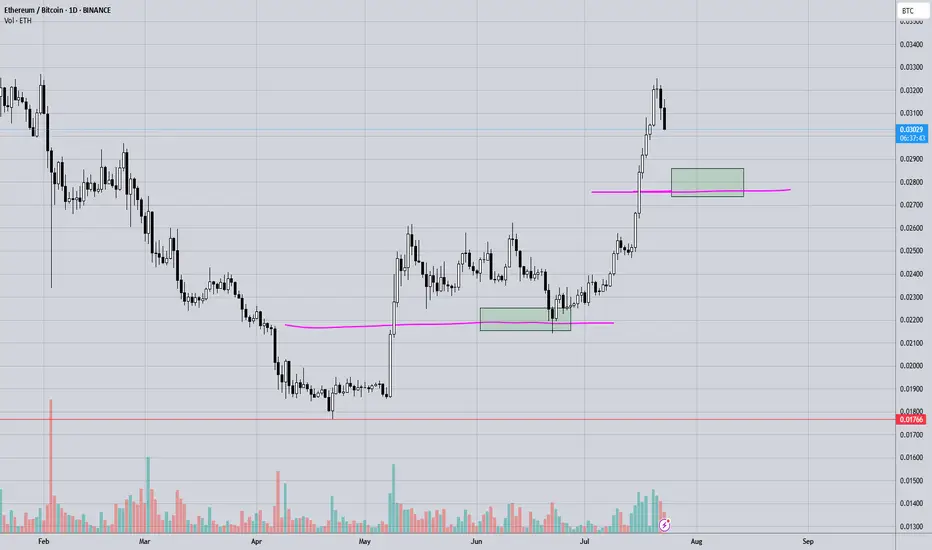
ETHBTC – Daily Supply & Demand AnalysisEthereum is showing a strong bullish recovery against Bitcoin, bouncing off the major demand zone around 0.020–0.023 and pushing higher with consistent bullish momentum.
🔍 Key Observations:
Demand Zone: 0.020–0.023 (orange zone)
This area has been a strong base for buyers, triggering the current ra

ETH vs BTC, Trend shift?📝 After months of underperformance, we're finally seeing some relative strength from ETH vs BTC.
📍ETH/BTC has bounced off a key historical support zone — a level that previously marked major reversals in the cycle.
📈 While the bounce is still in early stages, it breaks the streak of lower lows and

ETH/BTC Golden Cross Ignites
This is ETH/BTC on the daily chart.
The golden cross is now confirmed: 50MA has officially crossed above the 200MA.
Price reacted immediately, jumping straight to the 0.786 Fib level at 0.0347 a key resistance.
This confirms the bullish structure we’ve been tracking:
– Golden cross ✅
– Breakout

Eth/Btc✨ Ethereum vs Bitcoin — perhaps a new season is near...
📍 First week of August 2025
From the depths of a long, quiet downtrend,
Ethereum has risen from the 0.018 ~ 0.022 BTC zone...
Where unseen hands quietly caught the fall.
Now standing at 0.031 BTC:
RSI has regained strength, entering bullish

ETHBTC – Bottom Likely In!Finally stepping in to say it—ETHBTC has likely bottomed.
April marked the final month of its bearish phase, and it just tapped the impulse zone from the last major move, which also lines up with a key range low we haven’t seen since December 2019.
The weekly is starting to show early signs of str

See all ideas
Summarizing what the indicators are suggesting.
Oscillators
Neutral
SellBuy
Strong sellStrong buy
Strong sellSellNeutralBuyStrong buy
Oscillators
Neutral
SellBuy
Strong sellStrong buy
Strong sellSellNeutralBuyStrong buy
Summary
Neutral
SellBuy
Strong sellStrong buy
Strong sellSellNeutralBuyStrong buy
Summary
Neutral
SellBuy
Strong sellStrong buy
Strong sellSellNeutralBuyStrong buy
Summary
Neutral
SellBuy
Strong sellStrong buy
Strong sellSellNeutralBuyStrong buy
Moving Averages
Neutral
SellBuy
Strong sellStrong buy
Strong sellSellNeutralBuyStrong buy
Moving Averages
Neutral
SellBuy
Strong sellStrong buy
Strong sellSellNeutralBuyStrong buy
Displays a symbol's price movements over previous years to identify recurring trends.