ETHBTCTick tock
This is the most unlooked at chart in crypto because there is nothing bullish about it but eths fundamentals are insanely bullish
I'm a huge eth bull and hate looking at this chart
It will run it back at some point but its clearly not in a rush and lesser understood on the institutional
Related coins

$ETHBTC: Correction is over?Ethereum vs Bitcoin shows that the strong surge that kicked off during May might not be a one off...
If you take a look at monthly BITSTAMP:ETHUSD and BITSTAMP:BTCUSD , both charts show a bullish trend that is active until EOY at least (maybe even during the first half of the whole of 2026 depen

Ethereum’s quarterly returns have finally outpaced Bitcoin's !🥶 After a painfully long #altcoins winter, the #ETH/#BTC chart — having recently hit its lowest point in the past 5 years — has finally shown CRYPTOCAP:ETH outperforming CRYPTOCAP:BTC by the end of Q2 2025.
We saw a similar scenario in 2021, when that same bottom was reached a bit earlier, foll

ETH/BTC At 50 MA ResistanceEthereum is battling the daily 50 MA on the ETH/BTC chart, a key area of resistance. If it beaks above, we could see a nice altcoin rally and Ethereum outperforming. If it gets rejected… more of the same.

ETH 400% increase Potential Ethereum (ETH) vs. Bitcoin (BTC) Analysis: 400% Upside Potential
Ethereum is showing a massive bullish setup against Bitcoin (ETH/BTC pair), with a potential **400% growth** from current levels. This rally could unfold in **two phases**, each offering around **200% gains**, driven by strong fundam

ETHBTC: Ethereum to outperform massively Bitcoin.ETHBTC turned neutral again on its 1D technical outlook (RSI = 41.566, MACD = -0.00033, ADX = 21.423) as in the past 4 weeks it failed to extend the rebound of the April 14th bottom. Ahead of a MACD Bullish Cross, a little further correction to make a Double Bottom (DB) would make the pattern more b

$ETH & $ETHBTCBINANCE:ETHBTC and CRYPTOCAP:ETH
BINANCE:ETHBTC is rejecting at the 0.382 fibs level.
Technically, any coin hitting 0.236 is showing weakness.
Another retest is fine, but we don't want to see 0.236 fib level break
For CRYPTOCAP:ETH , price needs to accept above POC and hold 2.5k. If not,

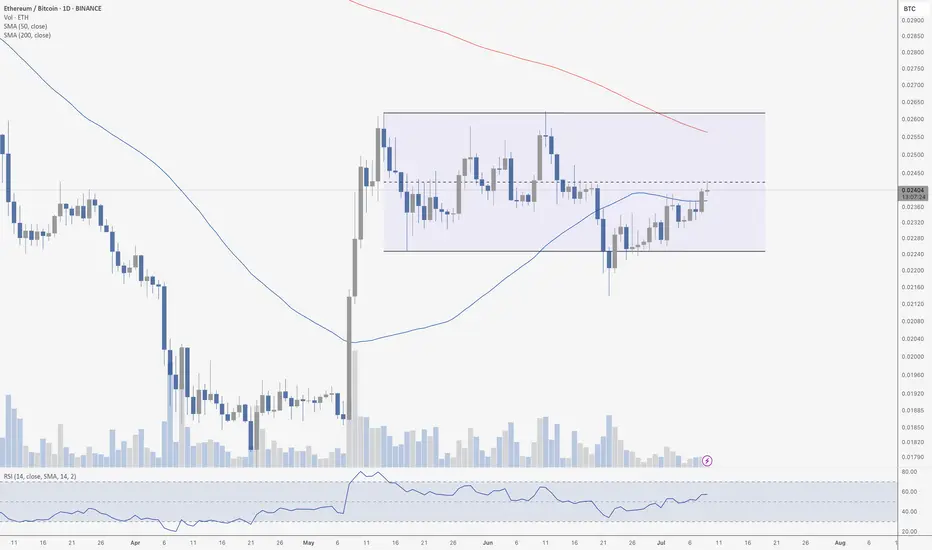
ETH Flips 50 MA Against BTCThe ETH/BTC daily chart shows a prolonged consolidation phase following the explosive breakout in early May. Since then, price has been range-bound between approximately 0.022 and 0.026. We're currently sitting near the EQ (equilibrium) of the range – around 0.0240 – which often acts as a temporary
ETH/BTCPrice is following an AMD structure with a liquidity sweep to the downside. For full confirmation of the setup, a daily FVG inversion is required.
Watching closely — confirmation will unlock further directional bias.

Ethereum vs BitcoinI will be buying Ethereum once we hit the level of interest
The 2021/22 lower high on macro scale is scary, that needs it's own algorithmic target to level it off
Actual bulls are waiting the opportunity
Algo target right into golden zone after we made lower high on monthly scale, is not that bea

See all ideas
Summarizing what the indicators are suggesting.
Oscillators
Neutral
SellBuy
Strong sellStrong buy
Strong sellSellNeutralBuyStrong buy
Oscillators
Neutral
SellBuy
Strong sellStrong buy
Strong sellSellNeutralBuyStrong buy
Summary
Neutral
SellBuy
Strong sellStrong buy
Strong sellSellNeutralBuyStrong buy
Summary
Neutral
SellBuy
Strong sellStrong buy
Strong sellSellNeutralBuyStrong buy
Summary
Neutral
SellBuy
Strong sellStrong buy
Strong sellSellNeutralBuyStrong buy
Moving Averages
Neutral
SellBuy
Strong sellStrong buy
Strong sellSellNeutralBuyStrong buy
Moving Averages
Neutral
SellBuy
Strong sellStrong buy
Strong sellSellNeutralBuyStrong buy
Displays a symbol's price movements over previous years to identify recurring trends.