ETHBTC: Ethereum to outperform massively Bitcoin.ETHBTC turned neutral again on its 1D technical outlook (RSI = 41.566, MACD = -0.00033, ADX = 21.423) as in the past 4 weeks it failed to extend the rebound of the April 14th bottom. Ahead of a MACD Bullish Cross, a little further correction to make a Double Bottom (DB) would make the pattern more b
Related coins

$ETHBTC: Correction is over?Ethereum vs Bitcoin shows that the strong surge that kicked off during May might not be a one off...
If you take a look at monthly BITSTAMP:ETHUSD and BITSTAMP:BTCUSD , both charts show a bullish trend that is active until EOY at least (maybe even during the first half of the whole of 2026 depen

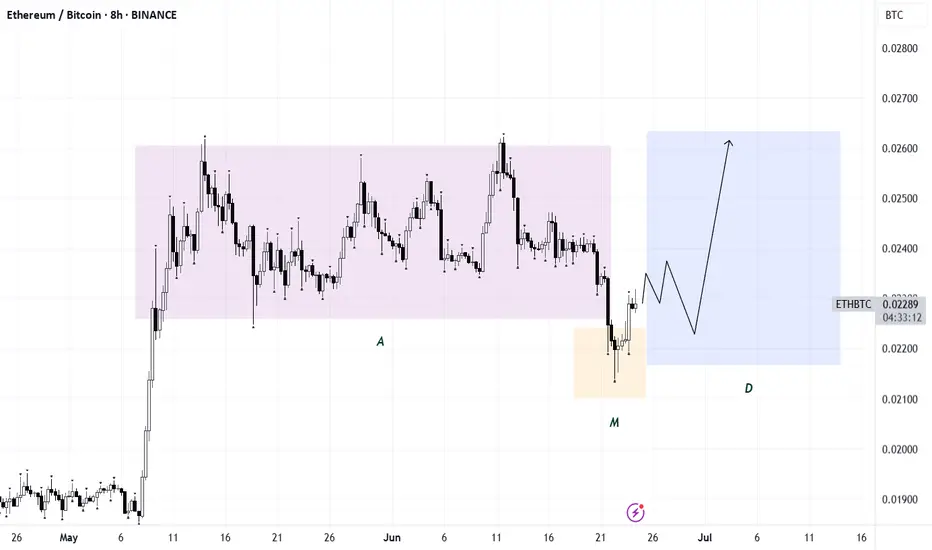
ETH/BTCPotential AMD setup forming. Ideally, a distribution phase unfolds before July 9th — which could trigger a rotation into altcoins.
As always, confirmation is key for any entry. No confirmation — no trade.
Ethereum’s quarterly returns have finally outpaced Bitcoin's !🥶 After a painfully long #altcoins winter, the #ETH/#BTC chart — having recently hit its lowest point in the past 5 years — has finally shown CRYPTOCAP:ETH outperforming CRYPTOCAP:BTC by the end of Q2 2025.
We saw a similar scenario in 2021, when that same bottom was reached a bit earlier, foll

ETH 400% increase Potential Ethereum (ETH) vs. Bitcoin (BTC) Analysis: 400% Upside Potential
Ethereum is showing a massive bullish setup against Bitcoin (ETH/BTC pair), with a potential **400% growth** from current levels. This rally could unfold in **two phases**, each offering around **200% gains**, driven by strong fundam

$ETH & $ETHBTCBINANCE:ETHBTC and CRYPTOCAP:ETH
BINANCE:ETHBTC is rejecting at the 0.382 fibs level.
Technically, any coin hitting 0.236 is showing weakness.
Another retest is fine, but we don't want to see 0.236 fib level break
For CRYPTOCAP:ETH , price needs to accept above POC and hold 2.5k. If not,

$ETHBTC failed multiyear breakout. To understand the investor positioning in the Crypto markets we must understand the CRYPTOCAP:BTC values of the Altcoins. In terms of USD the valuations might go up but if we look at the pair trade of the Altcoins relative to CRYPTOCAP:BTC we can relay understand the flow among the various Crypt

$ETH / $BTC - NOT YET ETH! Almost time!CRYPTOCAP:ETH / CRYPTOCAP:BTC - NOT YET ETH! Almost time!
ETHs narrative is heating up, but I make the case that we need to see a double bottom atleast.
Study 2019!

ETH/BTC Just broke major support.This could be the last shake out before the alt season starts. One final capitulation and alt coins might find their lows against BTC for the long run. I am looking for a double bottom here on ETH/BTC this could be the last nail in the coffin of the BTC dominance.

A major turning point
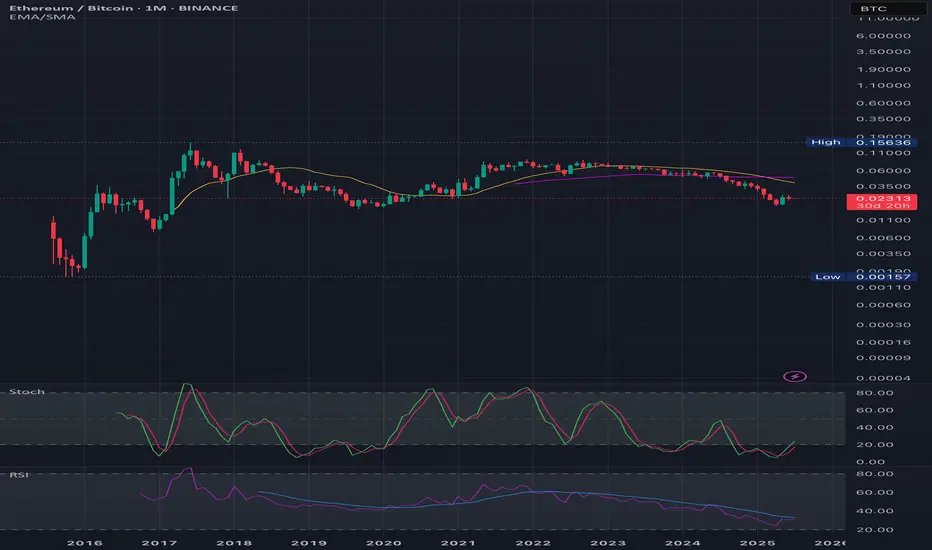
✅ Observations from the Chart
1. Long-Term Support Zones:
• Three key areas are circled (around 2016–2017, 2019, and 2024–2025).
• All three touch similar levels, around 0.022–0.024 BTC/ETH, indicating a strong historical support zone.
2. Previous Rebounds from This Level:
• Each time price hi
See all ideas
Summarizing what the indicators are suggesting.
Oscillators
Neutral
SellBuy
Strong sellStrong buy
Strong sellSellNeutralBuyStrong buy
Oscillators
Neutral
SellBuy
Strong sellStrong buy
Strong sellSellNeutralBuyStrong buy
Summary
Neutral
SellBuy
Strong sellStrong buy
Strong sellSellNeutralBuyStrong buy
Summary
Neutral
SellBuy
Strong sellStrong buy
Strong sellSellNeutralBuyStrong buy
Summary
Neutral
SellBuy
Strong sellStrong buy
Strong sellSellNeutralBuyStrong buy
Moving Averages
Neutral
SellBuy
Strong sellStrong buy
Strong sellSellNeutralBuyStrong buy
Moving Averages
Neutral
SellBuy
Strong sellStrong buy
Strong sellSellNeutralBuyStrong buy
Displays a symbol's price movements over previous years to identify recurring trends.