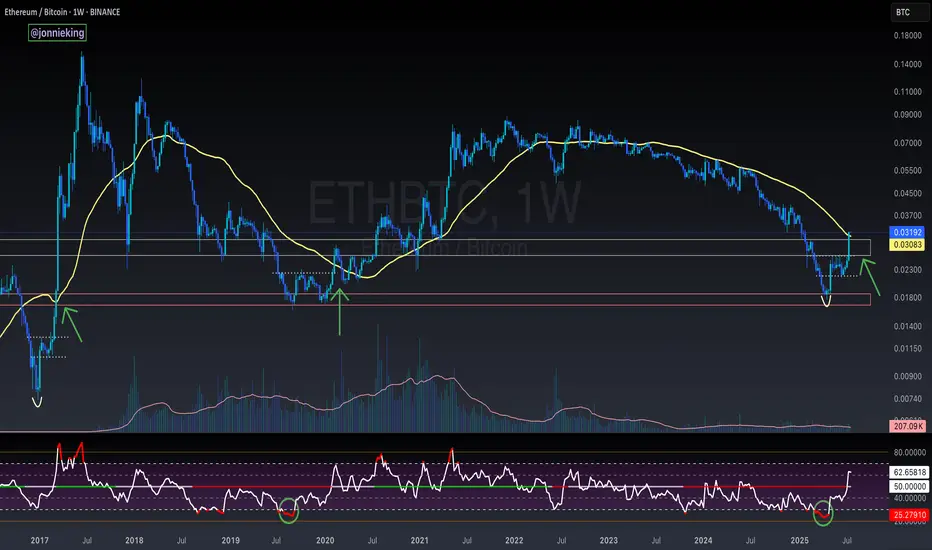
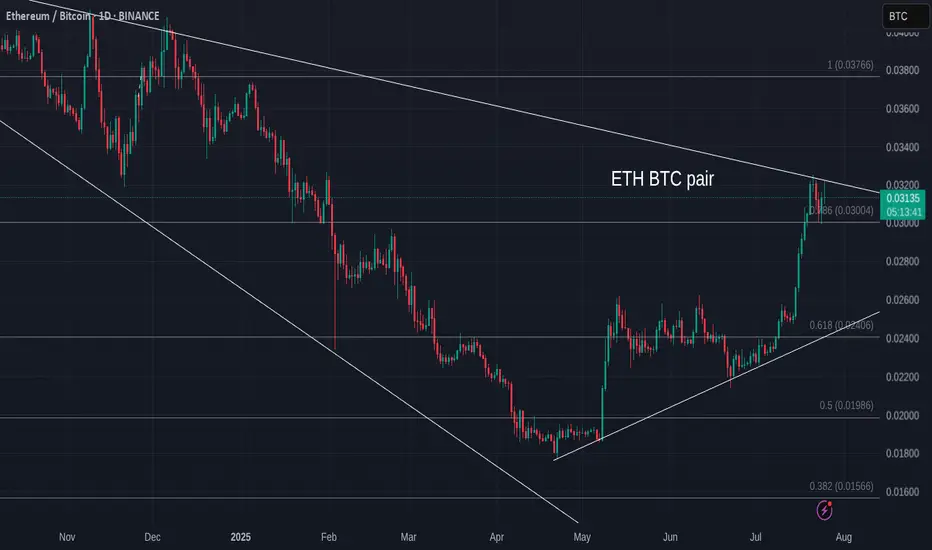
ETH/BTCSince we had a massive break of weekly resistance on this pair...chances are that we might come back to visit previous resistance and test it as support...
ETHBTC trade ideas
Eth/Btc✨ Ethereum vs Bitcoin — perhaps a new season is near...
📍 First week of August 2025
From the depths of a long, quiet downtrend,
Ethereum has risen from the 0.018 ~ 0.022 BTC zone...
Where unseen hands quietly caught the fall.
Now standing at 0.031 BTC:
RSI has regained strength, entering bullish territory.
Moving averages are converging — hinting at a possible shift.
All eyes now on the major resistance at 0.042 BTC...
🔮 Possible scenarios:
1️⃣ A breakout above 0.042 BTC → a path toward 0.057 and beyond.
2️⃣ Failure to break resistance → a return to the same mysterious yellow box.
📌 For now, the market breathes with renewed energy...
But is this the renaissance of ETH against BTC?
Or just another dance before the next calm?
🕊️ Patience remains our greatest ally...

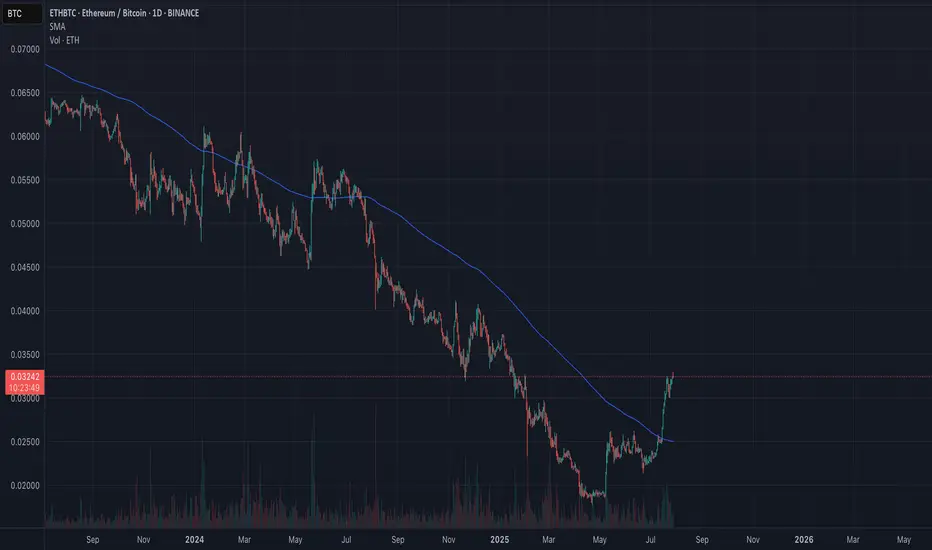
$ETH 2nd Weekly Close Above 50MA = Alt Season2nd Consecutive Weekly Close
above the 50MA for CRYPTOCAP:ETH
✅ Volume to confirm the breakout.
✅ RSI has bottomed.
WHAT TO WATCH 👀
┛Bullish Cross on the 20/50MA to confirm the next leg up.
┛Approaching some resistance ahead at the .236 Fib
┛Expect a small pullback in the next week or two so make sure to get your bids in.
Remember the rotation:
✅ BTC > ✅ ETH > Large Caps > Mid Caps > Micro Caps.
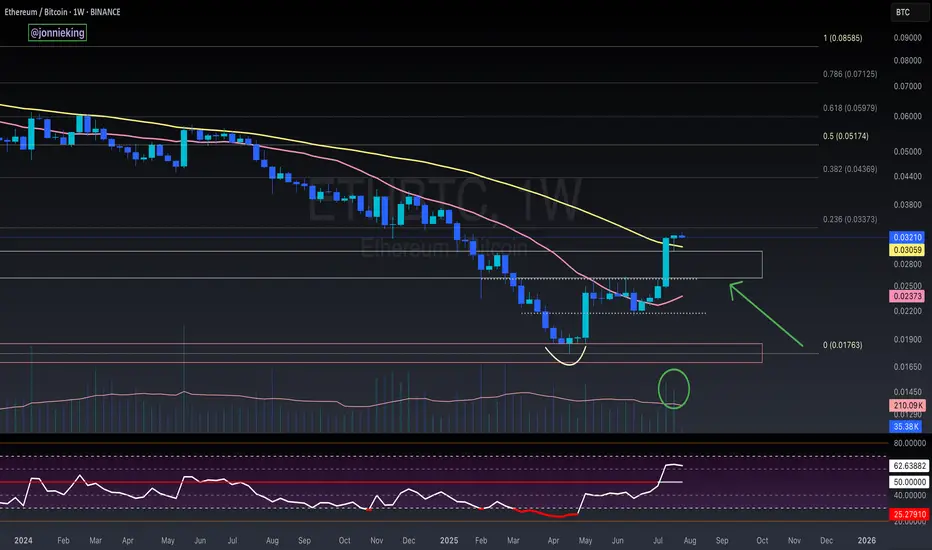
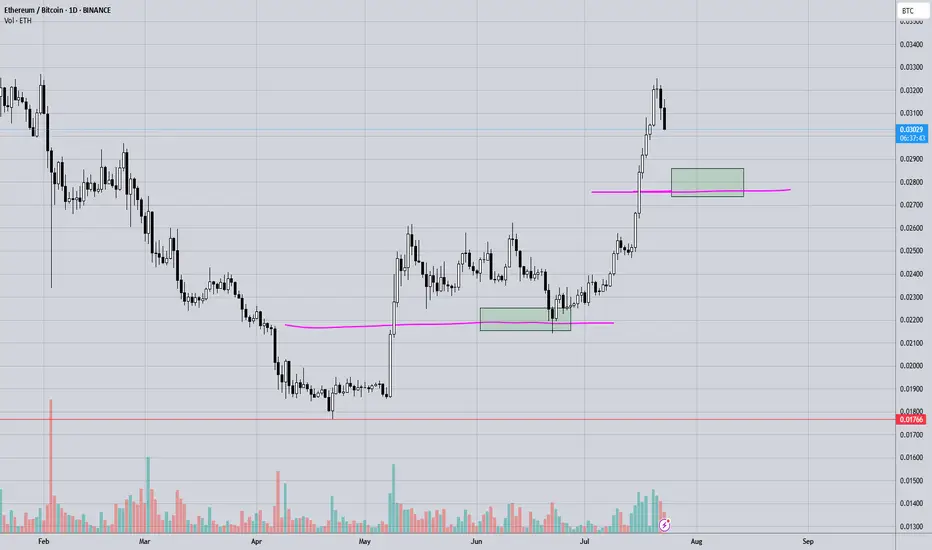
ETH/BTC Golden Cross Ignites
This is ETH/BTC on the daily chart.
The golden cross is now confirmed: 50MA has officially crossed above the 200MA.
Price reacted immediately, jumping straight to the 0.786 Fib level at 0.0347 a key resistance.
This confirms the bullish structure we’ve been tracking:
– Golden cross ✅
– Breakout above 200MA ✅
– Push into major resistance ✅
Now all eyes are on the 0.0347 zone.
If price can flip it into support, momentum could accelerate quickly.
Always take profits and manage risk.
Interaction is welcome.

Total Ethereum Dominance on the Market!🔚 July is coming to an end, and judging by the Monthly Return, it's safe to say that #ETH has outperformed BTC by a wide margin this past month. Yes, we saw something similar in May, but this time we finally have clear confirmations on the chart:
✅ ETH/BTC has broken out of a 4-year downtrend ;
✅ RSI Breakout after the oscillator hit the lowest point in its entire history ;
✅ MACD Bullish Crossover ;
✅ ETH/USDT Broke through the main resistance level (triangle) ;
✅ Spot ETF inflows are outpacing BTC by volume.
Many are still not prepared for what lies ahead. 🤫

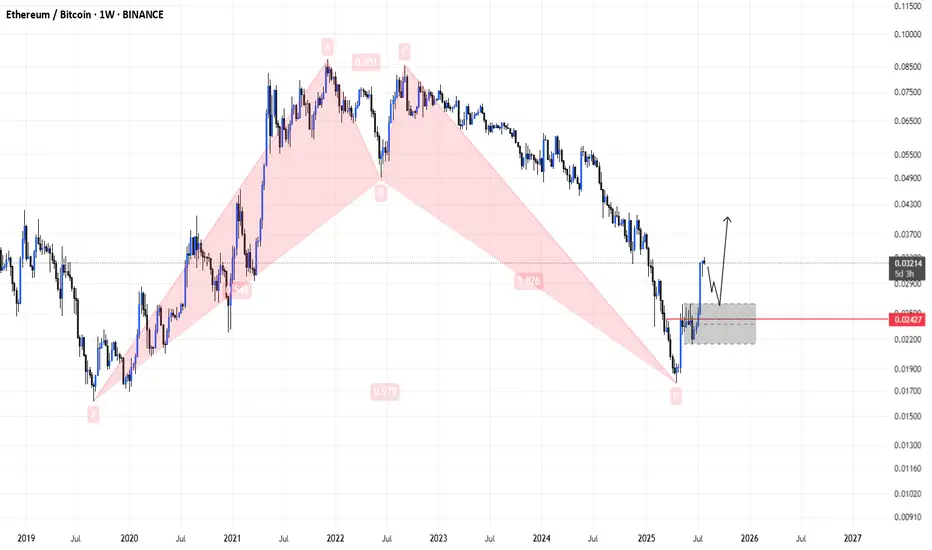
harmonic idea of eth/btc to up trend A harmonic idea for an ETH/BTC uptrend involves identifying specific **bullish harmonic patterns** on the ETH/BTC price chart. These patterns, like the Gartley, Bat, Butterfly, or Crab, are characterized by precise **Fibonacci ratio relationships** between their price swings (labeled X, A, B, C, D).
The "idea" is that if an ETH/BTC chart forms one of these bullish harmonic patterns, it suggests a high probability that the ETH/BTC ratio (meaning ETH's value relative to BTC's) will **reverse upwards** from a specific "Potential Reversal Zone" (PRZ), which is calculated using the Fibonacci extensions and retracements of the pattern's legs. This implies that ETH is likely to outperform BTC in the near future, making a long position on ETH/BTC potentially profitable.
Traders look for confirmation of the reversal at the PRZ using price action (e.g., bullish candlesticks) or other indicators before entering a long trade.

EthbtcTrend reversal signs are nearing completion
This indicates we could start trending back towards the top of the range as eth pushes to its ath usd valuation..
Institutional understanding and interest has spiked as predicted..

Ethereum is breaking out !The ETH/BTC chart looks like #Ethereum has been suffering from impotence for years… 🍆
But judging by the shape, this breakout isn’t just a Bullish signal — it’s the early sign of a massive altcoin erection. 🚀
⚠️ Side effects may include: rapid growth and uncontrollable pumps.
Keep children and weak hands away from the charts !
ETHEREUM LOOKS AMAZINGYes, I continue to share ETH and largely ignore other altcoins. There’s a reason. When ETH outperforms, you can usually throw a dart to find other altcoins that are doing well - a rising tide lifts all boats.
Ethereum had an epic weekly retest of the 50 MA and previous resistance as support, before beating bought back up and turning green on the week. Incredible demand, even vs. Bitcoin. Remember, that line was the first higher high for Ethereum in years, and the first price action above the 50 MA.

ETH Versus BTC - Daily Update - Bitcoin still winning
As mentioned yesterday, ETH has hit long term resistance and got rejected....and it is happening again
ETH seems unable to find the moemntum just yet.
The MACD Daily is still turning Bearish
The Daily RSI is also up high and likely to fall
The weekly RSI is also high though the Weekly MACD has still yet to rise above Neutral
All in All, for me, it is NOT the time....Though we can see that ALTS are running Hot though not a full ALT season as we have seen in the past.
It is fragile...please remain CAUTIOUS
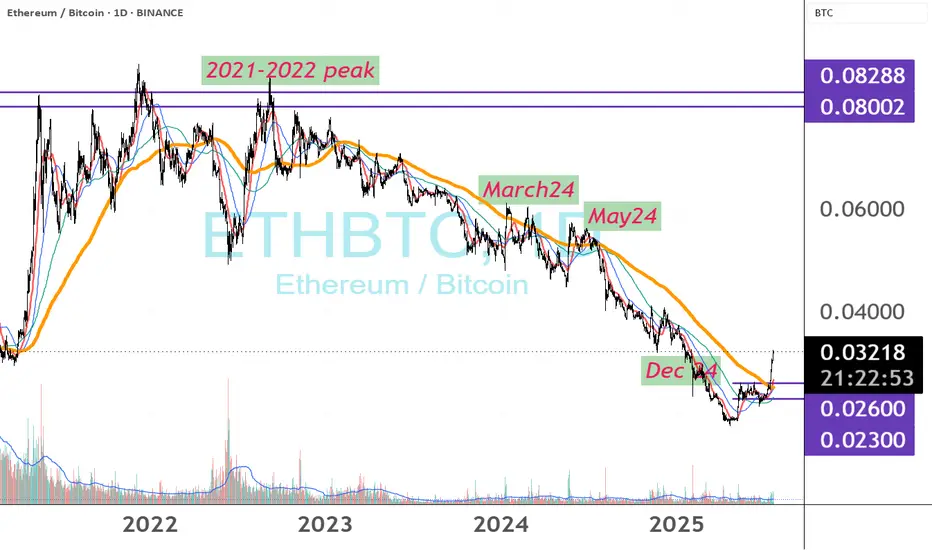
ETH/BTC: Golden Cross Reloaded?This is ETH/BTC on the daily chart.
A major event is about to unfold: the golden cross, where the 50MA crosses above the 200MA.
The last time this happened was in early 2020, around the same price zone, right after a bounce off the 2019 low double bottom and a rejection from the 0.5 Fib level, which sits halfway between the 2019 low and the 0.786 Fib.
In 2025, we’re seeing a strikingly similar pattern:
– Price bounced off the 2019 low
– Got rejected again from the 0.5 level
– And now appears to be gathering strength to flip that level and the 200MA to confirm the Golden Cross
Always take profits and manage risk.
Interaction is welcome.

ETH to Lead BTC Over Next 6 Months, Says Galaxy CEOIn a bold forecast that has reignited the debate over crypto market leadership, Galaxy Digital CEO Mike Novogratz stated that Ethereum (ETH) is poised to outperform Bitcoin (BTC) over the next six months, citing improving fundamentals, institutional tailwinds, and critical network upgrades.
Novogratz, a long-time crypto advocate with deep ties to both traditional finance and blockchain innovation, made the statement during an interview at the Digital Asset Summit in New York, sparking renewed discussion about the shifting dynamics between the two largest digital assets by market capitalization.
Ethereum’s Evolving Investment Case
“Ethereum is becoming more than just a smart contract platform,” said Novogratz. “It’s evolving into a foundational layer for the future of finance.”
This confidence is underpinned by Ethereum’s transition to proof-of-stake, reduced energy consumption, and growing usage of Layer 2 scaling solutions like Arbitrum and Optimism. These developments, Galaxy argues, have made Ethereum more attractive to institutional investors who previously stayed away due to scalability concerns and environmental critiques.
Stronger Fundamentals, Expanding Utility
Ethereum’s network revenue—driven by transaction fees and on-chain activity—has consistently outpaced competitors. According to Galaxy’s internal research, Ethereum generated over $2.1 billion in protocol revenue in the first half of 2025, compared to just under $1.5 billion for Bitcoin.
Additionally, the rise of real-world asset (RWA) tokenization, DeFi resurgence, and the adoption of Ethereum-based stablecoins by traditional finance platforms have significantly enhanced ETH’s long-term value proposition.
“Ethereum is no longer a tech experiment. It’s infrastructure,” Novogratz stated.
Bitcoin Still Dominates, But ETH Momentum Grows
While Novogratz remains bullish on Bitcoin, he emphasizes that BTC is now more of a macro hedge than a dynamic growth asset. With institutional investors already heavily exposed to Bitcoin via spot ETFs, the marginal capital over the next cycle may shift toward Ethereum, particularly as ETH-based ETF products gain traction.
“Bitcoin remains the king of store-of-value assets in crypto. But Ethereum is where innovation and yield are happening,” Novogratz added.
Six-Month Outlook
Galaxy projects that ETH could outperform BTC by 20–30% in the second half of 2025, driven by upgrades like Proto-Danksharding, expanding Layer 2 activity, and Ethereum’s role in cross-chain interoperability.
Novogratz also hinted that Galaxy is allocating more capital into Ethereum-based venture projects and staking infrastructure, in anticipation of a “second-layer boom” later this year.
Conclusion
While Bitcoin remains the undisputed anchor of the crypto economy, Ethereum’s expanding utility, institutional relevance, and revenue-generating capabilities position it to lead performance in the near term.

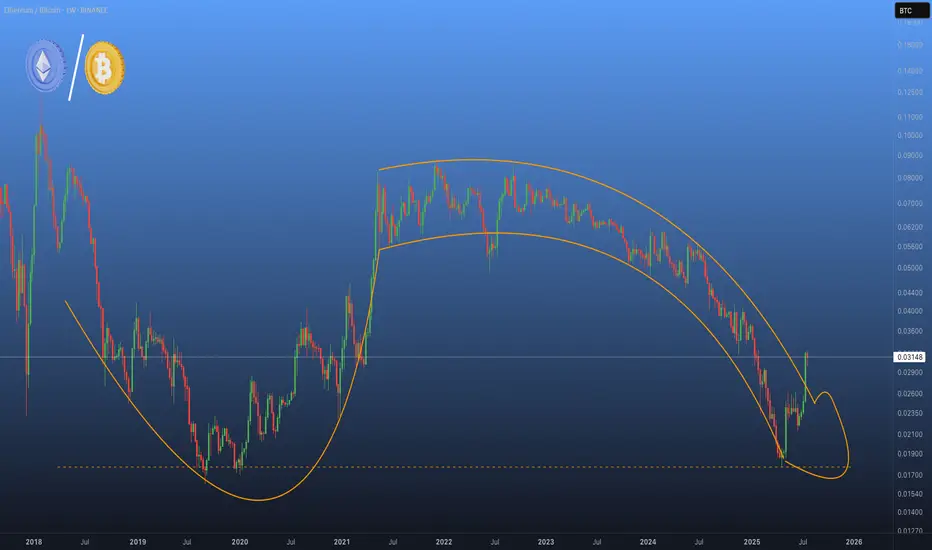
ETHBTC x ETH.DETHBTC x ETH.D
Ethereum bitcoin pair and ethereum dominance will gain upward momentum with the reaction it receives from the major support line in 2019
The better Ethereum is, the better Altcoins will be.

Ethereum Bitcoin pair bottom confirmed!As confirmed by CRYPTOCAP:ETH \ CRYPTOCAP:BTC momentum, we can say that a local bottom was seen at 2019 accumulation levels. With a major reversal from the current region, we can see major movements across Altcoins, with Ethereum being an undeniable leading force and leader for altcoins.

Lets look at ETH V Bitcoin for a moment, before you jump in
Ever since Nov 2021, ETH has Lost Value compared to Bitcoin, as we can see on this ETH BTC chart.
Even while Bitcoin entered a Deep Bear market, ETH lost More....
And now, as we see ETH make a strong move, we have people screaming, "ETH to 10K"
And given how ETH is backed by almost everything American, as America wants ETH as its own Crypto.
Nut lets look here at simple idea.
ETH is up agains Stiff long Term resistance right now.
If we look at the daily chart.
We can already see how PA has been bumped down...an is trying again, even with a daily MACD turning Bearish
The weekly MACD has room to go higher and so I do expect PA to break over resistance and to nreak higher should sentiment remain strong.
As ever, this relies HEAVILY on BTC Dominance and Bitcoin PA to play along.
For me, I am not touching it, even if I can make money on it..
Principles

ETHBTC 1D – Altseason SignalETH/BTC daily chart to detect strength of altcoins against BTC. Helps identify start of altseason.

ETHBTC , what if?ETH/BTC has just pushed above 0.026 on the 200‑day MA, indicating ETH’s relative strength against BTC, despite ETH still trading under $4,000.
Unlike the $4,000 rallies in March, May and December 2024—when ETH/BTC never truly broke out—this move shows genuine outperformance.
If Bitcoin holds at about $120K, revisiting the 2021–22 ETH/BTC high would put ETH near $9.6K.
Historical peaks for reference:
2018: ETH/BTC ≈ 0.12 → ETH ≈ $14,400
2017: ETH/BTC ≈ 0.15 → ETH ≈ $18,000
Altcoin season begins.....Altcoin season begins..:
ETH/BTC has finally broken out above 0.026, signaling Ethereum’s recent outperform Bitcoin.
As long as ETHBTC stays above 0.026, we can expect growing bullish momentum across altcoins.
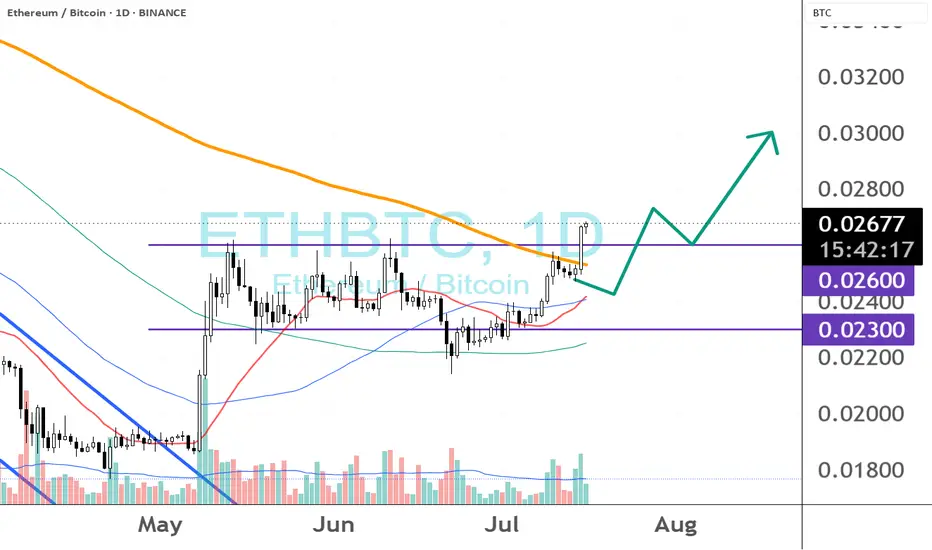
ETH against BTCETH/BTC has broken out of a bullish flag and cleared two key resistance levels. The first was at 0.02498, which held as resistance for a while. After a successful breakout and retest, price surged through the next key level at 0.02587.
We might see a retest of 0.02587—if it holds as support, the next major target to watch is around 0.03. This would mark a significant move and could set the stage for a broader rally.
The ultimate target for this bull cycle remains around 0.048, but let’s take it step by step and focus on the 0.03 level for now.
One thing to watch closely: the weekly RSI is showing signs of bearish divergence compared to price action. If this divergence plays out, we could see a correction. However, if RSI manages to break above 79.95, that bearish divergence would be invalidated—and we’d be in a stronger position to aim for higher levels.
Let’s see how things unfold. For now, 0.02587 is the key short-term level to hold.

ETH MAKES HIGHER HIGH ABOVE 50 MAThis is the first time that Ethereum has closed a weekly candle above the 50 MA since 2023. Price also made a higher high in market structure for the first time since 2021, meaning that it has broken bearish market structure.
Ethereum is the focus for now.

$ETH Closes Above the 50WMA - Alt Season Signal ALT SEASON ALERT 🚨
CRYPTOCAP:ETH Closed the Week ABOVE the 50WMA
Historically this has signaled the start of ALT SEASON.
*NOTE* 2020 had the pandemic hiccup.
This bottoming pattern looks very similar to the 2017 explosion.
Also the RSI matches the 2019 bottom.
Dare I call it yet bros? 🤓