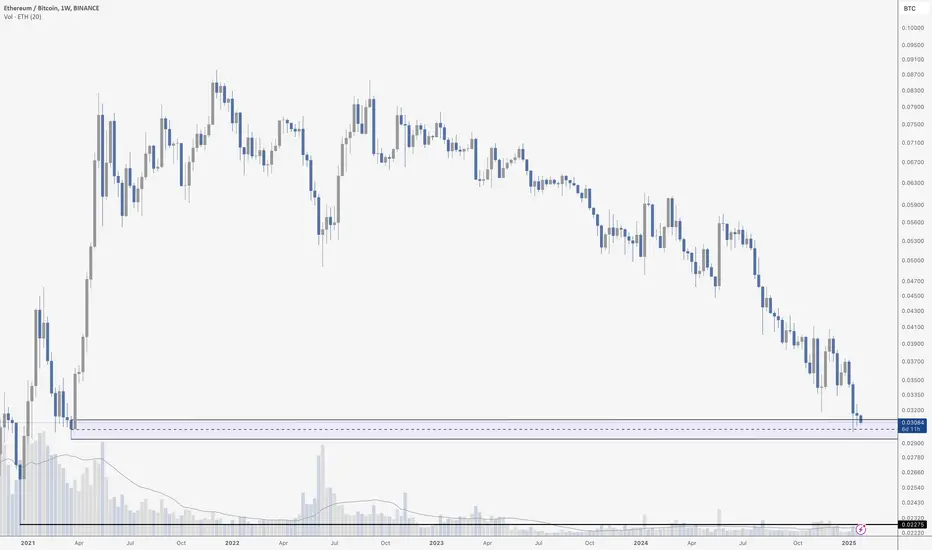
ETH/BTC. History may repeat itself.ETH/BTC touched a very important level and it let ETH print a relief rally. Losing such support may bring ETH back to a very relevant reversal level, BUY HEAVY IN CAPITULATION.
We've added spot at 2300$ ETH/USDT (around 0.025 ETH/BTC).
ETH at these levels is a life-changing opportunity.
ETHBTC trade ideas

will this area suffice !?BINANCE:ETHBTC After this sharp decline, the price returned to an important support area. Will it be satisfied with this price and then we will see a rebound from here, or will the price be exposed to more pressure?
I think this area will be enough, because the previous time when the price touched this area we witnessed a big and strong rebound, and this proves the strength of the support and I think the price will not break it easily.

A personalized indicator for Alt SeasonThe behavior of this chart is such that the green line can only block the candles once and the trend line will definitely be broken on the second collision. If this is our assumption, we will notice that in the last few months this green line has been tested for an upward break, from where the price has been reversed. Now if we move towards this line this time, it is very likely and according to its history that this chart will break upwards and altcoins will be heavily pumped.


ETH/BTC I didn’t anticipate the green box to hit when we began reversing on November 18th, but here we are—it’s a strong reversal zone. If this level doesn’t hold, 28/29 is likely next.
I haven’t seen the strength I expected, even with WLFI (Trump's World Liberty Financial) aggressively buying ETH.
but it's now or never so I except a quick reversal from next week.

ETH/BTC Flash of Lux algo bottom signal with potential Bullish Divergence playing out on Weekly
20% upside is in line with ETH/USDT vision posted in other chart
Correlation


ETH/BTC valuation is at an all-time low — great time to BUYETH/BTC has been steadily dropping for a while now, and it’s currently at an all-time low of 0.03. This prolonged decline could present a unique opportunity for those looking to accumulate at a lower price point. With market conditions being what they are, it might be the right time to consider buying before potential upside.

ETH/BTC , it's time for altseson?
"In the case of ETH/BTC, the price is currently below the liquidity trend line on higher time frames. The current level is crucial; a failure to hold this level could signal a correction phase for altcoins. Conversely, if the price on the daily timeframe closes above 0.03470 with strong momentum and forms (FVG) pattern, it may indicate the start of altseason. To mitigate risk, it may be advisable to exercise patience and wait for further confirmation."
If you have any specific questions or need further assistance with your text, feel free to ask!

$ETH / $BTC Bullish dragonLooking for a partial decline here if we are approaching mark up, whether that comes from a pivot here or even a higher low at trend, which would be the first step in getting an uptrend going here.
The partial decline would confirm with another test of the range high, statistically favoring a breakout, and mark up, thereafter.
Your 1.618 extension, and the measured move to 0.035 would be the first targets here, but typically with these type of dragons, you will eventually see a full return.

ETH/BTCHave a look at the double bottom formed on the weekly. Hopefully we see a higher time frame bounce off support. A bounce in this area will support our potential PEPE trade. Once again, keeping an eye on any close below support.

BTC to ETH - time comes to focus on etheriumBTC topped in a large five wave up rally against etherium
That means ETH should be outperforming BTC until we get a large A-B-C corrective structure hitting target 1 and target 2

$ETHBTC bottomalt szn starting?
CRYPTOCAP:ETH / CRYPTOCAP:BTC bouncing off the same level as it did before alts full sent in march '21?
btc.d failed to make a higher high
maybe, just maybe

BEARISH MOMENTUM DIEING OUT
ETHBTC seems like the Lux Algo is showing a bullish divergence with the Lux Algo showing a bottoming signal!!
This may be it!!


Where Ethereum Stands and The Best Time to BuyEthereum has essentially ranged the last year with large swings up and down. Major support rests at $2770 and upper resistance at $4700 with a current target of at least $13.6k.
While Ethereum has been ranging it's been falling against Bitcoin and like every bull cycle since 2017, Ethereum will be the last to catch up. But that time to buy is now and we can see major volumes have been hitting the Ethereum maket as eth/btc is in the buy zone below 0.031 with a target of 0.09. If bitcoin holds it's current support and runs to $174k in the coming months that puts Ethreum around $15.6k which is very close to my eth/usd target of $13.6k.
Aave market has 88% of all Ethereum on the platform (1.64M eth or $5.1 Billion) loaned out and sold short. There seem to be online wars of people fighting over why eth isn't on par with bitcoin. Ethereum futures has ATH open interest yet lending rates are near zero. These are all major signs of the end of the eth/btc bear market. We should see eth outperform btc this year. There's not much eth left to be sold short. I've never seen such reckless shorting of a crypto currency, but it's all fuel of the run up.


Ethereum’s Q1 Outlook: Fed’s Role in Shaping ETH’s FateEthereum (ETH) is navigating uncertain waters this Q1, with its price down 4% in January and nearly half of its "Trump pump" gains erased. Historically, Q1 has been a strong quarter for ETH, averaging +80% gains. Yet, the Fed's upcoming rate decision could heavily influence the token’s trajectory.
Crypto analyst Benjamin Cowen highlighted on X:
"One risk for #ETH is if the Fed comes out this week and says no QE, maybe that would cause ETH to finally go home on its USD pair, leading the Fed to reverse course in March 2025 causing a quick recovery."
Despite ETH’s historical strength in Q1, January 2025 might end in the red. February and March are typically pivotal months, with average gains of 20% and 22%, but ETH has had mixed results during these months since 2016.
Currently trading at $3.2K, ETH’s performance will likely depend on the Fed’s guidance. A rebound above the moving average could signal strength, but for now, the altcoin remains in a consolidation phase.
While historical data suggests the potential for a rally in February or March, ETH holders are watching the Fed closely. A dovish shift could reignite bullish sentiment, while hawkish policy might extend ETH’s struggles.
Q1 is shaping up to be a decisive quarter for Ethereum. Will the Fed’s actions spur a rally or further dampen the market?

ETH is lagging behing / Still holding BTC intead of ETH.Since 2022 Etherum has underperform BTC. We just broke a major trendline on the weekly.
We can expect more downside to more support level
At this stage, it is still better to hold BTC than ETH

Bullish Outlook for ETH: Buy Zone AnalysisEthereum (ETH) continues to establish itself within a favorable buy zone, indicating potential strength against Bitcoin in the near term. The buy signal generated by the Script Engine Profit suggests a significant upward move may be imminent. The chart outlines Targets 1, 2, and 3 as key levels to monitor for price action in the upcoming period.
Analysis conducted by TANIKING

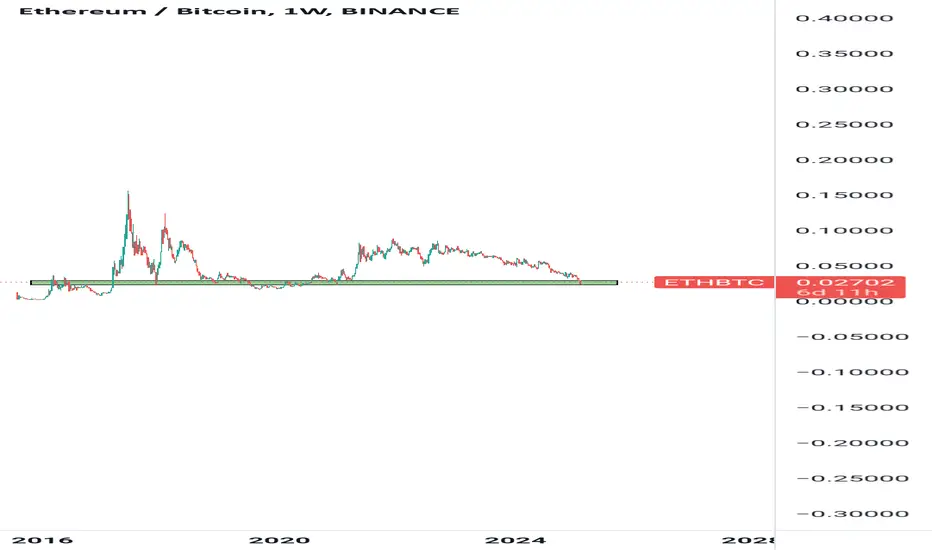
ETH/BTC bottoming?It looks like ETH/BTC has hit bottom, but
If we want to look only at time, we have more time
We are at Q4 2020 prices...
Let's see

ETH/BTC At 2021 SupportJust a quick reminder that ETH has returned to 2021 vs. BTC. Do with this information what you choose, I am buying Ethereum.