$ETHBTCclose above the 7ema or white squiggly to reclaim trend and attempt supply above
shall increase leverage once we reclaim yellow line above
ETHBTC trade ideas

ETH/BTC where is the bottom?You can see the same bottom levels on the RSI that we tested in 2019. It’s possible that this scenario will play out again this time, so I’ll be watching how the weekly RSI closes.

ETHBTC braekout 1h and 4h trendline, im waiting for new ATHETHBTC just breakout descending line 4h and 1h so im waiting for breaking 1day trendline.

ETHBTC Analysis - Time to buy ETH and its tokens?I can understand that the altcoins have lost all the gains, but we took as much profits as possible. ETHERUEM tokens have dropped massively but if u remember those were the coins we made most profit from. It really depends where in the market is your average buy level. Now for those who are trying to build a portfolio for long term knows that at these times, we accumulate good coins. ETHBTC chart is looking great, i expect Ethereum to move first followed by all its underlying tokens.
This chart shows we are in a demand level, which took a while to reach. After a very long time i can say I am bullish for Ethereum and its tokens to perform well.

ETH/BTC bottoming. It's Finally TimeIt's finally time for Eth/Btc to bottom. 2025 will be good to ETH even if it's not viable longer term. Look for Eth to outperform Btc over the coming months.

Eth/btc bullishSoon the beast will come out and will amaze us.
Eth/btc is going to find support at this region.
Alt season will start when eth starts breaking higher.

ETH BTC broke down the multi-cycle support trendline on HTFWe previously expected a reversal on multiple occasions, unsuccessfully each time. Last major prediction is visible in the chart (blurred). There were two major lines of support for ETHBTC, it broke the first one, then it bounced off the multi-cycle support line and we predicted the bottom at that stage and went long.
Unfortunately, that bounce was both short-lived and weak and ultimately it reversed all the bounce and broke down BELOW the multi-cycle support line for ETHBTC.
We will not be shorting this, but the long-time frame for ETHBTC is now in the bearish mode.
Potential key levels to watch are marked below.

Executive Order 5555.Trump DeFi Force (TDF) has issued your orders.
You have 1 year to comply.
All your technical analysis are belong to us.
#PulseChain

ETHBTC UPDATEA break of the last bottom would be very bad for eth and altcoins. We need to maintain the rate.

ETH/BTC Weekly Chart AnalysisThe ETH/BTC pair showcases a repeated pattern of breaking key support levels, followed by a price dump, and then a recovery rally that often targets the breakout level. Historical observations suggest the following behavior:
Key Chart Pattern:
Each major breakdown from horizontal support (marked with dashed lines) is followed by significant downward momentum.
After finding a bottom, the price tends to consolidate and stage a recovery rally, often revisiting the previous breakout point.
Bullish Divergence:
The RSI indicator at the bottom highlights bullish divergences (price forming lower lows, while RSI forms higher lows).
These divergences have historically signaled trend reversals and the start of a recovery rally.
Current Outlook:
ETH/BTC has once again broken support, with a bullish divergence forming on the RSI.
If history repeats, a potential recovery rally could see the price returning to the breakout level (~0.04), with a longer-term trajectory towards higher levels.
Key Levels:
Support: ~0.0315
Resistance: ~0.04, 0.06
RSI Levels: Watch for sustained movement above 37.5 for bullish momentum.
Conclusion:
This pattern could be a lucrative opportunity for swing traders, especially if the bullish divergence plays out as expected. Watch for a confirmed trend reversal before entering long positions.

ETH/BTC Monthly Chart Analysis: Zigzag Swing Levels & ATR-Based This analysis focuses on the ETH/BTC pair using advanced Zigzag logic, ATR-based volatility metrics, and moving averages to uncover key market trends, reversal points, and risk management insights. Let’s break down the chart and what it tells us.
Chart Observations
Swing Levels Indicating Reversal Points:
Green 'B' Labels: These indicate significant swing lows, signaling potential bullish reversals or accumulation zones.
Red 'S' Labels: Highlight key swing highs, marking potential resistance or distribution areas.
The most recent green 'B' suggests that ETH/BTC could be forming a bottom after a prolonged downtrend. However, confirmation is required for a bullish trend reversal.
Moving Averages and Trend Analysis:
The 20-period MA (blue) and 50-period MA (orange) are trending downward, and the price is trading below them. This signals continued bearish momentum.
The absence of interaction with the 200-period MA (purple) confirms that the long-term downtrend remains dominant.
Volume and Momentum:
Volume remains relatively muted, suggesting low participation. This could indicate indecision among traders or insufficient demand to push the price higher.
Oscillators like RSI and custom indicators show oversold conditions, hinting at a potential short-term rebound.
ATR-Based Risk Management:
ATR (Average True Range) analysis highlights elevated volatility, which is reflected in the displayed ATR% and calculated stop-loss levels.
These metrics can guide traders in setting appropriate stop-loss levels to protect against unfavorable market moves.
Trend Direction (Background Highlights):
The light red background reflects bearish scanning, consistent with lower highs and lower lows in the price action.
Key Insights and Trade Ideas
Bullish Opportunity:
If ETH/BTC holds above the recent swing low (green 'B') and begins to climb above the 20-period MA, this could be an early sign of a bullish reversal.
Watch for confirmation through increased volume and momentum indicators turning bullish.
Bearish Continuation:
If the price breaks below the most recent swing low, it could trigger further downside. Use the red 'S' levels to identify potential resistance zones for short entries.
Risk Management:
Utilize the ATR-based stop-loss metrics to define your risk parameters. For long positions, stops should be placed just below the swing low (green 'B'). For shorts, place stops above the swing high (red 'S').
Conclusion:
The ETH/BTC pair is showing signs of nearing a potential bottom, but the trend remains bearish. Traders should stay cautious and look for confirmations before entering long positions. The integration of Zigzag logic, moving averages, and ATR-based risk management ensures that this framework is not only analytical but also practical for executing trades with a calculated risk.

Max Pain followed by Pump and giant altseasonSimple like previous cycles:
Bitcoin will pump, EthBtc suffers.....
Eth recovers and goes to new highs.

ETHBTC 1W Update We're observing Ethereum's ratio against Bitcoin reaching a significant support level on the weekly timeframe. This presents a great opportunity for potential growth. It looks like we might be witnessing a little Altcoin party very soon! 🚀✨

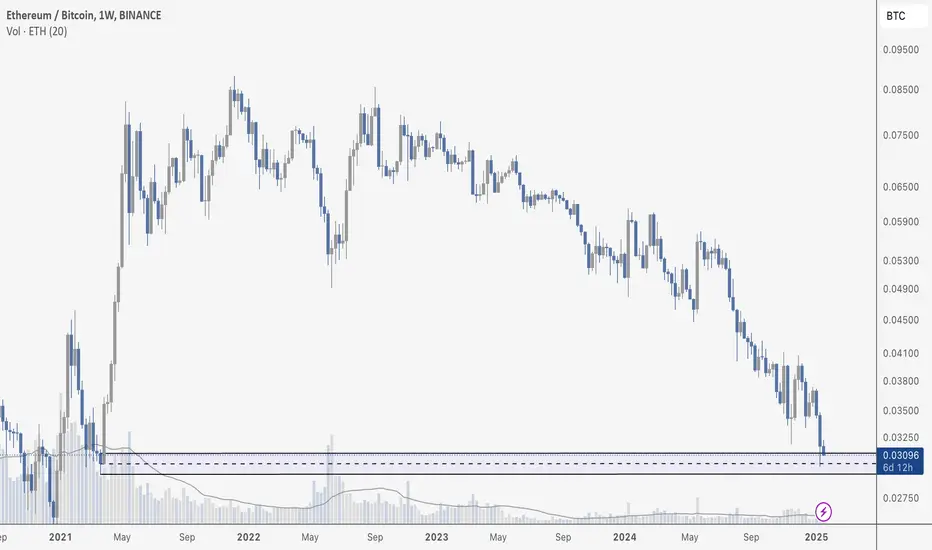
ETH HITS KEY SUPPORTEthereum has reached a long-awaited key support level on the weekly ETH/BTC chart, around 0.03090 BTC. I am buying more - a lot more.
This level has been marked on my chart dating back to early 2021, and its retest is a crucial moment for the pair. This is where the liquidity lives. The recent price action shows Ethereum declining steadily to this region, suggesting a test of buyer strength.
The descending volume during this downtrend hints at decreasing selling pressure, a potential signal that a reversal or bounce may occur. However, if this support breaks decisively, the next logical support zone lies much lower, around 0.02750 BTC, making this level critical for bulls to defend.
For traders, this key level presents an attractive entry point for long-term accumulation, provided the support holds. Watching for bullish divergence on lower timeframes or a decisive weekly bounce with strong volume could confirm a reversal. Caution is warranted, as the ETH/BTC pair remains in a broader downtrend.
Trump’s team has aggressively been buying Ethereum the past few days.
Bearish continuationEthereum Bitcoin is trying to find buying pressure to kickstart its bullish trajectory after it bounced on M and W support. As long as the price is under 0.03200 or 0.03500, the crypto may likely continue its downward momentum to test further established lows.

ETH/BTC UpdateBINANCE:ETHBTC when in doubt always zoom out !! has this chart bottomed out ? COINBASE:BTCUSD BINANCE:ETHUSD

ETHBTC rock solid demand zoneLooking at ETHBTC we are 50% of the demandzone on the monthly timeframe.
Normally demandzones hold precise at 50% and bounce up from there.
As we can see buyers stepping in on the Daily timeframe.
All indicators line up perfectly.
- ETHBTC technical strong setup
- Trump pro crypto
- Alt season should start according to the cryto cycle
Prepare for beserk ETH moves

Bullish butterfly pattern.First short then long.
* What i share here is not an investment advice. Please do your own research before investing in any digital asset.
* Never take my personal opinions as investment advice, you may lose all your money.

ETH/BTC POSSIBLE REVERSALETH/BTC POSSIBLE REVERSAL
ORDERBLOCK, OTE, SFP
The ETH/BTC pair is showing signs of a potential trend reversal at current levels. Following an extended corrective phase within a downtrend, certain technical indicators and price patterns suggest the possibility of a bullish reversal.

$ETH/BTC strategy1. The capitulation phase in 2019 led to a 40% bounce
2. We are currently down 25% from ema21 resistance
Do what you want with this information, options could be such as:
Short SOL / Long ETH
Short BTC / Long ETH
Long ETH.

ETHBTC is more important than ETH/usdtIt seems that Bitcoin’s dominance in financial markets has been strongly accepted by governments. We’ve analyzed Bitcoin dominance, and the details are available in the profile. So far, it has followed our forecast.
However, Ethereum has significantly fallen behind.
The Ethereum-to-Bitcoin chart shows us that it is in a very suitable zone for a reversal. If it hits the first target we’ve set, Ethereum reaching $8,000 to $12,000 is easily achievable. And if it reaches its previous all-time high—though I find it a bit unlikely—the numbers for Ethereum could become very attractive, even exceeding $20,000.
Yours sincerely.

What's up with #Ethereum versus Bitcoin?👥Of course, the sentiment around CRYPTOCAP:ETH has changed lately. If you go to any social network and conduct a social analysis of sentiment around ETH, you can see complete disappointment in the project. And just recently, every other person was sitting and talking about how ETH would overtake Bitcoin. Now I see messages that "Ethereum is cooked." Such a cooling is positive.
💡I have never been a big fan of Ethereum, but I have always been a fan of cold analysis. Now, after considering various methods of analysis, including the social one mentioned above, I see that the asset is oversold and has good prospects for catching up with the market.

Ethereum\Bitcoin.
The coefficient displays multiple reversal factors from lower green technical line supporting (appr) at current levels to possible LTF and HTF reversal chart patterns in different stages of formation, though which can morph into smth else with time. Cyan lines, like cycle but of course not with this kind of scarcity, also may hint on timing, that a reversal may finalize soon, with Eth getting back its strength against BTC. Some indicators also for backstage lighting.
