A Very Scuffed BartleyWould not be 100% on the idea yet because there is no confirmation, but this could be a bullish move. A harmonic pattern: combination of a Bat Pattern because of the 50ish retracement and Gartley Pattern because of the 0.786 retracement on the pattern completion. Keep in mind these are monthly candles, so it could take 84 years to take off. This could be the start.
ETHBTC trade ideas

Short trade
15min overview
1min TF Entry
Sellside trade
Mon 25th Nov 24
5.30 am
LND Session AM
Entry 0.03573
Profit level 0.03478 (2.66%)
Stop level 0.03586 (0.36%)
RR 7.31
Reason - After careful observation, the price reached a pivotal supply level indicative of a sellside trade.

Ethereum Buy RecommendationDue to the positive context of the cryptocurrency market and the fact that Ethereum, the second most important currency in the market, has not yet shown significant movement, I make my buy recommendation based on the following technical aspects developed.
1 - Formation of reversal candles of the tomorrow's star type on the weekly chart.
2 - Beartrap at important long-term resistance
3 - Excellent risk-reward ratio with target at the next important resistance on the weekly chart.
Do your own analysis and don't forget about risk management. Follow us for more analyses like this.

ETH Weak VS BTCEtheruem is looking extremely weak at the moment, we have just broken a ercent swing low and looking downwards towards the previous range.
I have a few levels below that give me confluence to believe that ETH will drop as well as many altcoins unless we absoultely find a bounce and soon.
Below you can find the Previous Range point of control marked in Blue.
We also have a weekly level which fueled the latest massive rally.
And lastly a long term upwards trendling dating back nearly 10 years to 2015, and it comes in perfectly with all the other levels making it a massive support zone.
This may mean signal BTC pulling away or maintaing its price level. Albiet, the candles below us would suggest a swift move to the downside as opposed to a slow bleed.
I will be watching this to be a potentiall accumulation period for ETH.

Good news for ETH holders!Hi there!
It is a high probability that from this level ETH will be Bullis vs BTC.
This is a long-waited moment for ETH holders also it is not bad moment for BTC holders who want to trade ETHBTC pair.
It is a nice opportunity take care and have a nice day!
Good luck traders and holders

Make ETH Great AgainYes you can see fake yout in support trendline indicating strong reversal in some point
Now ETH is stronger than BTC, is altseason start ?
If alt start, ETH will outperform BTC but this week also have many economic event, sometime it can cause turbulence

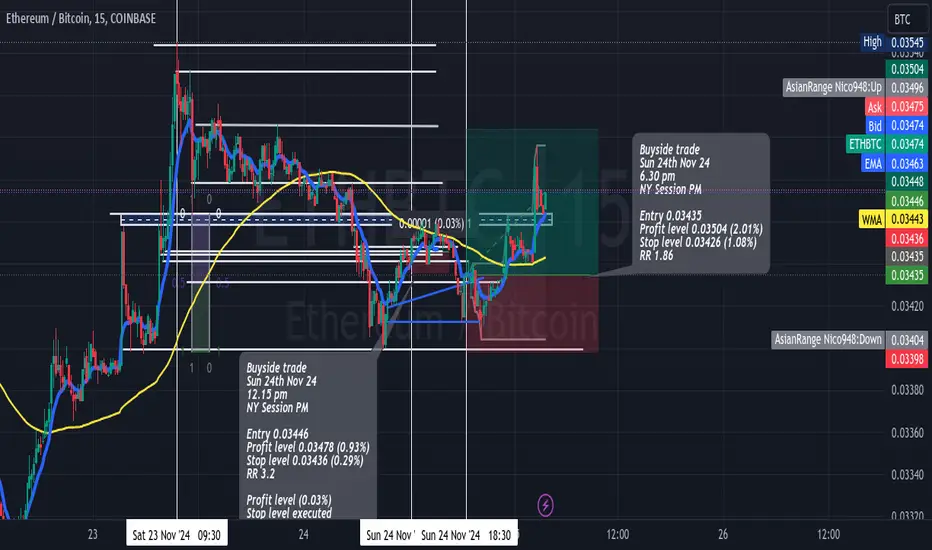
Long trade
Buyside trade
Sun 24th Nov 24
6.30 pm
NY Session PM
Entry 0.03435
Profit level 0.03504 (2.01%)
Stop level 0.03426 (1.08%)
RR 1.86
Reason: Observation of price action and bias towards the upside since Sunday 24th Nov 24th and utilising the PD array for stop loss efficiency (look left).
ETHBTC Likes JANPrior years has shown moves in JAN for ETHBTC first in 2016 and 2017 are the most prominent examples.
We have see so much bear action on this pair it is clear ETH will lead this altcoin season.
Do you think these are coincidences?

Long trade
30min TF overview
Buyside trade
Sun 24th Nov 24
12.15 pm
LND to NY Session PM
Entry 0.03446
Profit level 0.03478 (0.93%)
Stop level 0.03436 (0.29%)
Reason: Price action reached a pivotal demand level indicative of a buyside trade.
RR 3.2

ETH/BTC 8 Year Cycle !For everybody to see, my thesis on CRYPTOCAP:ETH and CRYPTOCAP:BNB
- It is picture clear that CRYPTOCAP:ETH , and its ecosystem of course, is NOT on a 4 year cycle as $BTC. Instead, it appears to be on an 8 year cycle that is becoming clearer and clearer as time goes by ...
- This explains why CRYPTOCAP:ETH and related cryptos in the ecosystem seem to be lagging a lot with respect to CRYPTOCAP:BTC
- The good news: as CRYPTOCAP:BTC plunges the depths of its sinusoidal path in the Power Law corridor in 2026, it is my estimation the CRYPTOCAP:ETH will reach its highest point in this 8 year cycle by around mid-2026, counter balancing CRYPTOCAP:BTC 's plunge
- CRYPTOCAP:ETH and CRYPTOCAP:BNB are 1/4 of the market cap of CRYPTOCAP:BTC
- If this theory is validated, CRYPTOCAP:ETH and CRYPTOCAP:BNB act as a market stabilization fund for CRYPTOCAP:BTC , in other words, they "tame the beast" so that institutions, governments and public at large can invest with more certainty, while CRYPTOCAP:ETH and CRYPTOCAP:BNB keep growing in market cap
The next 2 years will be fun ! Enjoy !
My own "Crypto Laws" used to develop the chart calculations:
1.- Money = Energy
2.- Energy * Time = Work
3.- CRYPTOCAP:ETH init is 4 years behind CRYPTOCAP:BTC Work approx.
4.- CRYPTOCAP:ETH Work = 1/4 CRYPTOCAP:BTC Work approx.
5.- CRYPTOCAP:BNB Work = 1/5 CRYPTOCAP:ETH Work approx.
5.- 5 CRYPTOCAP:BNB = 1 CRYPTOCAP:ETH approx.
* Not financial advice, please do your own research !

Possible Top for BTC/ETHI can see a possible top on the BTC vs ETH chart. It has clearly gone up alot and if you combine that with the divergence on the RSI + BTC Dominance about to fall the possibility for this to happen gets stronger!
This means that Ethereum is about to go for a run and if that happens alot of projects based on ETH will have a big rally.

Is ETH's pain over?Let's put the cap at 0.03. I think this chart shouldn't go below that. It's such an horrendous chart. I imagine everyone accepted defeat for ETH. In an ideal world this should go to infinity but anyway :D I've seen many many charts like this. It comes to the start of the strongest wave and then a new episode begins. I think the pain is over for ETH.

eth getting power against btclooks like that altcoins are oversold and queen of the crypto going to raise over btc and market will change to altcoins
i bought on 0.0339 with the target of 0.04 as a first target
for the long run the price can see 0.1 and 0.15 also
its looking very safe for me to open eth/btc long position with a good risk and reward ratio

ETHBTC - ETHEREUM'S COMEBACK?The corrective decline on weekly frame looks to be reaching its target.
The cross is near the 62% Fibo retracement against the clear impulse, and at the same time reaches the lower boundary of the corrective price channel.
Thrilled to see it bouncing and reversing in a couple of weeks.
Trade safe

ETHBTC Key Support| Trend Change? Bottom?In Today’s analysis -ETHBTC- bottoming around a support region that has multiple technical confluences.
Points to consider ✍️
Point of Control Support
- Dynamic S/R Support
- Bullish Order Block Support
- .618 Fibonacci Confluence
- Swing High Objective
ETHBTC’s market structure has been bearish for a considerable period of time, price action is currently testing the POC, Bullish Order Block and the Dynamic S/R Support for a potential reversal zone.
Price Action need to establish a local bottoming structure around the .618 Fibonacci confluence zone, this will increase the probability of a bottom being in pace.
Overall, in from Bitcoin Insider’s perspective, ETHBTC is a valid long with defined risk, price action it to be used upon discretion/ management. ✍️
Hope this analysis helps.

Altseason - Flippening - ETH/BTCHere the proof for a solid base of the flippening ETH/BTC, upper boundary breakdown and reclaim + channel, waiting for the monthly close and let it happen. GL & HF

Ethereum Bottom?Altcoins continue to underperform Bitcoin writ large, and Ethereum continues to generally be beaten down.
Good.
As you can see, the demand zone below price is currently being front run, which I discussed as a likely possibility a few days ago. As Bitcoin hit $99,000, liquidity moved VERY quickly into Ethereum, which bounced hard.
RSI is oversold, with likely bullish divergence on basically every single time frame. Ethereum is EXACTLY where it should be at this point in the cycle, but general consensus it that is is “dead.” Maybe? But usually that is the best buy signal there is.

ETHBTC - Descending Pattern Breakout This has been a long bear season for alts including ETHUSD which is shown in this descending pattern
Right now there is a lot of money in BTC which I believe will move towards ETH as this pattern begins to breakout
We are currently seeing the extreme lows for Ethereum at this price.
Weekly timeframe

If Not Now, When? All-In on Charts The golden line is like that one friend who always has your back—every time prices hit it, they bounce right up. ETH’s been dragging its feet, but don’t worry, it’s about to crash the party in style!
Action - Buy 💎

ETH/BTC HarmonicLooks Like ETH/BTC is approaching a potential PRZ leg that might show ALTs getting ready to outperform BTC

Calling the ETHBTC bottomAs of writing this ETHBTC is trading at .4508
Current arena - Ethereum was once the future of finance, however other sybil friendly VC chains have front ran it on crypto's greatest value proposition of creating rug pulls with dogs on them.
Technicals - On a monthly timeframe ETHBTC has just completed it's first death cross . And has dumped front running this event.
Narratives - The new prominent narrative of "Liquidity will not find it's way out of the Bitcoin ETFs" convinces me this is the bottom. A rounded bottom or V shape is possible depending on narratives surrounding the ETFs.

ETH bottom, when's the alt season?The alt season after the ETH bottom was usually a year later, those who are now waiting for the alt season will not wait for it. Accumulation should happen within 365 days, after which the alt season will come.

$ETHBTCCRYPTOCAP:ETH - CRYPTOCAP:BTC may be forming a bottom between 0.029-0.031.
It likely needs to wick down in Nov/Dec 2024, then bounce to make it's way back over 0.07 by Spring 2025.
