ETH is becoming worthlessETH's value is derived from the estimated present value of its future free cash flows,
ETH's flows are based on how busy the network will be in the future, transaction fees..
If fees are high DeFi gets build elsewhere on other chains.
If fees are low, ETH has no future free cash flows > This measn ETH can not succesfully scale for it to be a valuable token.
ETHBTC trade ideas


Follow the Ethereum vs. Bitcoin ETHBTC chartFollow the Ethereum vs. Bitcoin ETHBTC chart
A support line that has been ongoing since 2016 has been broken
The price must maintain the support of 0.04916 and not close the weekly below it


ETHBTC at a cycle bottomBINANCE:ETHBTC appears to be reaching a cycle bottom. Sentiment is quite sour (and for good reason). But has things really changed? Just seems like a typical decline while Monthly RSI as at the same level as 2019 with very similar timeframes. Total value locked in DeFi is increasing. Volume is picking up while DEFI dominance is steady, i call that bullish divergence.


ETH BTC Looking for Ending DiagonalTo further my last post on the fib resistance fan. What I think is an Elliott Wave count, focusing on the end part more so. Looking for an Ending Diagonal breakout about the last wave 4.

Breakout ETH v BTC Speed Resistance Fan Continuous downtrend ETH v BTC.. A probable breakout using speed resistance fan. ETH the underdog at the moment however, strength above 0.75 could be a trend turn. One to keep an eye out in my opinion.

ETHBTC generational bottomweekly rsi div
oversold asf
eth rotation will be glorious and most hated rally
renewed etf optimism regardless of security ruling
friendtech/base ecosystem explosion
black rock and larry fink and co will shill my bags
top marked by vitalik getting a gf
remilio

ETH/BTC IDEAMaybe BTC is gonna slow down soon and ETH will finally catch up and bring other alts to new ATH ?
look this is ETH/BTC HTF chart
looks very interesting
just an idea
educational purpose only
nfa

Structures ComparisonBTC/USD & ETH/USD; two pairs were behaving similarly. If this comparison lasts, we`ll soon see a BTC price pump.
(Speculative) !

ETH/BTC Price Movement AnalysisWe are considering the movements of the ETH price relative to the BTC price.
On the chart of ETH movement relative to BTC, we can identify a specific range where the support level is at 0.04885 BTC, and the resistance level is at 0.08869 BTC. When the price reaches the support level at 0.04885 BTC, a confident bounce is observed, followed by further growth.
Currently, ETH has bounced again from the support level and is in a consolidation phase, which may precede a more significant rise in ETH compared to BTC in the medium term.
However, it is important to note that there may be obstacles to the price, including the volume level at 0.06811 BTC. This level is in the middle of the range and could serve as a profit-taking point for market participants.

Chart Pattern Analysis Of ETH/BTC
K3 verified a potential support,
It tested a nearest downtrend line.
K3 will likely stand upon H2 or H1.
It stopped the bearish momentum of K2.
It is likely that the horizontal trend here is still preparing to reverse the long term bearish market.
So, I still hold more ETH than BTC.
If the following candles stand upon H0,
It is likely that the bullish market of ETH/BTC will come up.

#ETHBTC - Forward!This chart is best seen in regular scale rather than logarithmic
ETHBTC have printed a solid pennant or symmetrical triangle and shouldn't take much longer to break up equivalent to BTC once it broke up 20k!!!
Have in mind that this is HTF, Monthly chart in this case and you could be looking into 6 months to 1 year of price developing in these areas, being positive.
This bull market might also be BTC pairs leading ALTs/USDT as we saw earlier in 2017 and that would actually be awesome to accumulate BTC.

ETHBTC show when altseason start? my idea for alt season
buy
doge
xrp
GTAI
YFI
ETH goes to all time high

ETHBTC About to take off. Ethereum expected to gain massively.It has been more than 5 months (October 07 2023, see chart below) since we last published our view on the ETHBTC pair, when we discussed that the 2022/ 2023 Channel Down was a matter of time to reverse as soon as it would hit the Higher Lows trend-line of 2019:
As you can see, the pair started to trend upwards after touching the Higher Lows trend-line on the week of December 18 2023, posting a series of Higher Highs and Higher Lows. The fact that the 1W RSI became oversold below 30.00 and then started trending upwards on Higher Lows, is a clear sign that the pair bottomed, similar to the bottom of September 02 2019.
What followed then was a break above the 1W MA50 (blue trend-line) and then a sustainable series of Higher Highs and Higher Lows until the 1W MA200 (orange trend-line) broke also and turned parabolic.
For now we have had 2 rejections on the 1W MA50, so in our view that is the confirmation signal. As soon as the price breaks above it, we expect ETHBTC to first target the bottom of the 3-year Resistance Zone at 0.08300 and then conclude the Bull Cycle marginally above the 1.5 Fibonacci level, but we will maintain Target 2 there at 0.1200.
Bottom line: Ethereum is expected to gain massively against Bitcoin over the next 12 months.
-------------------------------------------------------------------------------
** Please LIKE 👍, FOLLOW ✅, SHARE 🙌 and COMMENT ✍ if you enjoy this idea! Also share your ideas and charts in the comments section below! This is best way to keep it relevant, support us, keep the content here free and allow the idea to reach as many people as possible. **
-------------------------------------------------------------------------------
💸💸💸💸💸💸
👇 👇 👇 👇 👇 👇

ETH/BTC MonthlyLosing the macro ascending trendline is not a great look but also not a huge fan of diagonals with more respect given to horizontals. There is potential for a deviation but I suspect BTC Dominance has not topped.
Also losing monthly support order block.
A close below 0.049 could see this heading to high 0.03's-0.04.


ETH is about to EXPLODE!I'm not fan of this altcoin, mainly because it has a large market cap (which means most difficult to grow), but what we can't deny is the fact that it's a coin which has been doing it well since ever... Besides that, this coin is the second to grow after bitcoin pumps.
Now, talking about the chart, you can see price is about to break main resistance (red) and is touching channel support of weekly time frame, what means the next objetive of price is upper side of channel (0.060-0.062).
I'm convinced is time to be bullish in crypto!
Cheers!

Double Cycle Incoming ?Expecting double cycle as in 2016
History repeats itself in patterns over time.

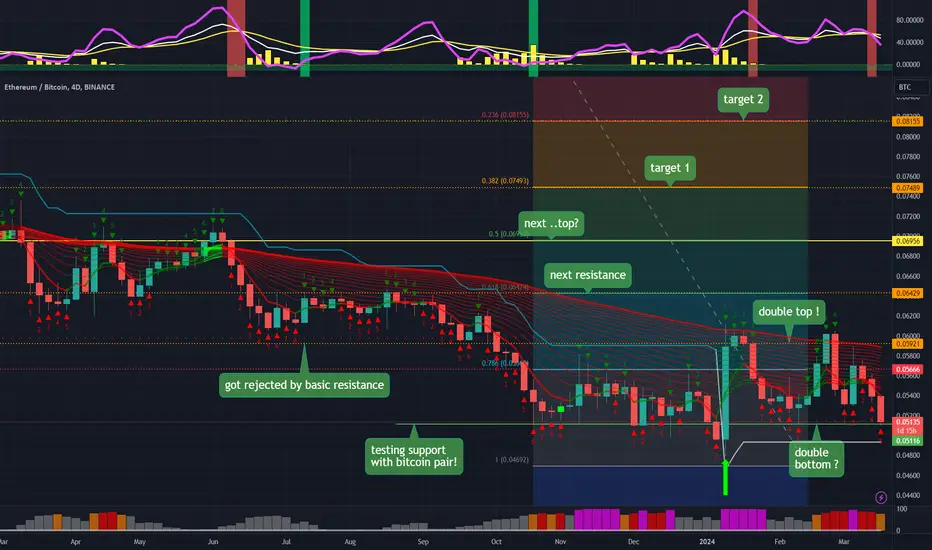
ETH vs Bitcoin ! support level holding !Ethereum is testing again this resistance level with bitcoin
If this support breaks : its bad for ETH -and and worse for altcoins! (we all know that)
However if we are really in a bull market.. well-this support should hold..
But also it may break briefly to scare the bulls... and weak hands !
My bullish targets are on this chart (as always)
Ethereum domain map 2 This is now the general direction of the Bitcoin Ether chart, and when it reaches the shaded area below, it will head again to test the historical top in the shaded area above.
Note: This is a weekly chart, which means it will take some time to fall to the shaded area below, and the average time to rise again to test the shaded area above.
If this chart and dozens of other successful analyzes on my page helped you, please like and comment
