Bitcoin showing strength against Ethereum, but it's not over yetI have been watching this falling wedge for over a year now and my plan was to swap my Bitcoin to Ethereum when the breakout did occur. However, with the halving coming up for Bitcoin and the disappointing Shanghai update for Ethereum in September, Ethereum has struggled to match the performance of its predecessor.
The falling wedge broke structure downward and as of now, I expect Ethereum to more or less follow Bitcoin and/or underperform, but there is good news. The ETH/BTC pair is trading just above a strong support zone. Once we dip our feet into this zone, I believe that bulls will begin to file into ETH, likely within the next 12 to 18 months, likely finding confluence with the beginning of the next true altseason following Bitcoin's probable upcoming rally.
We should be aware of this chart and keep tabs for the opportune moment for a powerful long position will inevitably arrive and we will likely see ETH reach levels against BTC that we have not yet seen before. Unless some unknown future event occurs that puts the significance of ETH into question, it is more than probable that we will see some sort of double bottom pattern form here.
Remember to trade smart, not fast, and always keep your head on your shoulders. We are here to make money, not lose money.
ETHBTC trade ideas

What's the future of Ethereum?We made future predictions based on the past upward cycle.
It's likely to be wrong, but it's a history that's repeated more than twice, so you need to think about it.

$ETHBTC: Ethereum trending down vs BTCLooks like Ethereum has a lot of downside potential in the ratio vs Bitcoin here...
It's been underperforming massively for a good while, ever since it peaked back in 2021, after the 'deflationary asset' bubble combined with NFTs and whatnot, it:
broke under the uptrend inside trendline (a less obvious support level you obtain from plotting a trend line from the lowest high of each swing).
Failed to break over the down trend speed line (starting from the very top in the ratio in 2018, down to the bottom in 2019, you plot a line that represents 50% of the progress made in that time, and 25% of it, and extend it in time like a 'ray')
Triggered a Time@Mode down trend signal in long term charts.
The down trend signal points to a substantial decline in the coming 16 months.
I'd brace for impact and stay on the sidelines, or short it vs Bitcoin if possible. As long as rates don't make it costly to hold, it will pay off. (if not stopped)
Best of luck!
Cheers,
Ivan Labrie.

EthBtc getting ready for massive moveHey guys,
Do make sure to hold some ETHBTC as its printing strong inverse Head and shoulder BULLISH reversal pattern.
Everything is well explained on the chart for your immediate action and all targets were shown.

ETHBTCNothing is personal, I love both assets but I thin in upcoming two years eth will outperform in general.

ETHBTC - Likely Recovery PointETHBTC looks really bearish right now to me at least.
I expect a recovery at either the dotted line which is now being crossed or the secondary dashed line at 0.03
From there I could see a sharp recovery up as in the past ETHBTC has acted this way, aligning also with a higher high within the prior structure

ETHBTC: The Back Bone of Risk Appetite AnalysisIntroduction:
Understanding the nuances of the cryptocurrency market is challenging, especially with its inherent volatility. However, seasoned investors often rely on specific charts to gauge the market's overall sentiment. One such crucial chart is the ETHBTC chart, which is a ratio of Ethereum's price to Bitcoin's price. This article delves into how this chart can be an essential tool for discerning risk appetite in the crypto market and identifying potential altcoin outperformance compared to Bitcoin.
1. A Brief Overview of ETHBTC:
The ETHBTC chart represents the value of one Ethereum (ETH) in terms of Bitcoin (BTC). When the ratio rises, it suggests that Ethereum is gaining strength relative to Bitcoin, and when it falls, Ethereum is weakening relative to Bitcoin. Solana will be used as a representative for altcoins for live examples.
2. Gauging Risk Appetite:
Bullish Sentiment for Altcoins: A rising ETHBTC ratio can be an indication that the broader altcoin market is bullish. Ethereum, being the second-largest cryptocurrency, often leads altcoin rallies. When investors are optimistic about the general altcoin space, Ethereum typically sees significant gains against Bitcoin.
Bearish Sentiment for Altcoins: Conversely, a falling ETHBTC ratio may indicate a more risk-averse sentiment, where investors prefer the perceived 'safe-haven' of Bitcoin over altcoins, including Ethereum.
3. Identifying Potential Outperformance of Altcoins:
Early Indicators: A rising ETHBTC ratio can serve as an early signal that altcoins might start to outperform Bitcoin. When Ethereum, a bellwether for altcoins, gains strength against Bitcoin, it can foreshadow a broader altcoin rally. (depicted earlier)
Reversal Points: Sharp reversals or significant inflection points in the ETHBTC chart can indicate changing market dynamics. These can be pivotal moments where market sentiment shifts, providing opportunities for astute investors.
4. Correlation with Broader Market Indicators:
To get a comprehensive view, investors can also correlate the ETHBTC chart with other market metrics like total market capitalization excluding Bitcoin or volume dominance of major altcoins. Such analyses provide a more holistic understanding of where the market is heading.
5. Caveats and Considerations:
While the ETHBTC chart offers valuable insights, relying solely on it can be myopic. It's vital to:
Combine with Other Tools: Integrate the insights from the ETHBTC chart with other technical indicators and fundamental analyses to ensure a well-rounded investment decision.
Stay Updated: The cryptocurrency market is notoriously dynamic, with rapid changes. Regularly updating oneself on global news, technological advancements, and regulatory changes is paramount.
Conclusion:
The ETHBTC chart is a potent tool in an investor's arsenal, offering insights into market sentiment and potential altcoin performance. However, as with all investment strategies, it's crucial to employ a multi-faceted approach, integrating various tools and staying updated to navigate the tumultuous crypto waters successfully.

ETHBTCETHBTC
Monthly and weekly time frame
There is an important support, I prefer it to come back from here. But if it doesn't come back and breaks the yellow downward trend, the green line is a very suitable point to convert Bitcoin to Ether. The neckline is from the inverted head and shoulder pattern that existed in the market in the past, and *if* we reach that area, a BAT pattern will be formed, which can cause the price to return.

ETH/BTCETH/BTC
This pair is a great indicator for altcoins market in general and ETH/USDT in particular
We can see the price is about to hit a multi-years trendline support and a potential bounce will likely to occur
A good bounce here means a pump in ETH/USDT and Altseason in next days

ETH/BTC is dead - Bitcoin likely explodes towards 42k and beyond- it seems eth/btc has, with this current daily rejection, just confirmed a macro breakdown of more than two year long macro range (picture in comments)
- the implication of this is significant: since btc dominance to btc correlation has been positive, a sharp move down of eth/btc implies a strong upside move of btc dominance which in turn (due to positive correlation) implies that BTC is going to viciously move to the upside
- final target of this upcoming move is anywhere between 42 and 48k

Alt season? Eth looking good !Patiently waited rsi to reach this oversold level, deviated major lower range, eth is trailing behind btc but it will catch up. I am bullish on eth, will see how it react on upper range. Reminder: Always book profit on your way up or down.

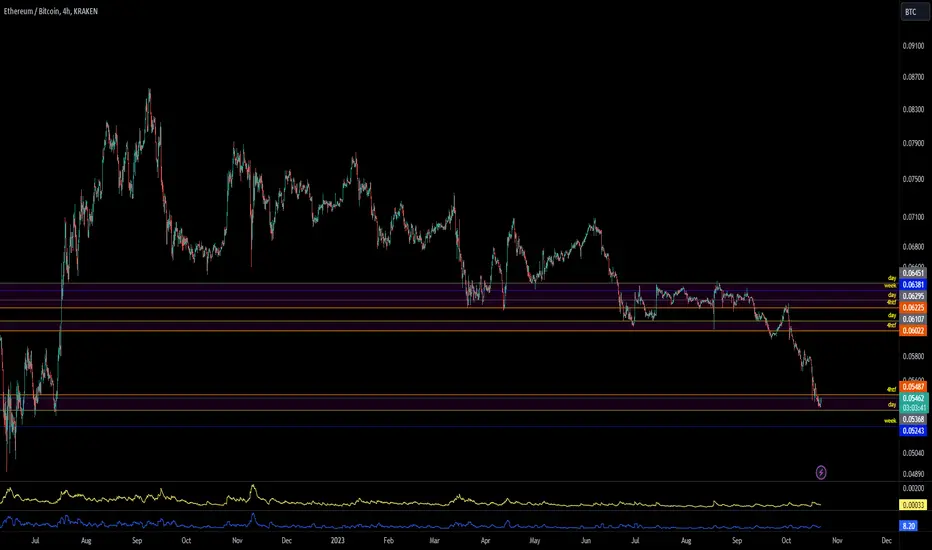
ethbtc-mentoringethbtc speculative view
looks like possibale long on lower TF
but weekley looks very bearish
overall market conditions also supports the downtrend idea
but short trades in bouth direction totally possibale
look for short if close under 5360 and rejects and close under weekly line
look for long if close above and holds 5487 area
***
Tolerance will reach such a level that intelligent people will be banned from thinking so as not to offend the imbeciles- F.M.dostoyevsky

Can ETH Outperform Bitcoin in the Next Bull Market?Potential Harmonic Pattern on the ETH/BTC Pair.
.....................................................................................................................
We are not registered or licensed in any jurisdiction whatsoever to provide investing advice or anything of an advisory or consultancy nature.
and are therefore are unqualified to give investment recommendations.
Always do your own research and consult with a licensed investment professional before investing.
This communication is never to be used as the basis of making investment decisions, and it is for entertainment purposes only.

Wyckoff Distribution schematic #2ETHBTC is showing signs of distribution. Volatility has recently increased, against the notion of absorption that would happen in a re-acummulation scenario. Besides, it has closed below the 200 MA.

ETH.BTC (Long Term Full Analysis)Hello Guys.
How are you?
I hope you are well.
let me say something frankly, it's NOT financial advice.
It's just a vision that belongs to me.
Please just see, think about that, and finally don't hesitate to write your comments.
Today I want to talk about ETHBTC
As you can see we are still in a bearish trend. because we always see a lower high in the chart.
First, I drew a trend line. As you can see, we had four hits on the trend line. It means this trend line is valid so much.
that's really amazing. it proves to us we can expect to see a reaction when the price touches this trendline.
That's really the best zone to buy ETH for the long term and hold.
I drew two support zones. the first one is around 0.04957 and it's really strong.
If you change the price from line to candle stick, you see there are four hits on the trend line.
So, this zone has the ability to push the price up.
although, I believe that the price will lose the first zone finally. Keep it secret, Please.
I'm waiting for the price to touch the second zone to buy ETH.
by the way, we have a flag, based on the flag's theory, when the price succeeds in breaking the low of the flag, A more optimistic approach would be to measure the distance in dollar terms between the pattern’s high and the base of the flagpole to set a profit target.
Also, we have a very positive reinforcement between this red trend line and the first green support zone.
This helps the price to stop dropping.
But if the price loses this zone, the next support zone will be active around 0.02688.
Let me tell you something different, I counted all the waves based on Elliot's rules. please pay attention to the below photo and tell me what you think.
I bet you can buy whatever you want at an amazing price. the rule of buying is being patient. and hold for the long term.
this is the main secret ...
Please don’t forget to write your comments ✍️✍️ Like 👍👍 and Share 👌👌 this Vision with your friends.
And tell me what do you think?
Do you agree with me or not?
Wish you health and success
Sincerely Yours
Ho3ein.mnD

ethbtc6 years triangle and 4 years parallel channel
this will be a wild move in favor of one, more...
energy of years ll be released...

ETH/BTC : Critical MomentETH/BTC has been trending downwards for over a year, and has now reached key support levels. Watch closely for a possible reversal within the zone, and act accordingly.
Fib Grid :
//Durbtrade

ETH / BTCETH broke the lower boundary of the formed triangle, which opens the way down to the 0.045 BTC target. There's also an uptrend line along the way, crossing at about 0.048 BTC.

ETHBTC po3 posibilityBINANCE:ETHBTC There is po3 occuring.If this pattern will reach its target.Alts will able to rise as well.USDT.D and BTC.D must be considered.

Warning to $ETH HODLERS | Watch out from a MSBBINANCE:ETHBTC is giving ETH HODLERS a warning sign with the failing wedge
Bear in mind that ETHBTC has not yet made the bear market capitalisation, where ETH lose 50%+ to BTC THE KING
I am a bitcoin only club member, but still own some dusts here and there
Pay attention when we break the market structure and close below the failing wedge 🏃♂️ 🏃♂️ 🏃♂️

ETHBTC Channel Down but how long before it takes off?The ETHBTC pair is trading within a Channel Down pattern on the 1W time-frame, with the 1W MA50 (blue trend-line) its key Resistance basically since the March 2023 sell-off. What's new though is that after this week's bearishness, it is approaching the 1W MA200 fast.
This coincides with the ETH's previous Bear Cycle bottom. That could be the test level before the price rebounds and really takes off breaking finally above that Channel Down. The current trend is bearish but you wouldn't want to bet on it too long.
-------------------------------------------------------------------------------
** Please LIKE 👍, FOLLOW ✅, SHARE 🙌 and COMMENT ✍ if you enjoy this idea! Also share your ideas and charts in the comments section below! This is best way to keep it relevant, support us, keep the content here free and allow the idea to reach as many people as possible. **
-------------------------------------------------------------------------------
💸💸💸💸💸💸
👇 👇 👇 👇 👇 👇

ETHBTC Possible Long Scenario ETHBTC possible Long Opportunity for long term.
Just need to wait for falling wedge breakout
