eth-btc I've been studying the ETH/BTC chart using fractals, and I've noticed something interesting. The price is currently pausing at a strong order block and sitting right on an ascending channel.
What makes this even more compelling is that both the dates and fractal patterns are aligning, suggesting a potential repeat of past behavior.
Additionally, according to the Rainbow Chart, ETH is in the accumulation zone, which makes the case for the long-awaited altseason even more promising.
ETHBTC trade ideas

Crypto Bubble is about to burstETHEREUM is at stake, where are the institutional money?
bears and day traders flooded the crypto space and new money is not flowing in, CME has ETH as the most shorted asset of crypto space, things can not go on like this,
IT is a make or break in ETH history

ETH BTC LONG PositionETHEREUM is setting up a bullish move against Bitcoin, The bottom at 1850 is completely formed, and high higher's are imminent...

MAY 07, Ethereum Pectra Upgrade taking effect on PricePosts on X reflect optimism about Pectra’s potential to drive ETH price growth, citing the upgrade and potential ETH staking ETFs as bullish catalysts.

Possible Reversal Zone for ETH/BTCETH/BTH has been on a heavy decline, this significant level marked by the parallel channel and Fibonacci level suggest a potential reversal zone. Time will tell.
ETH/BTC is heavily oversold when you look at the RSI reading.
Let me know what you think.

ETHEREUM BITCOIN (BEST-CASE)CRYPTOCAP:ETH is the main platform for thousands of apps and blockchains, all powered by the Ethereum protocol.
This vibrant ecosystem fuels innovation and a wide range of decentralized apps and services.
Free and global Ethereum accounts
Pseudo-private, no personal information needed
Without restrictions anyone can participate
No company owns Ethereum or decides its future


ETH/BTC GOING UPETH/BTC is expected to bottom here and gradually find its way to the 4hr Supply Zone

Eth/Btc bullishTime for this pair to show some strength.
Been waiting for this downfall since 2022. It even went further to the downside than what i expected to do.
Great days are ahead of us when this starts flipping.

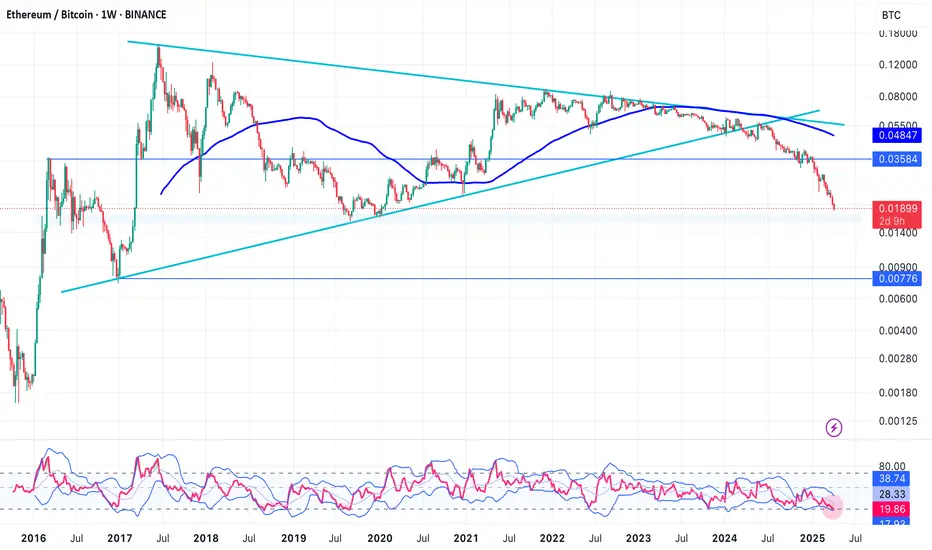
It's enough! It's hard to analyse ETH/BTC since it's been bearish for nearly a year. but it is almost on a major support and is too overbought in RSI. We can expect a reversal from here (~0.19) or it would fall sharply to ~0.008, which is too bad for ETH. So keep an eye on it and look for a reversal pattern.
Ethereum Failing against BITCION ? Here is a valid reason why.
In a world being thrown upside down and sideways and Markets Rising and falling and Rising again on a few words and actions, there is one Shining Light in the world of Crypto
Ethereum - And its constant DROP when compared to BITCOIN
It is possibly the Only coin in the top 10 that has failed to rally at least once, to any significant degree since 2023, when nearly everything else took off.
It currently sits at the same price it was in May 2020 !
It reached its ATH in Nov 2021 and ever since then, has fallen in what is becoming a parabolic reverse curve;
All this despite coins like BASE, Coinbases Crypto, being based on that ETH Layer.
This is pretty well ALL down to the adoption of BITCOIN by corporate ventures, keeping the Bitcoin Dominance high.
I mentioned in a post back in 2023 ( maybe here but certainly on X) how BTC could be used in the "Financial Wars" to come, as a means to weaken and scupper ALT coins.
They tried to Destroy crypto, they failed and so, by allowing Bitcoin ETF's etc, BTC dominance remains High and ALTS Fail
And that is EXACTLY what we have seen so far. As Corporations continue to Buy Bitcoin, Dominance remains high..... It isd as simple as that.
And this ETH BTC chart shows that very clearly.
The REAL question is why the ETH ETF's failed so much.
Maybe that is because MANY people realised the "energy behind Ethereum" - The American crypto , Protected by Gensler and predecessors. The Not really Descentralised structure and power if you hoold a LOT, something not many independants can do

ETH/BTCWe at historical levels were ETH bounced against BTC and when alts started to outperform the king... So... do I need to tell you what to do? :)

ETH/BTC Echo Bubble ExpectedHello friends.
We expect that the ETH/BTC ratio will bottom around here and begin to increase into mid 2026. These kinds of bubbles form a clear pattern of the Euthanasia rollercoaster, and Ethereum still has a lot of users despite the greater mindshare of Bitcoin and the rise of faster competitors like Solona. Ethereum is stronger than Solona for the same reason that Bitcoin is stronger than Ethereum -- it has first mover advantage. When the new tech updates come out, another echo bubble seems inevitable.

ETH/BTC LONG POSITIONETH/btc finally bottomed, now is green light to go all in on the most hated coin ever, Ethereum is doing a great job holding the lines while the stock markets SPX500 sinks

vitalik rocket coming at u in a few monthsVitalik’s been struggling to get his rocket off the launchpad since 2021-22.
He’s practically begging for liftoff now, and it’s only a matter of time before his engine’s roaring again and his rocket blasts all over your face.

ETH Is Oversold Like Never Before !Hello Traders 🐺
In the recent week, we saw a massive long position wipeout, especially in the stock market.
However, despite all the rumors, BTC held itself at these levels and is still inside a falling wedge pattern.
If you don't know what I’m talking about, you can check my last idea about it.
But ETH!
In my opinion, this is a huge discounted price for ETH.
You know why?
1_ Monthly RSI is currently at 25, which means we’re in an extremely oversold situation, and this usually means bulls are about to come back.
Yes — we have all the signs of a reversal from here:
(A): BTC.D RSI is at an all-time high and forming a bearish divergence, meanwhile:
(B): ETH/BTC is extremely oversold right now.
(C): BTC itself has formed a falling wedge pattern right above the weekly Cup & Handle neckline support!
Guess what?
If you zoom in a little bit on the daily chart, you can see there’s a pattern to break, and price is currently too close to the edge of it —
which means time is ticking for ETH, and we are about to see an explosive move.
Probably to the upside, because of all the signs we’ve talked about above.
I hope you enjoyed this idea — and as always, don’t forget our goal:
🐺 Discipline is rarely enjoyable, But almost always profitable 🐺
🐺 KIU_COIN 🐺

ETH/BTC: The Unbreakable Support Line You Need to WatchOn the ETH/BTC chart, when a support level lines up on both log and linear scales—like 0.05 ETH/BTC—it’s a huge signal. It’s a rock-solid price where ETH holds its value against BTC, both as a fixed ratio (linear) and a consistent percentage drop (log). This double strength shows it’s a key battleground for ETH’s dominance, making it a level traders and hodlers can’t ignore—strong until it snaps!

Alt Season Hello traders,
This is the chart of ETH/BTC on the daily chart. This specific chart is the most important when it comes to altcoins because they mostly follow ETH and if we go back in history on every alt season ETH always outperforms BTC and that's a fact.
ETH have been struggling to keep up with BTC in the last couple of months. But now a huge signal was made and if everything goes as planned we might see altcoins outperform BTC. A bullish divergence was spotted where price has made lower lows and the RSI made higher lows, that indicates that there is buying pressure.
If the RSI doesn't go any lower this is a clear sign of huge upside potential.

ETHBTC №2The altcoin movement indicator is at super lows below an important level - it looks like a false breakdown!!!

Why is Eth Falling? ETH/BTC Ratio Hits All-Time Low Since 2020Why is Ethereum Falling? ETH/BTC Ratio Hits All-Time Low Since 2020
The cryptocurrency market is a volatile landscape, constantly shifting and evolving. Recent data has revealed a significant development: the Ethereum to Bitcoin (ETH/BTC) ratio has plummeted to an all-time low since 2020. This stark decline, currently resting at a mere 0.02 has ignited a wave of speculation and concern within the crypto community, raising questions about Ethereum's current standing and future trajectory.
The ETH/BTC ratio serves as a crucial metric for comparing the relative performance of Ethereum against Bitcoin. When the ratio falls, it indicates that Bitcoin is outperforming Ethereum, and conversely, a rising ratio suggests Ethereum's ascendancy. The current dramatic drop highlights a significant divergence in the fortunes of these two leading cryptocurrencies.
The backdrop to this decline is multifaceted. Bitcoin, often seen as the “digital gold” of the crypto world, has exhibited remarkable resilience and strengthened its position. This consolidation is likely driven by several factors, including increased institutional adoption, regulatory clarity in some jurisdictions, and its established reputation as a store of value. These factors have contributed to a sense of stability and confidence in Bitcoin, attracting capital and bolstering its market position.
Ethereum, on the other hand, has faced challenges in maintaining its momentum. While it remains the leading platform for smart contracts and decentralized applications (dApps), it has struggled to keep pace with Bitcoin's surge. Several factors contribute to this relative underperformance.
Firstly, regulatory uncertainty surrounding Ethereum and its classification has cast a shadow over its future prospects. The evolving regulatory landscape, particularly in major economies like the United States, has created a sense of unease among investors. The lack of clear guidelines and the potential for stricter regulations have dampened enthusiasm and limited institutional investment.
Secondly, Ethereum has faced competition from emerging layer-1 blockchains that offer faster transaction speeds and lower fees. These “Ethereum killers,” as they are sometimes called, have attracted developers and users seeking alternatives to Ethereum's perceived limitations. While Ethereum has undergone significant upgrades, such as the transition to proof-of-stake (The Merge), the benefits have not yet translated into a sustained surge in its relative value.
Thirdly, the overall market sentiment has played a role. Bitcoin's narrative as a safe haven and store of value has resonated strongly during periods of economic uncertainty. In contrast, Ethereum, with its focus on innovation and development, is perceived as a riskier asset. When market volatility increases, investors often gravitate towards the perceived safety of Bitcoin.
The decline in the ETH/BTC ratio raises several critical questions. Is Ethereum in trouble? Is this a temporary setback or a sign of a more fundamental shift in the crypto landscape?
While the current situation is concerning, it is essential to consider the long-term potential of Ethereum. Its robust ecosystem, driven by a vibrant community of developers and innovators, remains a significant asset. Ethereum's role in powering decentralized finance (DeFi), non-fungible tokens (NFTs), and other emerging technologies positions it as a crucial player in the future of the internet.
Furthermore, Ethereum's ongoing development efforts, including layer-2 scaling solutions and future upgrades, aim to address its scalability and efficiency challenges. These improvements could potentially revitalize Ethereum's performance and restore its competitive edge.
However, the current market dynamics suggest that Ethereum faces an uphill battle. To regain its footing, it needs to overcome regulatory hurdles, address its scalability issues, and effectively communicate its value proposition to a broader audience.
The cryptocurrency market is notoriously unpredictable, and past performance is not indicative of future results. The ETH/BTC ratio could rebound, or it could continue its downward trajectory. The outcome will depend on a complex interplay of factors, including regulatory developments, technological advancements, and market sentiment.
In the meantime, the low ETH/BTC ratio serves as a stark reminder of the dynamic nature of the cryptocurrency market. It underscores the importance of diversification and the need for investors to consider the risks and potential rewards of each asset carefully.
The current situation also highlights the need for Ethereum developers and community members to focus on the core values of the project, and to continue to innovate and improve the technology. Ultimately, the success of Ethereum will depend on its ability to adapt to the changing landscape and deliver on its promise of a decentralized and equitable future.
In conclusion, while the record low ETH/BTC ratio raises concerns about Ethereum's current standing, it is premature to declare its demise. The cryptocurrency market is constantly evolving, and Ethereum's long-term potential remains significant. However, the current challenges demand a proactive and strategic approach to ensure its continued relevance and success in the years to come.

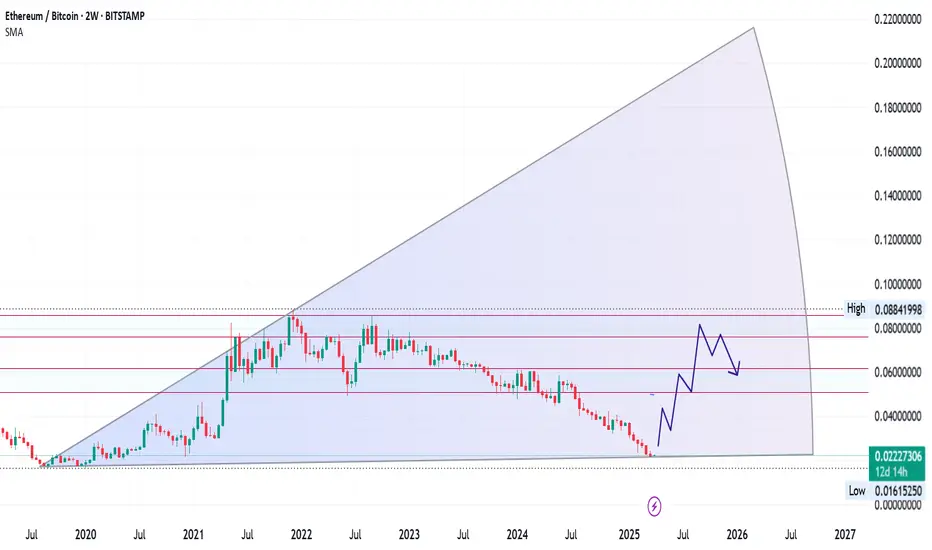
ETH/BTC: The Macro Reversal Play of the Decade
This chart reveals one of the most significant setups in crypto - the ETH/BTC ratio bottoming at historical support and poised for a powerful mean reversion.
After a sustained downtrend through 2023-2024, the ETH/BTC pair has reached a critical inflection point at 0.0222, precisely where smart money accumulates. This level represents structural support dating back to 2020, creating the perfect foundation for a macro reversal.
Technical Structure:
- Perfect technical bottom at long-term channel support
- Currently at 0.0222 (near historical demand zone)
- SMA at 0.0496 providing clear target for initial move
- Projected 3-wave structure targeting 0.07 zone (+250% potential)
#Market Thesis:
We're witnessing the completion of a multi-year corrective phase that has reset ETH/BTC valuations to extreme levels. The projected path shows a powerful rally into mid-2025, targeting the previous resistance zone around 0.07.
Strategic Implications:
The ETH/BTC ratio acts as the perfect hedge against Bitcoin dominance decline. When capital rotates from Bitcoin into altcoins, Ethereum historically captures the first wave of this rotation before smaller caps.
Historical Context:
Every major crypto bull cycle has featured periods where Ethereum dramatically outperforms Bitcoin. The technical structure suggests we're entering exactly such a phase, with timing that aligns perfectly with post-halving capital rotation patterns.
This isn't just another trade - it's positioning for the major narrative shift of 2025.
Eth/Btc what a great story.When everyone was bullish during 2022 ether merge i posted a chart that ether was priced in and it will go down .Now everyone is bearish on ether and people think ether is a joke since it performed really bad compared to btc and some alts but i do think time will come and ether soon will be the leader . The year has just started , and the more we go to the downside the sooner it will end . The altseason will commence ,the only issue is "When" .

ETHBTC reversal, potential alt sznETHBTC is at a critical level that i think it will bounce from, also signalling a potential alt season that we didn't really get like previous cycles.
