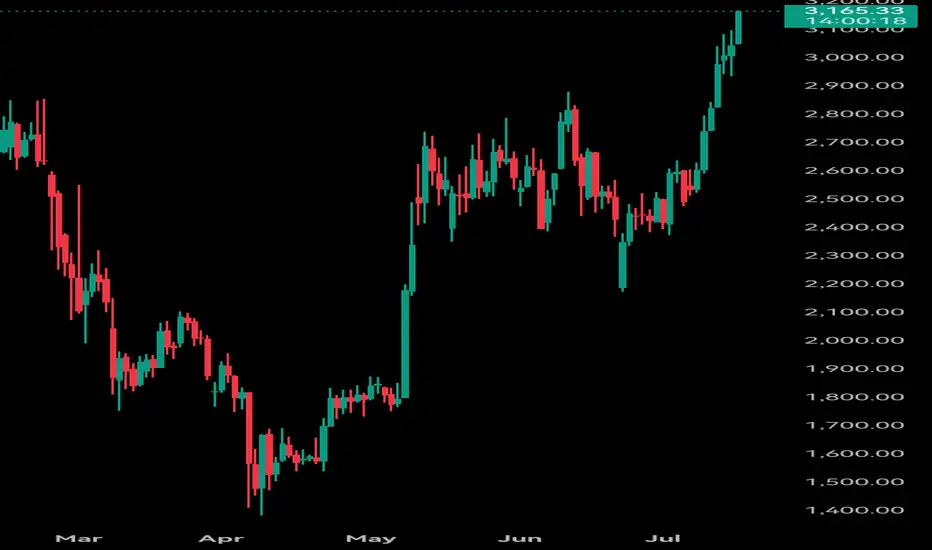
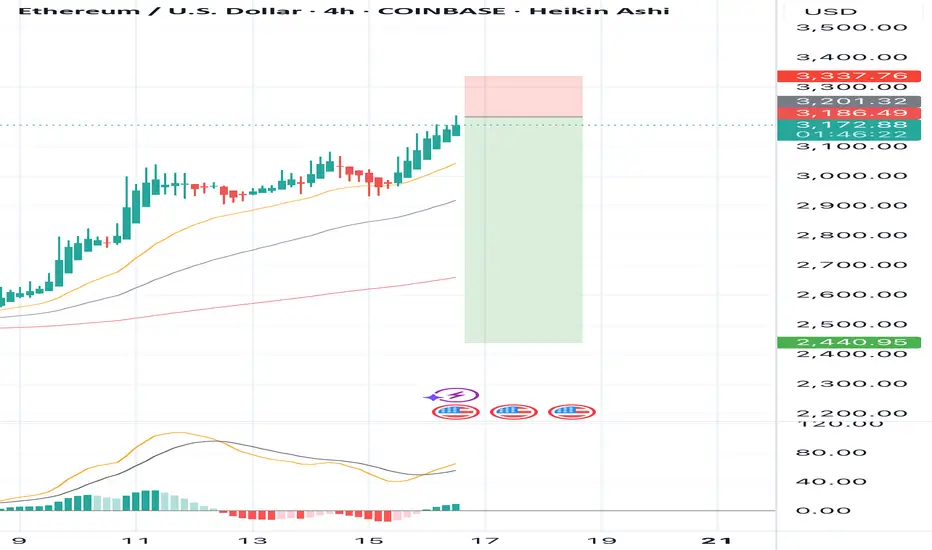
ETHUSD-SELL strategy 9 hourly chart Reg.ChannelNo doubt Crypto is more volatile than other asset classes, and even when very overbought it can run higher. It does not change the over all picture, and recovery is required over time. The correction is like to bring us back towards $ 2,875 area overall, but in steps .
Strategy SELL @ $ 3,300-3,375 and take profit near $ 3,025 at first, and re-sell after for a profit near $ 2,875.
ETHEREUM trade ideas

ETHUSD one more downside motion possible follow entry rulesHey people,
no divergence showing up through the previous downside impulse, meaning, one more move down before long term upside is probable,
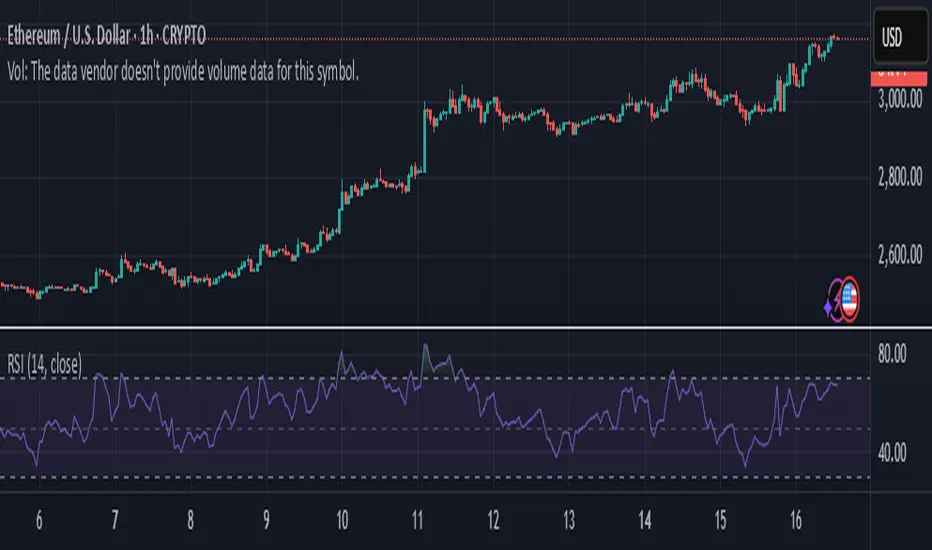
ETHUSD – Possible Correction from Channel Resistance!Pair: ETH/USD
Timeframe: 4H
Structure: Ascending Channel
Indicators: RSI Overbought, Bearish Divergence Forming
Volume: Spike into resistance
📉 What’s happening?
Ethereum just tagged the top of its ascending channel, showing early signs of rejection. RSI is hovering near overbought, with weakening momentum on the last push.
⚠️ Caution Zone:
$3,425 acting as upper resistance
Price may retrace to midline or lower channel support ($3,250 → $3,050 range)
📌 Confirmation:
Look for:
A strong bearish candle or
RSI breaking below 60
Volume divergence
Bias: Short-term bearish correction, bullish structure intact as long as price holds the channel.

ETH READY TO RIPAfter enduring a prolonged and painful correction, Ethereum has tested the patience of many crypto investors, particularly those anticipating the long-awaited arrival of altcoin season. Sentiment across the space has remained cautious, as repeated failed rallies and a lack of follow-through have left many questioning whether the broader alt market will ever regain momentum.
However, there are now early indications that conditions may be shifting. A notable bounce has occurred from the overall low anchored VWAP—a level that has historically acted as a key reference point for value and trend continuation. The presence of responsive buyers at this level suggests it may be establishing itself as a strong demand zone, potentially forming the foundation for a broader structural reversal.
Additionally, subtle but important changes in market structure are beginning to emerge. We're seeing higher lows form on shorter timeframes, alongside a reduction in selling pressure—both of which are early signs of a possible trend change. If Ethereum can sustain its hold above this support and reclaim key resistance levels with strength, it could ignite renewed confidence across the altcoin market.
Should this prove to be a meaningful low, it may very well set the stage for alt season to finally take shape—bringing with it a rotation of capital into high-beta assets and broader participation across the crypto space.

ETHEREUM WILL KEEP GROWING|LONG|
✅ETHEREUM is trading in a
Strong uptrend and the coin
Broke the important horizontal level
Of 3000$ which is now a support
And we are very bullish biased
And we think that ETH will
Reach at least the previous ATH
Of just short of 5000$ but the
First target is to reach and break
A resistance level of 4100$
LONG🚀
✅Like and subscribe to never miss a new idea!✅
Disclosure: I am part of Trade Nation's Influencer program and receive a monthly fee for using their TradingView charts in my analysis.

ETH — Trade Closed! Massive Profit SecuredI’m officially closing my Ethereum position — this trade is now a success story!
I posted right here that ETH was a buy at $2400, then doubled down at $1800. I even echoed the call on Reddit for good measure.
Today, I’m liquidating the entire position with a huge gain. No regrets, just clean execution. 🧠💸
To all the mad lads still holding — good luck and may your conviction be rewarded.
See you next year for the next big swing.
Take your profits, you lunatics! 😄🔥

ETHUSD - Bullish Flag PatternETHUSD is making Bullish Flag Pattern, will it move towards target after breakout?
Entry, Stop Loss & Take Profit are mentioned.

Ethereum at the Crossroads: Can Bulls Maintain the WMA 50 Grip?- Technical Pulse:
- Current price flirting with the WMA 50 ($2,521.54), suggesting a possible make-or-break moment.
- Highlight convergence zones: WMA 21 ($2,296.75) and EMA 200 ($2,277.07) forming a soft cushion below.
- Volume Snapshot:
69.19K weekly—enough activity to suggest accumulation
- Sentiment Analysis:
Gauge prevailing investor sentiment amid consolidation and macro uncertainty.
- Scenario Forecasts:
- Bullish Path: Sustained hold above WMA 50 opens room toward $2,800+.
- Bearish Reversal: Rejection from current level could retest EMA 200 support zone.

Major Breakout– Ethereum Broke Free from 'Clashing Resistances'🚀💥 Major Breakout – Ethereum Broke Free from the Clashing Resistances 🔓🟣
ETH has finally done it.
After months of battling overlapping resistances — the Clashing Stones, as we called them — Ethereum has broken out, and $2,912 is now acting as support, not resistance.
This breakout isn't just technical, it’s structural.
The previous 1-2-3 rejection setup has now been invalidated.
🔎 Chart Summary:
✅ $2,912 = confirmed breakout zone
🎯 Destination 1: $4,881 (if Vitalik’s asleep 😴)
🚀 Destination 2: $6,443 (if he wakes up 💡)
🔭 Scroll up for Destination 3
This is the real ETH breakout we’ve waited for — not hopium, not chop. This is clear structure.
If BTC stabilizes near 114,921+, ETH could enter outperformance mode and gain serious traction on the ETH/BTC chart.
📢 Keep your eyes on narrative catalysts:
ETH ETF, L2 growth, and Vitalik waking up...
We are officially off the resistance — and heading to where few have charted before.
One Love,
The FXPROFESSOR 💙
📌 Long — as long as $2,912 holds. If it fails, you already know what to do.
Disclosure: I am happy to be part of the Trade Nation's Influencer program and receive a monthly fee for using their TradingView charts in my analysis. Awesome broker, where the trader really comes first! 🌟🤝📈

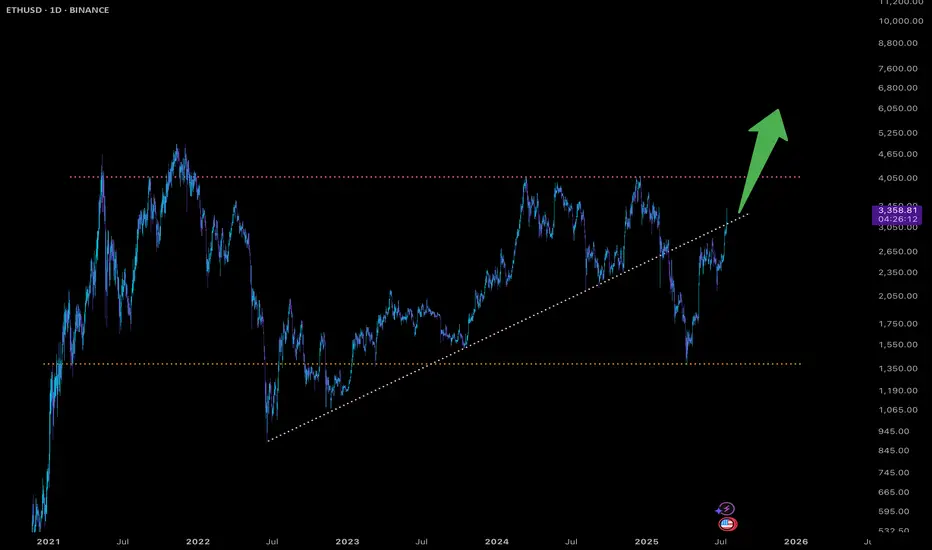
ETH Breakout Incoming:10K+ with Altcoin Rally, BTC to 140KEthereum (ETH) has returned to the trend, signaling strong bullish momentum. A confirmed breakout could propel ETH to 10K+, igniting the long-awaited altcoin run.
Bitcoin (BTC) is targeting 140-145K in this cycle.
I’ll provide the next update once I reassess the market after BTC hits this price target
ETHUSD | WaverVanir Macro Map🧠 ETHEREUM: DON'T SELL BEFORE $9K
Weekly compression breakout confirmed.
Accumulation → Equilibrium → Expansion.
🚀 Targets based on long-term Fibonacci extension:
• 1.618 = $7,824
• 1.786 = $8,612
• 2.0 = $8,979 (WaverVanir threshold)
• 2.618 = $10,652
🔴 Premium zone around $4.8K will be the next key battle.
Volume base forming, volatility coiling.
If ETH clears this range, we expect full trend development through 2025.
WaverVanir DSS Protocol | ETHUSD Weekly | July 2025
#Ethereum #ETHUSD #MacroTrading #SmartMoneyConcepts #WaverVanir #VolanX #CryptoOutlook #LongTermThesis #TrendForecast

ETH - UpdateETH has been "crashing" lately but I think it is in the end state of a long rally. In fact I think we are in the last stage of Wyckoff distribution and we could see a major rally soon. Looking at the 300 SMA we bottomed there in June 22 and if we hold there, it could be the spring board for a massive rally to new highs.
Also I think GLD will top in a week or so which will be good for BTC and ALTS.
Not investment advice. Please like and share and leave a comment.

Ethereum Breakout and Liquidations – A Lesson in Bear Traps and 📚💥 Ethereum Breakout and Liquidations – A Lesson in Bear Traps and Risk Management 🧠📈
Today, July 16th, Ethereum gave us a real-time masterclass in market psychology and risk management.
Let’s start with the facts:
📊 Liquidation Data
🔻 $36.34M in long liquidations
🔺 $86.02M in short liquidations
💣 Total ETH liquidations: $122.36M (data mentioned on video might differ, i made a small mistake)
🌐 Across crypto: $351M liquidated (more shorts than longs)
This imbalance tells us one thing: a bear trap played out, and it played out hard.
🧠 Educational Takeaways
1. Bear Traps Are Real — and Expensive
A bear trap occurs when the market appears bearish, drawing in short sellers — only to violently reverse upward. Today’s Ethereum move was a textbook example. If you’ve been following my analysis, we discussed the regression lines, divergences, and structure that all warned against going short at support.
2. Open Interest and Sentiment Signals
Open interest has been declining — which means fewer speculative positions. That often creates space for a real, organic move, not one fueled by overleveraged noise.
3. Spot vs. Leverage – Risk Control First
Leverage isn’t the enemy — unmanaged leverage is. I personally use a dedicated high-risk account to trade fast setups. This keeps my core capital untouched and my psychology stable.
✅ Risk is defined before the trade.
✅ Entries are structured like bullets — small, multiple attempts.
4. The Mental Game is the Real Game
Trading isn’t just technical. It’s deeply psychological. Whether you’re trading Ethereum, Bitcoin, or altcoins like AVAX and XRP, emotions must be managed before capital is deployed.
5. Like-Minded Community = Sharper Edge
My best trades and insights often come from conversations with trusted, sharp minds in this space. Surrounding yourself with serious traders can be the difference between evolving — and evaporating. To my brother Vlatko (met on Tradingview, been hanging around online ever since, met in person once, now a true friend that we frequently disagree but always agree to respect and empower each other = The power of our community here on TV!)
Final Word:
When markets move fast, lessons appear even faster.
Study the traps. Respect the levels. Structure your risk.
And above all: trade with a plan that allows joy.
One Love,
The FXPROFESSOR 💙
Disclosure: I am happy to be part of the Trade Nation's Influencer program and receive a monthly fee for using their TradingView charts in my analysis. Awesome broker, where the trader really comes first! 🌟🤝📈

ETH/USD: The Great Ethereum Bounce is HERE!🚀 THE MOON MISSION (Resistance Zone)
HEALTY TARGET: $3,500 - Your text says it all!
Upper Trendline: Acting as launch pad
Psychological Resistance: $3,000 round number
🟢 CURRENT LAUNCH PAD
Price: $2,529.15 - Breaking above key resistance
Previous Resistance: $2,324.45 - Now turned support
Support Zone: $2,277.81 - Strong foundation
🔴 DANGER ZONE (Abort Mission)
Critical Support: Lower trendline around $2,000
Major Support: $2,277.81 level must hold
💡BUY ZONE: $2,100 - $2,180 🎯
⚠️STOP LOSS: $1999 (Previous resistance) ⚠️
TAKE PROFIT 1: $2,650 (Take 50% profits) 🔥
TAKE PROFIT 2: $3,300 (Let winners run!) 🔥

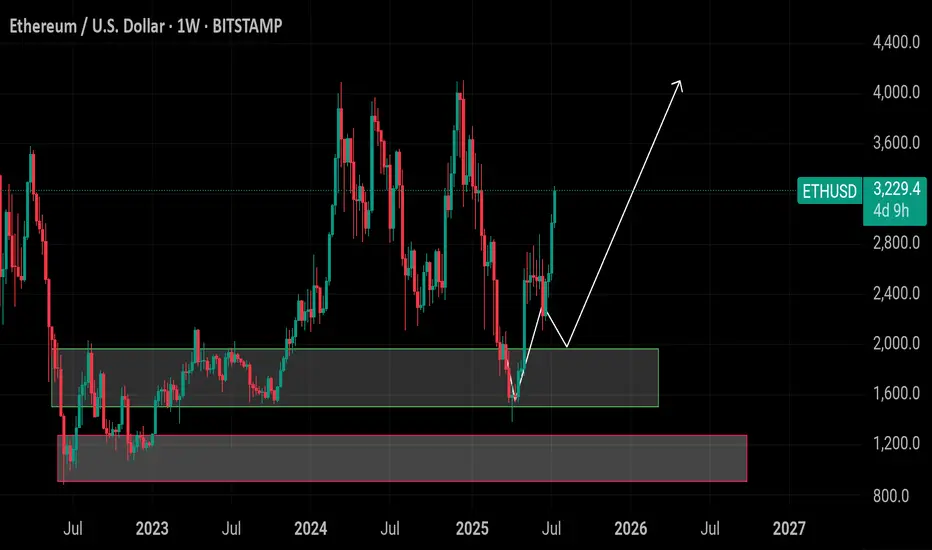
Ethereum $ETH – Perfect Accumulation to Rally Move!
🔸 Ethereum CRYPTOCAP:ETH – Perfect Accumulation to Rally Move!
ETH perfectly hit our long-term buying zone between $1,900 – $1,500, where we accumulated heavily. This range once again acted as a strong demand zone and launchpad.
🔸 Target: $4,000 – $4,500
After hitting our buying range, ETH has now rallied to $3,250 — showing strong bullish momentum. If price continues to hold above $3,000, the next target zone is $4,000 – $4,500.
🔸 Risk Level:
Any breakdown below $2,200 would weaken the structure and shift the bullish outlook. This is our invalidation level on a higher time frame.
🔸 Outlook:
Partial profit-taking around $3,200 – $3,500 zone
Hold remaining positions for $4,000+ targets
Use $2,900 – $3,100 zone for fresh or re-entries on dips
Maintain tight stop loss under $2,200 if adding new exposure
Eth looks ready to meThe range is going to break soon, price looks primed to test 3200 area. Lots of wicks cleared overhead resistance. My plan is to take 25% off at 3200 and let the rest run. I like Eth to hit ATH by around Thanksgiving. On the TD indicator (momentum), eth is hitting green 2s on a lot of bigger timeframes, this is not something that happens too often. Last time i came across such a confluence it was Zoom pre-covid.

SELL ETHUSD for bullish divergence trend reversal STOP LOSS: 3,3SELL ETHUSD for bullish divergence trend reversal STOP LOSS: 3,337
Regular Bearish Divergence
In case of Regular Bearish Divergence:
* The Indicator shows Lower Highs
* Actual Market Price shows Higher Highs
We can see a strong divergence on the MACD already and There is a strong trend reversal on the daily time frame chart.....
The daily time frame is showing strength of trend reversal from this level resistance so we are looking for the trend reversal and correction push from here .....
TAKE PROFIT: take profit will be when the trend comes to an end, feel from to send me a direct DM if you have any question about take profit or anything
Remember to risk only what you are comfortable with........trading with the trend, patient and good risk management is the key to success here...
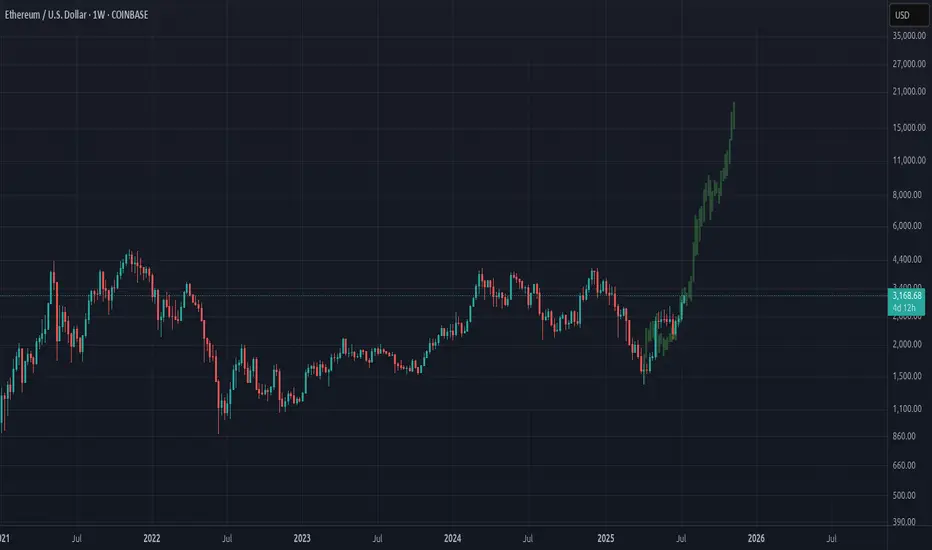
Ethereum LFGFractal from beginning of last cycles bull market. Estimated target $20K by November/December 2025. Significant pull-back around physiological level of $10K in autumn.
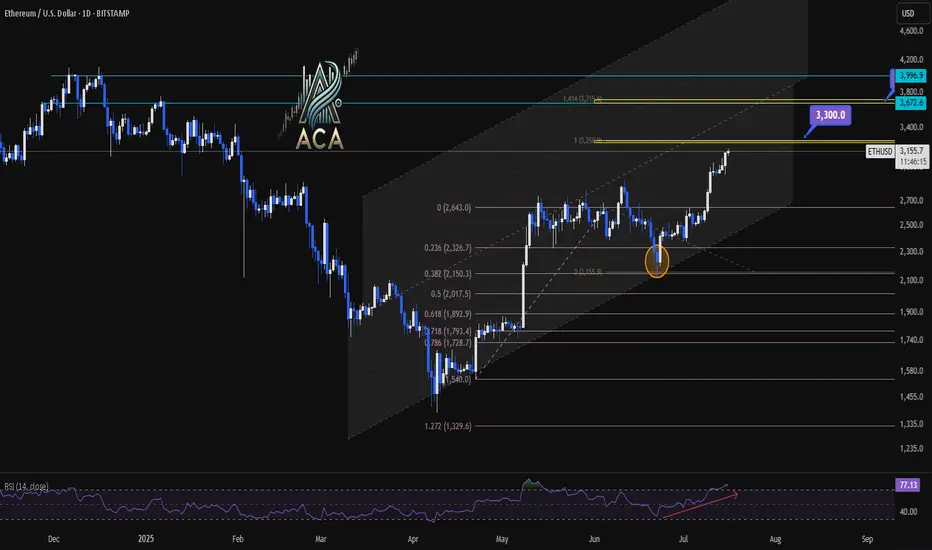
ETHUSDT 1D Chart Analysis | RSI Strength & Fibonacci TargetsETHUSDT 4H Chart Analysis | RSI Strength & Fibonacci Targets in Play
🔍 Let’s break down the latest ETH/USDT setup — bullish momentum is building with confluences pointing toward key upside targets.
⏳ 4-Hour Overview
Ether continues climbing within a well-defined ascending channel, with recent candles holding above mid-level support. Price is pressing higher from a clean bounce at the 0.5 and 0.618 Fibonacci retracement zone ($2,017–$1,899), signaling the correction has likely ended.
📉 Fibonacci Levels & RSI Confirmation
- The strong recovery aligns with rising volume and a bullish structure.
- RSI is pushing into overbought territory (above 73), often a sign of strength during trends—not exhaustion.
- ETH is now positioned for a breakout continuation move if momentum holds.
🎯 Bullish Targets Ahead
- Immediate resistance: $3,300 (1.414 Fib extension + historical supply)
- Next major target: $3,700 (1.618 extension + upper channel confluence)
- Pullback zones: $2,950 (mid-channel) and $2,017 (Fib support base)
📊 Key Highlights:
- Price is respecting the rising channel structure — higher lows, higher highs in play.
- Volume supports the breakout narrative, rising on green candles.
- RSI breakout supports trend continuation, not exhaustion.
- Targets at $3,300 and $3,700 remain actionable on a confirmed breakout.
🚨 Conclusion:
ETH is showing a multi-variable bullish setup with clear continuation potential. A strong move above $3,300 could quickly send price toward $3,700. Pullbacks to $2,950–$2,017 could offer high-risk/reward re-entry zones. Momentum favors bulls — stay alert.
Wrong call!I have absolutely ate shit calling for lower drop couple days ago
Keep in mind, per Elliott Wave this still could be lower high - not that I am rooting for it, just giving possibility here.
Invalidation is the red line

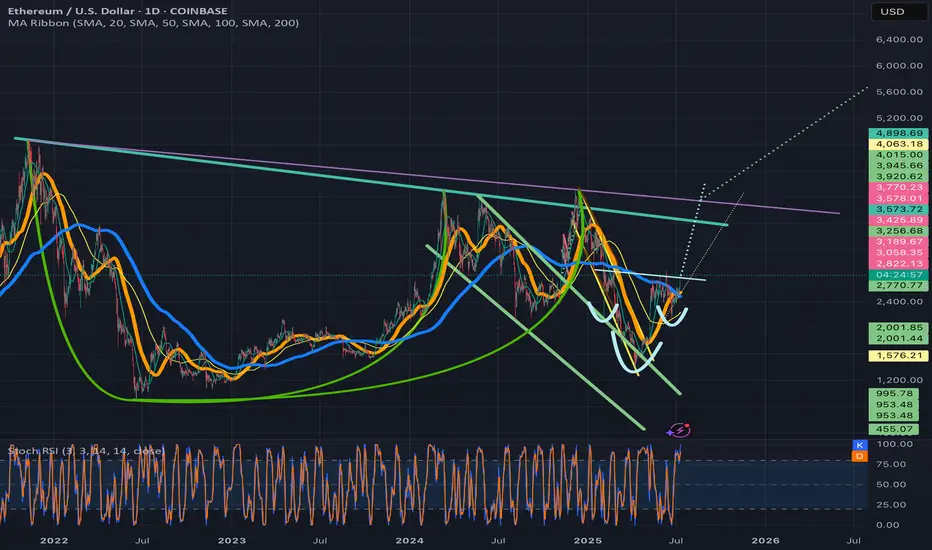
Ethusd breaking above invh&sEthusd chart has a similar set upas the total2 chart, a cup and handle that is breaking up from a smaller inverse head and shoulders that will complete the handle to the cup. Ethereum actually has two potential to trendlines for its cup and handle and I wouldn’t be surprised if both are valid. The breakout target for the inverse head and shoulder pattern will take price action above both of them. Once we solidify the top trendline for the cup and handle patterns as support the breakout target for it is $7161. Ethereum just recently had a golden cross on the daily which adds to the probability the inverse head and shoulder pattern breakout will be validated. *not financial advice*
Short Sell ETHUSD For Swing TradingShort Sell ETHUSD , It looking over bought on daily chart RSI is above 75.
Short Sell at 3160 Stop Loss at 3185 Target at 3120.
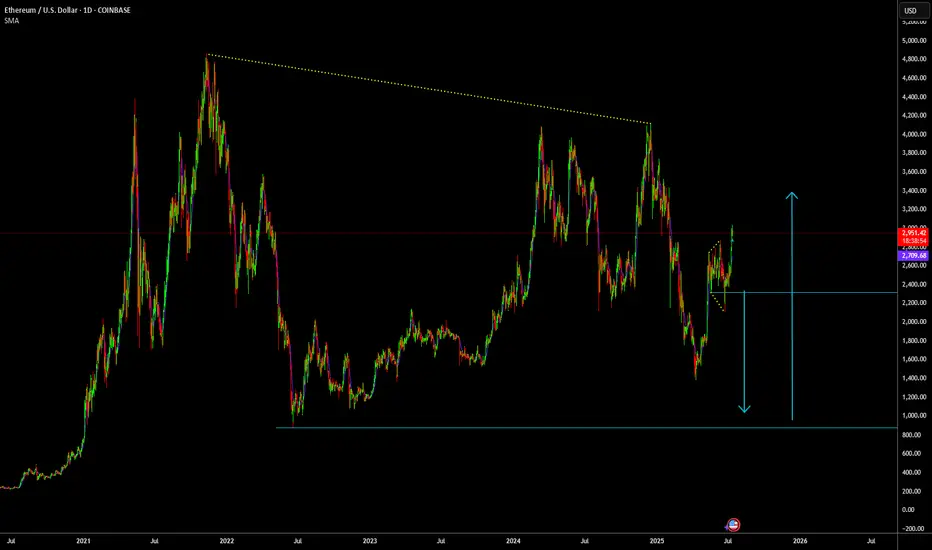
### **Bearish Analysis of Ethereum (ETH)**### **Bearish Analysis of Ethereum (ETH)**
Here is a bearish outlook on Ethereum (ETH) based on current market dynamics, incorporating technical, liquidity, and fundamental factors:
---
### **1. Technical Resistance & Topping Signals**
- **Key Resistance Zone**: ETH has repeatedly tested the **$3,000–$3,080** resistance level but failed to sustain a breakout. If it cannot hold above this range, a pullback toward **$2,865** or even **$2,710** is likely.
- **Daily Chart Topping Pattern**: Some analysts suggest the current rally may form a "daily top." While an immediate reversal is unlikely, the trend could shift to bearish dominance, with potential resistance near **$3,160**.
- **Overbought Risk**: The RSI has exceeded 70, indicating short-term overbought conditions. A loss of momentum could trigger a correction.
---
### **2. Heavy Shorting by Hedge Funds & Basis Arbitrage**
- **Surge in Short Positions**: CFTC data shows hedge funds have amassed **$1.73 billion** in ETH short positions on CME, marking a record high in net leveraged short exposure.
- **Basis Arbitrage Strategy**: Institutions are executing delta-neutral strategies by shorting futures while buying spot ETFs (annualized arbitrage ~9.5%). However, heightened volatility (e.g., a "Black Thursday"-like event) could trigger a short squeeze.
- **Whale Shorting Activity**: High-leverage (4.1x) short positions by whales (e.g., 0xSifu) reflect market skepticism about ETH's long-term competitiveness.
---
### **3. Fundamental Weaknesses**
- **Ecosystem Underperformance**: In 2025, ETH was among the worst-performing top-five crypto assets (down 51% YTD), lagging behind competitors like Solana. DeFi TVL has dropped **43%**, signaling declining user engagement.
- **Staking Risks**: While **29% of ETH is staked**, reducing liquid supply, high staking ratios may constrain market liquidity. A price drop could trigger panic unstaking.
- **Institutional Selling Pressure**: The Ethereum Foundation recently sold **1,206.7 ETH (~$3.6 million)**, fueling concerns about insider divestment.
---
### **4. Market Sentiment & Capital Flows**
- **BTC Dominance Pressure**: Bitcoin’s recent all-time high (**$118,000**) may divert capital away from ETH and other altcoins.
- **Extreme Short Positioning**: ETH’s open interest shows **62% short bias**, the highest since 2021. While this raises short-squeeze risks, it also reflects doubts about the sustainability of the rally.
---
### **5. Key Risks & Outlook**
- **Downside Triggers**:
- A break below **$2,865** could accelerate a drop toward **$2,530**.
- A Fed policy shift or global liquidity tightening.
- Competitors (e.g., Solana) gaining further market share.
- **Potential Reversal Signals**:
- A sustained breakout above **$3,080** may force short covering.
- If the **ETH/BTC ratio** surpasses **0.026 BTC**, an altcoin season could emerge.
---
### **Conclusion**
In the short term, ETH faces headwinds from technical resistance, institutional shorting, and capital rotation into Bitcoin. The bearish thesis holds for now, but extreme short positioning raises the risk of a squeeze. Traders should monitor:
- The **$3,080** resistance and **$2,865** support levels.
- Bitcoin’s market dominance and macroeconomic policy shifts.