ETHUSD POTENTIAL LONGETHUSD potential bullish setup ↗️
ETH still showing bullish momentum. Might bounce on the bullish trend line, for now it’s hasn’t done the third touch so expect it go lower to the trendline first. A strong bullish confirmation would be a signal to go LONG. Share your thoughts on this in comment section.
ETHEREUM trade ideas

ETH Daily: Contracting Triangle Nearing Completion – Downside BrPattern Overview
Textbook five-wave contracting triangle (A-B-C-D-E) fully formed
Price compressed between converging trendlines – coiled spring ready to release
Volume steadily declining into apex – classic pre-breakout signature
Multiple indicators point to downside resolution
Technical Analysis
Elliott Wave Structure
Clean 3-3-3-3-3 corrective sequence confirmed
All waves respect triangle rules: C < A, D < B, E < C
Converging boundaries create pressure for explosive move
Timing Analysis (Neely Method)
Triangles complete within 60-80% of A-to-apex timespan
ETH now sits directly in this critical window
Resolution expected within 4-6 weeks maximum
Price Projection Methods
Largest Wave Rule: Thrust often equals biggest internal leg → Target: $1,350 then $900
Minimum Line Rule: Must exceed lowest triangle point (~$880) for valid thrust
Fibonacci Extension: 0.75-1.25x of C-D height → Extended targets: $750-$300
Key Levels & Targets
Support Break: Pink trendline (see chart)
Initial Target Zone: $1,200-$900
Extended Targets: $600-$300 if momentum builds
Invalidation: Close above upper resistance line
Trading Strategy
Entry: Daily close below rising support line
Target 1: $1,200-$900 (confluence zone)
Target 2: $600-$300 (1.25 fib extension)
Stop Loss: Re-entry into triangle after breakdown
Risk Management: Small position size, use trailing stops, monitor ETF flows
Market Context
Triangle maturity suggests imminent resolution
Volume expansion will confirm breakout direction
Watch for macro catalysts that could accelerate move
ETF decisions and regulatory news remain wildcards
Action Plan
Triangle has exhausted time – breakout window is NOW
Technical evidence strongly favors downside
Wait for clean break with volume confirmation
Prepare for potential cascade to three-digit prices
Stay disciplined – let the market prove the direction

ETH/USDT – 4H Chart AnalysisEthereum is currently trading within a broad consolidation range between $2,387 (support) and $2,657 (resistance) on the 4H timeframe. After a sharp pullback from range highs, price is retesting the mid-range and Fibonacci levels, offering a potential bullish setup.
Trading Plan:
Buy Stop: $2,501 (confirmation of upward momentum)
Stop Loss: $2,363 (below key support zone)
Take Profit 1 (TP1): $2,657 (range resistance)
Take Profit 2 (TP2): $2,853 (projected breakout target
) Key Levels to Watch:
Support Zone: $2,387 – $2,363
Resistance Zone: $2,657 – $2,853
Fib Retracements: 38.2% @ $2,554 & 61.8% @ $2,472
📊 Bias: Bullish above $2,501, caution if price dips below $2,363.
RSI is hovering near 44, suggesting neutral momentum with potential room for upside if buying pressure increases.

#SUI Ready to Grow up?#SUI
The price is moving within a descending channel on the 1-hour frame and is expected to break and continue upward.
We have a trend to stabilize above the 100 moving average once again.
We have a downtrend on the RSI indicator that supports the upward break.
We have a support area at the lower boundary of the channel at 2.83, acting as strong support from which the price can rebound.
We have a major support area in green that pushed the price higher at 2.75.
Entry price: 2.87.
First target: 2.95.
Second target: 3.04.
Third target: 3.14.
To manage risk, don't forget stop loss and capital management.
When you reach the first target, save some profits and then change your stop order to an entry order.
For inquiries, please comment.
Thank you.

ETH/USDT#ETH
The price is moving within a descending channel on the 1-hour frame and is expected to break and continue upward.
We have a trend to stabilize above the 100 moving average once again.
We have a downtrend on the RSI indicator that supports the upward break.
We have a support area at the lower limit of the channel at 2440, acting as strong support from which the price can rebound.
We have a major support area in green that pushed the price upward at 2440.
Entry price: 2500.
First target: 2545.
Second target: 2539.
Third target: 2641.
To manage risk, don't forget stop loss and capital management.
When you reach the first target, save some profits and then change your stop order to an entry order.
For inquiries, please comment.
Thank you.

head and shoulder forming on ETHETH has formed head and shoulder on 1 hr time frame if it decisively breaks 2525 and moves down the expected target of 2415 may be possible this H&S will become invalid if ETH stays above 2575-2585 then we can expect elliot wave 5 on shorter time frame to come into play which would set targets for 2710-2850 extension of wave 5 can be upto 3050....should 2410 be achived then we are looking at deeper correction which will happen on bigger time frame opening possible doors for 1900 levles


ETH could be about to rip into a short-term rallyWhile the stock market has seen surprising upside in the past weeks (presumably due to pricing in rate cuts / a more positive liquidity picture / high expectations for Q2), crypto has lagged behind. I don't believe anything significantly above current prices - no matter in which market - is sustainable for now, but we can certainly milk it for whatever it's worth.
Notably, BTC has shown way more resilience and dominance in the current cycle so far. This makes sense in a high interest environment. However, within the bias of the markets pricing in expectations for rate cuts and as such more liquidity, we could also assume that demand for assets other than "safe havens" would now increase as well, leading us to the biased conclusion that we could see altcoins wildly outperforming BTC over the next weeks.
Indeed, if we look at the BTC chart, technicals such as VWAP stddevs show significantly less potential for upside if compared to ETH in the current moment in time. We therefore would focus on ETH at this point (as money flow seems to cycle BTC->ETH->Others).
PLEASE NOTE: SL and TP are not accurate. This is not a precise trading idea. Please use your own judgement in accordance with your trading style.

Ethereum Trading Strategy: 5:1 Risk-to-Reward Ratio"Ethereum Showing Strength on the 4-Hour Chart — A New Bullish Trend Emerging?"
The 4-hour timeframe is starting to show strong bullish momentum. Could this be the beginning of a new uptrend?
A potential 5:1 risk-to-reward setup is forming:
Entry: 2,620
Stop Loss: 2,364
Target: 4,062
Support 2500 must hold!!!

Ethereum H4 | Falling toward a pullback supportEthereum (ETH/USD) is falling towards a pullback support and could potentially bounce off this level to climb higher.
Buy entry is at 2,519.65 which is a pullback support that aligns with the 23.6% Fibonacci retracement.
Stop loss is at 2,360.00 which is a level that lies underneath a multi-swing-low support and the 50% Fibonacci retracement.
Take profit is at 2,731.45 which is a pullback resistance.
High Risk Investment Warning
Trading Forex/CFDs on margin carries a high level of risk and may not be suitable for all investors. Leverage can work against you.
Stratos Markets Limited (tradu.com ):
CFDs are complex instruments and come with a high risk of losing money rapidly due to leverage. 63% of retail investor accounts lose money when trading CFDs with this provider. You should consider whether you understand how CFDs work and whether you can afford to take the high risk of losing your money.
Stratos Europe Ltd (tradu.com ):
CFDs are complex instruments and come with a high risk of losing money rapidly due to leverage. 63% of retail investor accounts lose money when trading CFDs with this provider. You should consider whether you understand how CFDs work and whether you can afford to take the high risk of losing your money.
Stratos Global LLC (tradu.com ):
Losses can exceed deposits.
Please be advised that the information presented on TradingView is provided to Tradu (‘Company’, ‘we’) by a third-party provider (‘TFA Global Pte Ltd’). Please be reminded that you are solely responsible for the trading decisions on your account. There is a very high degree of risk involved in trading. Any information and/or content is intended entirely for research, educational and informational purposes only and does not constitute investment or consultation advice or investment strategy. The information is not tailored to the investment needs of any specific person and therefore does not involve a consideration of any of the investment objectives, financial situation or needs of any viewer that may receive it. Kindly also note that past performance is not a reliable indicator of future results. Actual results may differ materially from those anticipated in forward-looking or past performance statements. We assume no liability as to the accuracy or completeness of any of the information and/or content provided herein and the Company cannot be held responsible for any omission, mistake nor for any loss or damage including without limitation to any loss of profit which may arise from reliance on any information supplied by TFA Global Pte Ltd.
The speaker(s) is neither an employee, agent nor representative of Tradu and is therefore acting independently. The opinions given are their own, constitute general market commentary, and do not constitute the opinion or advice of Tradu or any form of personal or investment advice. Tradu neither endorses nor guarantees offerings of third-party speakers, nor is Tradu responsible for the content, veracity or opinions of third-party speakers, presenters or participants.

Ethereum: Eyeing New Highs?Ethereum has surged recently and continues rising in turquoise wave B. The next target is a break above the June high, with potential upside to resistance at $4,107. A direct breakout above this level (27% probability) would suggest green wave alt. ended in April. However, our main scenario expects a reversal below $4,107, with turquoise wave C likely dragging ETH into the Long Target Zone between $935.82 and $494.15 to complete wave .
📈 Over 190 precise analyses, clear entry points, and defined Target Zones - that's what we do.

Bearish reversal off major resistance?The Ethereum (ETH/USD) is rising towards the pivot which acts as a pullback resistance and could reverse to the 1st support which is a pullback support.
Pivot: 2,655.32
1st Support: 2,506.53
1st Resistance: 2,820.60
Risk Warning:
Trading Forex and CFDs carries a high level of risk to your capital and you should only trade with money you can afford to lose. Trading Forex and CFDs may not be suitable for all investors, so please ensure that you fully understand the risks involved and seek independent advice if necessary.
Disclaimer:
The above opinions given constitute general market commentary, and do not constitute the opinion or advice of IC Markets or any form of personal or investment advice.
Any opinions, news, research, analyses, prices, other information, or links to third-party sites contained on this website are provided on an "as-is" basis, are intended only to be informative, is not an advice nor a recommendation, nor research, or a record of our trading prices, or an offer of, or solicitation for a transaction in any financial instrument and thus should not be treated as such. The information provided does not involve any specific investment objectives, financial situation and needs of any specific person who may receive it. Please be aware, that past performance is not a reliable indicator of future performance and/or results. Past Performance or Forward-looking scenarios based upon the reasonable beliefs of the third-party provider are not a guarantee of future performance. Actual results may differ materially from those anticipated in forward-looking or past performance statements. IC Markets makes no representation or warranty and assumes no liability as to the accuracy or completeness of the information provided, nor any loss arising from any investment based on a recommendation, forecast or any information supplied by any third-party.

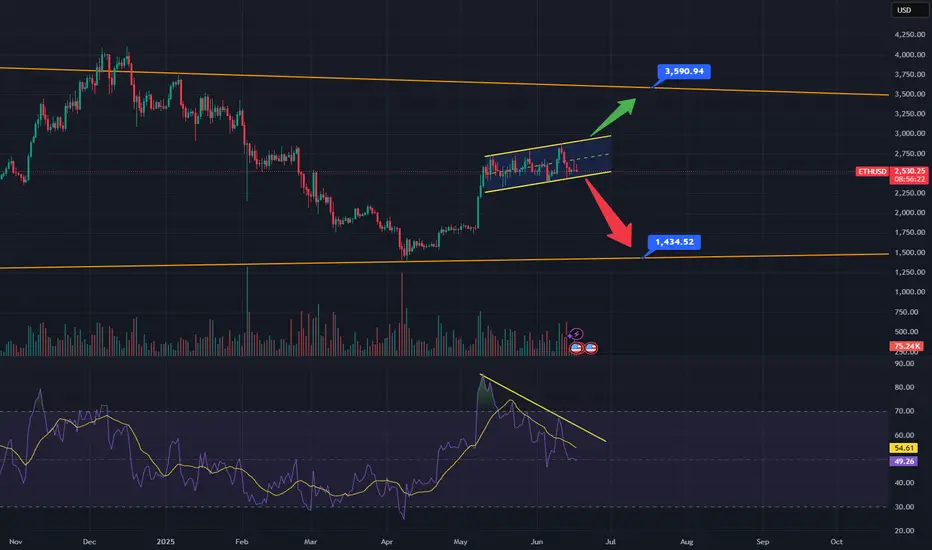
ETH: Breakout or Breakdown?As you can see ETH has been trading inside of this rising channel since the beginning of May. Rising channels favor a break to the downside, I've also highlighted some bearish divergence on the RSI which also points to a move down. The orange lines are long term weekly trend lines. The bottom orange line connects the 2022 lows through to the April lows, if price breaks down, expect a retest of the underside of the channel before moving down to the orange line around $1435. This would only be the third hit and third hits rarely breakdown. If it defies logic and breaks out above, look for it to move up to the top orange line around $3600, which connects the 2021 bull market highs through the march 24', May 24' and December 24' highs. If it comes into this area, it would be a 5th hit of a major weekly trendline, 5th hits have a very high probability of breaking out to the upside, if this happens it would be very bullish. In this scenario I would expect ETH to come down and test the top of said trendline as support before moving to new all-time highs. A Fibonacci retracement from the 2020 lows to the 2021 highs would put new price targets at $6,670 at the -0.382 as well as $7,800 at the -0.618.
Stay above 2600 at all cost !!!Big push up as we all expected; now in 2600. All need is to stay above 2600 at all cost; heres why; if Ethereum stays above 2600 then the bulls will take over and dance around the zone and get to 2800 then lastly 3000. But if it doesnt stays above 2600 then big disappointment will spread around the community.
The most important target is 4000.. the altcoins will skyrocket and the Altseason will start.
Hold on your bags lads

ETHUSD broke the Resistance level 2550.00 range 👀Possible scenario:
Ethereum (ETH) jumped to $2,600, its highest in three weeks, following a 6% surge as firms explore THE for treasury reserves. Despite a 24% YTD drop, analysts see a setup for a breakout to $7,000.
Related stocks rallied: BitMine rose 20%, Bit Digital 6%, and Sharplink Gaming soared 28% after adding $2M in ETH—now holding $485M, per Arkham Intelligence. Ethereum ETFs saw $40 Min inflows, and its backbone role in stablecoins like USDT and USDC boosts long-term appeal. Tokenization growth and Robin hood's tokenized stock rollout add further support.
✅Support and Resistance Levels
Support levels is now located at 2,400.00.
Now, the resistance level is located at 2,620.00.

ETHUSD – Power Rally PausingETH caught an aggressive bid from $2,420 and rallied straight into $2,610 resistance. While the trend is strong, the move was vertical and consolidation is now forming under the highs. Expect a triangle or flag to resolve soon. Watch $2,575 as support — bulls need to defend this to resume upward action.

Ethereum (ETH/USDT) Preparing for a Massive LaunchEthereum (ETH), the second-largest crypto and the backbone of the DeFi ecosystem, is currently trading around $2,599, marking a modest 6.09% rise over the past 24 hours. The latest dip caught the attention of traders and analysts alike, especially as Ethereum recently broke out of a prolonged consolidation range. With renewed interest from institutional players, growing ETF inflows, and long-term holders quietly accumulating, the ETH price reached a critical juncture and is about to break above the barrier.
So, is this just a healthy rise before another pullback or the start of a strong ascending trend?
Ethereum has been testing resistance around the $2,460 to $2,520 range, a zone it has struggled to break convincingly. This level acts as a technical ceiling, with price action repeatedly getting rejected. This has made it a strong resistance zone, but it has been defending the support range around $2100. This suggests the ETH price is building a strong bullish case, which may propel the price to new highs.
The long-term price action looks so impressive as the ETH price has finally risen above the barrier at $2540 and reached $2600. After experiencing major volatility in the past couple of weeks, the upcoming weekly close is expected to unlock the levels not visited since February 2025. On the other hand, the weekly RSI has reached the crucial juncture as it tests the descending trend line and a rise above the levels could validate a rise above the bearish influence.
Besides, the weekly candle is finding its resistance at the 200-day MA at $2,642 and support at the 50-day MA at $2,431; hence, achieving the resistance could push the levels into the pivotal zone between $2,692 and $2,808. Once these levels are cleared, then the Ethereum (ETH) price could reach $3000 and a sustained upswing could elevate the levels to new highs.

$ETH Wave 3 of 3 Underway?CRYPTOCAP:ETH is back into the range EQ as alt coins pump on the back of CRYPTOCAP:BTC breakout
Price caught a strong bid after testing quadruple support: the major High Volume Node (HVN), daily 200EMA, 0.5 Fibonacci Retracement and daily S1 Pivot. Last week I posted about this area holding to kick off wave 3.
There is still work to do to overcome the recent swing high at HVN major resistance but things are certainly looking bullish. The daily pivot point sits at $3150 as the next target.
Long term terminal target for wave 3 is still the R4 daily pivot at $7340, I don't expect the terminal wave 5 to extend much beyond this, perhaps a wick above to trap retail at the top with a lot of media hype attached.
Analysis is invalidated if we fall below wave (2) swing low $2050.
Safe trading

All Time Schiff Pitchfork: ETH to $26k this cycleEthereum’s All-Time Schiff Pitchfork Points to $26,000 Top This Cycle
What if I told you Ethereum’s long-term trajectory already contains the roadmap to its next parabolic peak—and it's hiding in plain sight?
By applying an all-time Schiff Pitchfork to ETH’s historical price action, we uncover a channel of truth that has guided Ethereum’s macro moves since its inception. And according to this structure, the upper bound this cycle sits around $26,000.
Yes, $26K ETH is not only possible—it’s technically aligned.
🧭 Schiff Pitchfork: A Forgotten Tool With Powerful Insight
While traditional pitchforks center around initial anchor points, the Schiff Pitchfork adjusts the median line to better reflect price momentum and curvature over time. For Ethereum, it captures macro cycles and logarithmic price evolution with eerie accuracy.
We anchor the pitchfork as follows:
Point A: March 2020 COVID bottom (~$90)
Point B: May 2021 cycle top (~$4,400)
Point C: June 2022 bottom (~$880)
This sets a median growth trajectory with upper and lower bounds that have so far contained all of Ethereum’s major rallies and retracements.
📈 The Pitchfork Speaks: $26K = Upper Rail This Cycle
The upper boundary of the pitchfork intersects around $26,000–$27,000 between November 2025 and January 2026
This aligns with:
Cycle timing: Ethereum typically peaks ~8 months after Bitcoin
Macro window: Projected end of global liquidity expansion before potential recession
ETF catalyst: BlackRock’s staking ETF + TradFi inflows could supercharge final leg
ETH/BTC breakout zone: Suggests ETH will outperform BTC in the late stage of the cycle
If Ethereum follows the historical path set by prior cycles (2017, 2021), and this channel remains valid, then $26K ETH becomes a technical magnet, not a fantasy.
🧠 Why $26K Isn’t Just a Chart Target
Let’s break down what would justify that kind of valuation:
Factor Supporting Insight
🟢 Staking ETF Institutional demand + ETH supply removed from float
🔥 Deflationary Tokenomics Post-1559 burn + staking = net negative issuance
⚙️ L2 Ecosystem Maturity Rollups, zkEVMs, and restaking create multi-chain ETH demand
🌐 Global Liquidity Window Fed cuts + soft macro conditions = floodgates open
📈 ETH/BTC Ratio Inversion Signals capital rotation to high beta assets
🛑 Risks to the $26K Scenario
Regulatory delays on staking ETF
Broader market crash or macro liquidity crunch
ETH/BTC fails to break out, Bitcoin dominance remains too high
Ethereum scaling and L2 fragmentation cannibalizes fee market faster than expected
🎯 Price Zones on the Schiff Pitchfork
Zone Price Range Interpretation
Lower Bound $3,000–$4,000 Final dip buy zone (if macro spooks)
Median Line $10,000–$14,000 Base case target with ETF flows
Upper Rail $25,000–$26,500 Max cycle top (Q4 2025–Q1 2026)
🧬 Conclusion: The Channel Has Spoken
The Schiff Pitchfork isn’t a magic wand—it’s a map. But Ethereum has respected this structure since 2020, and it’s now approaching the most important confluence zone in its history.
With ETFs, L2 scaling, deflationary supply, and a maturing institutional narrative, ETH has the fundamental firepower to make $26K real—not just chart art.
This may be the final cycle where ETH 4-digit prices are possible.
📊 Follow for more Ethereum macro cycle analysis, ETH/BTC tracking, and altseason models.
📍 Chart available on request—drop a comment if you'd like the TradingView link with Pitchfork drawn
#Ethereum #ETHUSD #PitchforkAnalysis #SchiffPitchfork #CryptoCycles #ETHPrediction #Altseason #ETHChart #ETH26K

ETH Golden Cross | $4k Imminent | Reploy AI $RAI 1000x🚀 Ethereum Just Flashed a Golden Cross: Here’s What Happens Next
(And Why Reploy AI $RAI Could Be the Biggest Beneficiary)
“Golden Cross Confirmed.”
On July 1st, 2025, Ethereum ( CRYPTOCAP:ETH ) officially flashed a golden cross on the daily chart — when the 50-day moving average crossed above the 200-day moving average.
This is one of the most iconic bullish signals in technical analysis.
But here’s why it matters more than ever right now — and why Ethereum and top ETH-based AI tokens like Reploy AI ($RAI) could be about to enter a parabolic end-of-cycle melt-up that sends ETH to $26,000 and select altcoins into four-digit territory.
🟢 A Golden Cross in a Post-Halving Year = Historically Insane Gains
Let’s look at Ethereum’s past golden crosses in post-halving years:
🔹 2017 Golden Cross (May 2020):
Golden Cross: May 21, 2020
ETH Price: ~$200
6 months later: ~$600
Cycle top (May 2021): $4,800+
👉 Result: 24x gain from golden cross to peak
🔹 2021 Golden Cross (April 2021):
Golden Cross: April 6, 2021
ETH Price: ~$2,000
Peak weeks later: $4,400
👉 Result: 2.2x gain in under 2 months
🔹 2024–2025 Cycle:
Bitcoin halving: April 2024
ETH Golden Cross: July 1, 2025
ETH Price at cross: ~$2,500
Based on cycle structure, ETF momentum, and macro liquidity, ETH may now be entering the parabolic wave — with potential upside targets of:
Conservative: $6,800
Base case: $10,000
Extended target: $15,000
Euphoric melt-up: $26,000 by Sept/Oct 2025
That’s a 7.6x from the golden cross price of $3,400 — in line with past post-halving dynamics when ETH caught fire late in the cycle.
⚙️ Why This Time Could Be Even Bigger
ETH ETF Approval Incoming: Ethereum staking ETFs are expected to receive SEC approval this summer — mirroring the wave of inflows that sent BTC surging in Q1.
Global Liquidity Wave: We're in a bull steepening regime, where long yields rise and capital flows into high-risk, high-growth sectors. Crypto and AI are direct beneficiaries.
ETH = Infrastructure for AI + Finance: Ethereum is now the backbone for AI protocols, DeFi 2.0, RWA tokenization, and next-gen gaming. It’s no longer “just a smart contract chain” — it’s programmable digital oil.
🤖 The Next Wave: ETH AI Alts Like Reploy AI ($RAI)
If ETH runs to $10K… then $15K… then $26K, what happens to Ethereum-native microcaps with direct exposure to the AI megatrend?
That’s where Reploy AI ($RAI) enters the chat.
🔬 Why $RAI Could Ride ETH’s Parabolic Wave to a 1000x
Reploy AI is an ETH-native AI infrastructure project powering on-chain AI inference — a critical building block for decentralized machine learning and model execution.
With only 10M tokens in circulation and a market cap under $10M, $RAI offers hyper-convex upside in a rising ETH + AI environment.
Here's the math:
RAI at $0.68 → $6.80 (10x)
RAI at $0.68 → $34+ (50x) if ETH and AI narratives run together
RAI at $0.68 → $68+ (100x) at just a $1B market cap
But let’s take it further…
💥 RAI to $1,000? The 1,000x Moonshot Math
If ETH goes to $26,000, AI mania kicks in, and RAI captures the narrative as Ethereum’s AI execution layer, a $10B valuation is not unthinkable.
That would price $RAI at:
$1,000 per token
1,470x return from $0.68
Still below the all-time highs of meme coins with zero utility
Why this could happen:
✅ AI hype peaking into Q3/Q4 2025
✅ ETH flying past all-time highs — dragging up native alts
✅ Ultra-low float creates reflexive price explosions
✅ $RAI integrated into major on-chain AI pipelines
✅ Top-tier exchange listings + retail narrative momentum
✅ Cycle tops often produce irrational, vertical moves — this is where 1,000x lives
🧠 Bottom Line
Golden crosses mark the start — not the end — of historic runs. And in crypto, when a golden cross hits post-halving, it often unleashes the most explosive phase of the cycle.
With ETH flashing that signal at $3,400, and the $26,000 target within reach by September–October, this could be the last calm before the supercycle storm.
And if ETH goes vertical, ETH-native AI tokens like Reploy AI ($RAI) will move even faster — possibly rewriting the script on what’s possible for microcaps.
$RAI at $0.68 → $6.80 (10x)
→ $34+ (50x)
→ $68+ (100x)
→ $1,000 (1,470x) — the wild but real scenario
Golden Cross is in. ETH is ascending.
Reploy AI is the 1,000x sleeper hiding in plain sight.

ETHERIUM LONG FOR TARGET 3000ETH has fallen from its recent high of 2879 to present levels of 2184 it has formed an anti butterfly pattern this is a good demand zone we can expect an up move from here targets and stop loss mentioned on the chart

ETH H&S Pattern ?ETH H&S Pattern ?____ Who knows_______
Will the end of this year be crypto bullish year ? DCA brother.

ETH/USD (Ethereum to US Dollar) on the 1-hour timeframe. ETH/USD (Ethereum to US Dollar) on the 1-hour timeframe.
Here’s a quick breakdown of what’s visible:
There is an Ichimoku Cloud indicator on the chart.
A resistance zone is marked at the top (around $2,540 – $2,550).
A support zone appears around $2,440 – $2,460.
There's a bullish arrow pointing toward the resistance zone, suggesting an expected upward movement.
🎯 Target:
Based on the chart setup and your markup:
Short-term bullish target (Take Profit): $2,545 – $2,550
Entry zone appears to be: Around $2,460
Stop loss (if managing risk): Below $2,430
This setup looks like a range play or breakout attempt, betting on ETH bouncing off support and retesting resistance.
.
