ETH is moving within the 2495.00 - 2735.00 range👀 Possible scenario:
Ethereum (ETH) is showing strength after a 6.3% jump to $2,712 on May 27. If it holds above $2,600, analysts see potential for a breakout toward $3,000–$3,400. Despite trading sideways most of May, ETH is up nearly 48% in Q2 and 98% from April lows. It’s attempting to break out of a symmetrical triangle after failing to surpass its recent high of $2,738. ETH is up 47.8% in Q2 but still down 19% YTD. While technicals look strong, risks remain: network fees have plunged, and leveraged trades caused losses in 8 of 10 recent price surges.
SharpLink Gaming (SBET) boosted sentiment with a $425M ETH treasury, buying 120,000 ETH—backed by Ethereum co-founder Joe Lubin. The move mirrors MicroStrategy’s BTC strategy and could tighten ETH supply.
✅ Support and Resistance Levels
Support level is now located at 2,495.00.
Now, the resistance level is located at 2,735.00.
ETHEREUM trade ideas

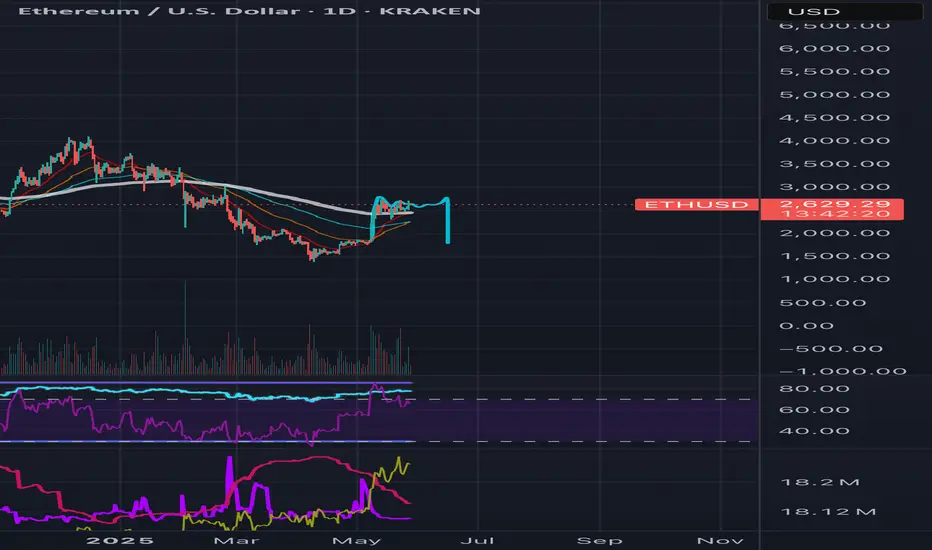
Ethereum Hits Major Resistance – Is a Drop to $2K or Even $1.5K Ethereum has just tagged a key supply zone (highlighted in blue), and price is showing early signs of rejection. This area has historically been a strong resistance zone where previous rallies lost steam.
📊 Market Snapshot:
Rejection from the $2,600–$2,650 supply area.
Bearish wicks forming near the top — signs of buyer exhaustion.
Lower highs on momentum indicators.
---
🔻 Possible Retracement Levels:
1. $2,070.72 – Previous structure resistance, now a key support level.
2. $1,524.06 – Strong demand zone (historical bounce area + high volume node).
🟥 Red arrows show logical pullback zones that could offer re-entry or profit-taking opportunities.
---
📅 Macro Events to Watch:
Major U.S. economic data and Fed announcements (noted near early June) could trigger volatility. ETH is sensitive to macro sentiment, especially with rates and inflation decisions.
---
🧠 Trading Plan:
🔸 Short-Term Bearish Bias: If ETH fails to break and hold above $2,650 with volume, we could see a deeper correction.
🔸 Bullish Invalidation: Clean breakout and hold above $2,700 would shift bias back to bullish.
---
👇 What’s Your Move?
Are you expecting a breakout above resistance or preparing for a pullback? Drop your thoughts and charts below. Let’s collaborate and grow together 💬
📌 Follow me for more crypto trade setups, price action updates, and macro-driven analysis!
#Ethereum #ETHUSD #CryptoAnalysis #PriceAction #SupplyAndDemand #TechnicalAnalysis #CryptoTrading #Altcoins #EthereumPrice #ETHUpdate #ETHBreakout #ETHCorrection
---

Possible Bart SimpsonWith the global economic pressures and with Bitcoin likely close to the end of its bull run, Eth could be forming a Bart Simpson pattern, leading to a rapid reversal/retreat. Although US sentiment towards crypto remains strong and Bullish global inflation means retail investors do not have the capital to invest and push Eth to a new ATH.
ETHUSD Trade Recap – +20R Hit ETHUSD Trade Recap – +20R Hit
As shared in my analysis yesterday, ETH played out perfectly.
🎯 Target was hit with precision
🔒 Executed with a tight stop-loss
📈 Final result: +20R gain
This trade was driven by structure, order flow confirmation, and disciplined execution. No guesswork — just clean setup + reaction + follow-through.
Thank you to everyone who followed the analysis. On to the next setup 👊
#ETHUSD #Crypto #TradeRecap #SmartMoney #OrderFlow #PriceAction #DisciplinePays #20R #TradingViewCommunity

Ethereum setup signals next altcoin surgeEthereum is forming an ascending triangle, hinting at a potential breakout. This setup isn’t as tight as the last one that delivered a 20x return, but it could trigger a wave across altcoins. We break down the key levels, risk to reward, and what to watch next.
This content is not directed to residents of the EU or UK. Any opinions, news, research, analyses, prices or other information contained on this website is provided as general market commentary and does not constitute investment advice. ThinkMarkets will not accept liability for any loss or damage including, without limitation, to any loss of profit which may arise directly or indirectly from use of or reliance on such information.

ETHUSD long - prebreakout formationI am seeing a 'pre-breakout buildup' on ETHUSD. Price is being carried by the 50ema for extended periods. The preceding trend before this sideways movement was bullish (so is bitcoin). There is a squeeze in progress, and we are seeing consistently higher lows.
I see this PA as a high probability breakout potential in the next week or so.

ETH - Going ParabolicMinimum 6k, followed by more!
Disclaimer: These are not trading signals. Trade at your own risk!

Ethereum - The bottom is finally in!Ethereum - CRYPTO:ETHUSD - is starting the rally:
(click chart above to see the in depth analysis👆🏻)
Finally, after dropping an expected -65% over the past couple of months, Ethereum is retesting and already rejecting a significant horizontal structure. Together with the strong confluence of support, Ethereum is now creating a long term bottom, initiating the next bullish cycle.
Levels to watch: $2.000, $4.000
Keep your long term vision!
Philip (BasicTrading)

ETH 2025: $3000 is Key to Escaping Ethereum's Consolidation TrapEthereum (ETH) May Remain Consolidated Throughout 2025 if it Fails to Hit $3000: Here’s Why!
May 27, 2025 – Ethereum (ETH), the world's second-largest cryptocurrency, finds itself at a critical juncture. After a period of significant volatility and notable gains, ETH's price has entered a prolonged consolidation phase. While numerous bullish signals point towards a potential surge, a formidable barrier stands at the $3000 mark. Failure to decisively conquer this level could see Ethereum locked in a sideways trading pattern throughout much of 2025, deferring hopes of a new explosive bull run. This article delves into the intricate factors dictating Ethereum's price trajectory, exploring the tug-of-war between bullish aspirations and the stubborn realities of market resistance.
Section 1: The Current State of Ethereum - A Prolonged Consolidation
As of late May 2025, Ethereum continues to trade within a defined range, struggling to make a sustained break in either direction. The price has been attempting to pierce pivotal resistance zones, with recent attempts this month failing to hold despite decent volume. Some market observers note that Ethereum is currently consolidating between the $2,400 and $2,750 range. This period of consolidation is not unusual in cryptocurrency markets, often representing a "breather" after significant price movements or a period of price discovery as market participants digest new information and sentiment.
Historical chart patterns suggest that Ethereum may have entered a crucial price range, an "accumulation zone," which could prevent a significant breakout for several months. Certain technical indicators, which help identify trends when growth rates fluctuate, show ETH price entering bands that have historically preceded consolidation periods, sometimes lasting nearly a year, before the next major bullish wave. Given that ETH has already consolidated for approximately four months, another similar period could be on the horizon if key resistance levels are not breached.
This consolidation is a focal point for investors and analysts alike. On one hand, it can be seen as a period of building strength before the next upward move. On the other, prolonged consolidation can lead to investor fatigue and a potential drift lower if bullish catalysts fail to materialize. The market is currently in a state of anticipation, closely watching for signals that could indicate the end of this sideways movement. Ethereum's price is currently hovering in the mid-$2,500s, recovering slightly after brief consolidation and respecting key support levels.
Section 2: The $3000 Hurdle - A Critical Inflection Point
The $3000 level for Ethereum is more than just a number; it represents a significant psychological and technical barrier. A decisive break above this level would likely instill strong bullish sentiment, potentially paving the way for further gains towards previous highs and beyond. Conversely, a repeated failure to surmount $3000 could confirm the strength of the resistance, leading to a loss of upward momentum and an extended period of consolidation throughout 2025.
Market sentiment often coalesces around such round numbers. A breakthrough can trigger a fear of missing out, attracting fresh capital. Failure, however, can lead to disappointment and profit-taking, reinforcing the consolidation range. As of May 2025, ETH is expected by some to trade between $2,400 and $2,900, with a monthly close above $2,750 strengthening the case for retesting $3,000 in the coming quarter. Some projections suggest ETH might hover near the $3000 resistance in the summer months, potentially seeing profit-taking before a new range is established. If ETH fails to rise above the ascending trend line it has held since mid-2022, and with technicals like a potential bearish "Death Cross" (where a shorter-term moving average crosses below a longer-term moving average on weekly charts), the price could remain restricted below $2500 for a while, making the $3000 target even more challenging in the near term.
Section 3: Bullish Signals Amidst Consolidation - The Hope for a Breakout
Despite the consolidation, several bullish signals offer hope for an eventual breakout and a more dynamic 2025 for Ethereum.
Altseason Hopes
The term "altseason" refers to a market phase where alternative cryptocurrencies (altcoins) experience significant price surges, often outperforming Bitcoin. Ethereum, as the leading altcoin, plays a crucial role in signaling or even triggering such a season.
Recent technical analysis suggests that Ethereum has reclaimed a key technical level – the mid-line of a significant channel indicator on the two-week chart. This moving average-based band tracks long-term momentum. Historically, closing above this mid-line has preceded sharp price gains for ETH and marked the start of altseasons. For instance, after surpassing this mid-line in 2020-2021, ETH rallied dramatically. A similar pattern in late 2023 saw ETH climb significantly within a year. As of May 2025, the upper band of this channel represents the next significant resistance. A breakout above this could target previous cycle highs.
The impact on the broader altcoin market has also been historically significant. The combined market cap of altcoins (excluding ETH) surged considerably over a year after Ether's close above this channel's midline in past cycles. Some analysts suggest that ETH reaching certain key levels could signal the potential onset of an alt season.
Bitcoin Dominance and Altcoin Market Cap
The prospect of a 2025 altseason is further supported by patterns related to Bitcoin dominance – Bitcoin's market share of the total crypto market capitalization. Historically, after Bitcoin halvings, Bitcoin dominance tends to drop sharply, triggering altcoin rallies. This was observed in previous post-halving periods. With the latest halving in April 2024, a similar period is approaching, and a decline in Bitcoin dominance could occur within the next few months. If this trend repeats, some market observers anticipate the altcoin market cap could surge toward substantially higher figures. A falling Bitcoin dominance implies that capital is shifting from Bitcoin to altcoins, making them the market's primary focus.
Technical Formations
Several bullish technical patterns are currently visible on Ethereum's charts:
• Ascending Triangle: Ethereum's price action has been forming an ascending triangle pattern, characterized by a horizontal resistance level and a rising support line. This pattern typically indicates that buyers are gaining strength, pushing prices to higher lows against a flat resistance. A breakout above the horizontal resistance of this pattern could lead to a significant upward move.
• Inverse Head and Shoulders: Some analysts have identified an inverse head and shoulders pattern on daily trading charts, a classic bullish reversal pattern. The neckline of this pattern is cited around the $2,700 mark. A decisive close above this level could confirm the breakout, with an immediate target of $3,000.
• Bull Flag: On the daily chart, Ethereum appears to be forming a bull flag pattern, which is a bullish continuation pattern that typically follows a strong rally. The current sideways price action forms the flag, and a breakout could lead to a significant price increase.
• Bullish Market Structure: Despite the consolidation, the broader market structure for Ethereum can still be interpreted as bullish, with the potential for consecutive higher highs and higher lows to remain intact if key support levels hold. ETH trading above its key Exponential Moving Averages (EMAs) indicates a strong technical structure.
Analyst Sentiment
Market observers are cautiously optimistic, with many eyeing the $3,000 level as the next major milestone. Some predict that if Ethereum stays above $2,550, a breakout toward higher levels is likely in the near term. Holding above $2,500 is seen as crucial. If bullish momentum persists and broader crypto sentiment remains favorable, ETH could target the $4,000–$4,500 range later in 2025. Institutional interest, evidenced by spot Ether ETFs attracting inflows and Ethereum's growing market capitalization, also underpins a positive outlook.
Section 4: The Bearish Undertones - Risks and Fragility
Despite the array of bullish signals, Ethereum's path is not without significant obstacles and inherent fragilities.
Substantial Supply Near Cost Basis
A concerning factor highlighted by on-chain data is the substantial amount of Ethereum supply acquired near the current price levels. Analysis of blockchain data indicates that a very large volume of ETH supply, valued in the tens of billions of dollars, is near its cost basis and at risk of flipping into a loss if prices dip. This creates a precarious situation. If ETH's price were to fall below these investors' average acquisition price, it could trigger a wave of selling as holders try to minimize losses or break even. This sell-side pressure could exacerbate any downward trend or prolong the consolidation phase. There is also a significant cluster of investor cost-basis distribution around the $2,800 price level, implying potential sell-side pressure as ETH approaches this zone from investors looking to offload assets near breakeven.
Stubborn Resistance Levels
Ethereum is currently coiling under significant resistance. The $2,700 level has proven to be a formidable barrier, with ETH facing rejections multiple times in May. This level represents a key hurdle for bulls. Failure to convincingly break above $2,700, and subsequently $2,800 and the ultimate $3,000 target, could see selling pressure intensify. Each failed attempt can strengthen the perception of these levels as a ceiling, encouraging more traders to sell at these points.
Macroeconomic and Market-Wide Factors
The broader cryptocurrency market is susceptible to macroeconomic headwinds. Factors such as interest rate policies from central banks, regulatory developments, and global economic stability can significantly impact investor sentiment and capital flows into riskier assets like cryptocurrencies. While some anticipate potential interest rate cuts later in 2025 which could be bullish, ongoing quantitative tightening could pose a challenge. Bitcoin's dominance, while potentially set to fall, has also surged in early 2025, overshadowing altcoins for a period and reflecting a "risk-off" environment at times. Any negative shifts in these broader conditions could dampen Ethereum's breakout prospects, regardless of its specific technical or on-chain signals.
Section 5: Why Failure to Hit $3000 Could Mean Extended Consolidation in 2025
The $3000 mark is a critical psychological and technical threshold for Ethereum. Should the cryptocurrency fail to breach this level decisively in the coming months, several factors could contribute to an extended period of consolidation throughout 2025.
• Loss of Upward Momentum: A failure to achieve a widely anticipated price target like $3000 can significantly dampen investor enthusiasm. Bullish momentum is often self-reinforcing; when it stalls at a major resistance, the energy can dissipate, leading to a more cautious or bearish sentiment. Traders who bought in anticipation of a breakout might exit their positions, adding to selling pressure.
• Strengthening of Resistance: Each time a price level like $3000 (or even preceding levels like $2,700-$2,800) successfully repels an upward advance, it becomes a more established and psychologically potent resistance zone. More market participants will view it as a ceiling, placing sell orders around it, thus making future breakouts even more difficult.
• Capital Rotation: If Ethereum's price remains stagnant while other cryptocurrencies or asset classes show more promising returns, capital may flow out of ETH. Investors are constantly seeking the best risk-adjusted returns, and a prolonged consolidation in ETH could lead them to look for opportunities elsewhere in the dynamic crypto space or even in traditional markets.
• Investor Fatigue and Profit-Taking: Extended periods of sideways movement can lead to investor fatigue. Those who have been holding ETH through the consolidation might become impatient and decide to sell, either to lock in existing profits (if any) or to free up capital for other ventures. This is particularly true for the significant portion of supply bought near current price levels, where the desire to break even can lead to selling pressure if upward momentum wanes.
• Confirmation of Historical Patterns: As mentioned earlier, historical chart patterns suggest that Ethereum can enter extended consolidation phases before major bull runs. A failure to break $3000 would align with these historical precedents, suggesting that the market might indeed be settling in for a longer period of range-bound trading.
• Impact on "Altseason" Narrative: Ethereum's performance is often seen as a bellwether for the broader altcoin market. If ETH struggles to break key resistance and enter a clear uptrend, it could delay or diminish the prospects of a widespread "altseason," further contributing to a more subdued market environment for ETH itself.
Essentially, a failure at $3000 would signal that the current buying pressure is insufficient to overcome the selling interest at that level. This equilibrium could persist for an extended period, leading to the price oscillating within a defined range as bulls and bears remain in a deadlock. Until a significant catalyst emerges – be it a major network upgrade with immediate perceived value, a shift in macroeconomic conditions, or a surge in institutional demand that overwhelms sellers – Ethereum could find itself tracing a path of consolidation through 2025.
Section 6: Scenarios for 2025
Looking ahead, Ethereum's trajectory in 2025 largely hinges on its ability to overcome the current consolidation and the critical $3000 resistance. Several scenarios could unfold:
Scenario 1: Breaching $3000 and Igniting a Bull Run
This is the optimistic scenario favored by many ETH proponents.
• The Breakout: Ethereum successfully smashes through the $2,700-$2,800 resistance zone and then decisively conquers the $3000 psychological barrier. This breakout would likely be accompanied by a surge in trading volume, confirming strong buying interest.
• Targets: Once $3000 is overcome, analysts eye targets such as $3,200, $3,500-$3,600, and previous cycle highs around $4,100. Some even more bullish long-term predictions based on chart patterns suggest significantly higher targets if momentum is sustained.
• Altseason Trigger: A strong ETH rally, particularly one driven by reclaiming key technical levels, could indeed trigger a wider altseason. This would see significant capital flow into other altcoins, potentially leading to a massive altcoin market cap surge if Bitcoin dominance concurrently falls.
• Market Sentiment: Overall market sentiment would turn decisively bullish, fueled by positive price action and the realization of long-awaited breakouts. Institutional interest would likely further increase.
Scenario 2: Failure at $3000 and Continued Consolidation Throughout 2025
This scenario represents the central thesis of this article – a prolonged period of sideways trading.
• The Rejection: Ethereum makes attempts to break $3000 (or even struggles to consistently hold above $2700-$2800) but is repeatedly met with strong selling pressure. The price fails to establish a sustained uptrend above these key levels.
• Trading Range: ETH would likely continue to trade within a familiar range, potentially bounded by support levels around $2,300-$2,500 and resistance capping gains below $3000. This range could persist for a significant portion of 2025.
• Investor Sentiment: Investor sentiment would likely become mixed and potentially frustrated. While long-term believers might continue to accumulate, shorter-term traders could become disengaged due to a lack of volatility and clear direction. The "wait-and-see" approach would dominate.
• Impact on Altcoins: A stagnant Ethereum could dampen enthusiasm for a broad altseason, leading to more selective and narrative-driven gains in the altcoin market rather than a widespread euphoric rally.
Scenario 3: A Bearish Breakdown
While many signals are bullish or neutral (consolidating), a bearish breakdown remains a possibility, especially if broader market conditions deteriorate or if key supports fail.
• Support Failure: Key support levels, such as $2,450, $2,300, or even the psychological $2,000 mark, are breached decisively. This could be triggered by the large supply near cost basis flipping into loss and causing a cascade of selling.
• Negative Catalysts: This scenario could be exacerbated by negative macroeconomic news, stringent regulatory actions, or unforeseen issues within the Ethereum ecosystem.
• Price Action: A bearish breakdown would see Ethereum enter a downtrend, potentially revisiting lower support levels from previous market cycles. Technical indicators like a "Death Cross" on weekly charts, if confirmed, would add to bearish sentiment.
• Market Sentiment: Fear and uncertainty would grip the market, leading to a flight to safety, possibly increasing Bitcoin dominance or a move towards stablecoins.
•
The most probable outcome will depend on a confluence of technical breakouts, fundamental developments within the Ethereum ecosystem (like the impact of future upgrades), institutional adoption trends, and the overarching macroeconomic environment.
Section 7: Conclusion
Ethereum stands at a pivotal moment in May 2025. The allure of a significant rally towards $4,000 and beyond, potentially heralding a new altseason, is palpable, supported by historical precedents and bullish chart patterns. However, the path is fraught with challenges, most notably the formidable psychological and technical resistance clustered around the $2,700 to $3,000 levels.
The current consolidation phase, while potentially a healthy accumulation period, also carries the risk of morphing into prolonged stagnation if upward momentum cannot be decisively seized. The significant volume of ETH supply hovering near its cost basis presents a tangible threat, where a dip could trigger further selling pressure, reinforcing the consolidation or even leading to a decline.
Therefore, the central thesis holds considerable weight: should Ethereum fail to convincingly breach the $3000 mark in the coming months, it is highly plausible that the cryptocurrency could remain locked in a consolidative pattern for much of 2025. This would test the patience of investors and potentially delay the much-anticipated fireworks of a full-blown altseason.
The cryptocurrency market is notoriously dynamic and influenced by a myriad of unpredictable factors. While technical analysis and on-chain data provide valuable insights, they are not infallible crystal balls. Investors and traders must remain vigilant, continuously reassessing the evolving landscape, managing risk, and preparing for various potential outcomes as Ethereum navigates this critical juncture. The battle for $3000 will likely define ETH's narrative for the remainder of the year.

(ETH/USD) Short Setup – May 27, 2025Currently watching ETH/USD as it taps into a key liquidity and supply zone around $2,713.
📍 Trade Idea:
Looking to sell in the red zone after an extended rally. This area aligns with:
Prior structural resistance
Strong impulse move into overhead liquidity
Volume spike + signs of possible exhaustion
🔍 Confirmation:
I’ll execute this trade only if order flow confirms (buyers trapped, sellers stepping in).
Watching closely for:
Absorption at the top
Reversal candle structure
Shift in momentum / volume imbalance
🎯 Target:
Green zone below – this aligns with a previous value area and inefficiency that price may seek to fill.
⚠️ Risk:
Tight stop-loss, accepting small risk for high potential reward (R:R ~22R)
Invalidation occurs if price breaks above the red zone with strength and sustained volume.
This is a reaction-based short setup — not a blind entry. I’m waiting for price to show signs of rejection before entering.
This idea is shared for educational purposes only. Not financial advice. Trade your plan and manage risk accordingly.
#Ethereum #ETHUSD #CryptoTrading #ShortSetup #PriceAction #VolumeProfile #OrderFlow #SmartMoney #TradingStrategy

ETH/USD short Setup🚨 ETH/USD Weekly Outlook 🚨
Ethereum is tapping into the $2,689–$2,692 weekly supply zone 🔼—a key resistance area! If it gets rejected here, brace for potential drops to $2,497, $2,397, and the big one: $2,231 🎯📉
🔧 Technical Bias: Bearish after supply tap 🔻
📉 Targets: 2497 → 2397 → 2231
🧠 Fundamentals: Rate hike fears 📈 + Altcoin weakness 😬
👀 Eyes on the chart—ETH might be gearing up for its next big move down! 🚦💣
#ETH #Ethereum #CryptoAnalysis #SupplyZone #BearishSetup #ETHUSD #TradingView #CryptoBreakdown #MarketWatch #TechnicalAnalysis #forex #gold

ETHUSDETHUSD has printed potential HH so i will make a buy limit entry using FIB at 0.382 leve(2617) With SL of 2510 and TP 2724 the risk on this trade is 0.3%

Be careful with ETH !!!Currently, ETH is forming an ascending triangle, indicating a potential price increase. It is anticipated that the price could rise, aligning with the projected price movement (AB=CD).
However, it is crucial to wait for the triangle to break before taking any action.
Give me some energy !!
✨We spend hours finding potential opportunities and writing useful ideas, we would be happy if you support us.
Best regards CobraVanguard.💚
_ _ _ _ __ _ _ _ _ _ _ _ _ _ _ _ _ _ _ _ _ _ _ _ _ _ _ _ _ _ _ _
✅Thank you, and for more ideas, hit ❤️Like❤️ and 🌟Follow🌟!
⚠️Things can change...
The markets are always changing and even with all these signals, the market changes tend to be strong and fast!!

ETHUSD INTRADAY bullish trend supported at 2,360Trend Overview:
Ethereum (ETH/USD) remains in a bullish trend, underpinned by a sequence of higher lows and a well-defined rising structure. Recent intraday price action reflects a consolidation phase, likely forming a bullish continuation pattern within the prevailing uptrend.
Key Technical Levels:
Support: 2,360 (primary), followed by 2,160 and 2,090
Resistance: 2,750 (initial), then 2,930 and 3,130
Technical Outlook:
A corrective pullback toward 2,360, which aligns with a prior consolidation zone, may offer a buy-the-dip opportunity. A successful retest of this level could set the stage for a continuation toward 2,750, 2,930, and 3,130 over the medium to long term.
However, a confirmed break and daily close below 2,360 would invalidate the near-term bullish outlook, increasing the risk of a deeper correction toward 2,160 and 2,090.
Conclusion:
ETH/USD continues to show bullish momentum as long as it holds above the 2,360 support level. A rebound from this zone would likely confirm the ongoing consolidation as a base for further upside. A breakdown below 2,360, however, would shift the short-term bias bearish, exposing Ethereum to deeper downside risk.
This communication is for informational purposes only and should not be viewed as any form of recommendation as to a particular course of action or as investment advice. It is not intended as an offer or solicitation for the purchase or sale of any financial instrument or as an official confirmation of any transaction. Opinions, estimates and assumptions expressed herein are made as of the date of this communication and are subject to change without notice. This communication has been prepared based upon information, including market prices, data and other information, believed to be reliable; however, Trade Nation does not warrant its completeness or accuracy. All market prices and market data contained in or attached to this communication are indicative and subject to change without notice.

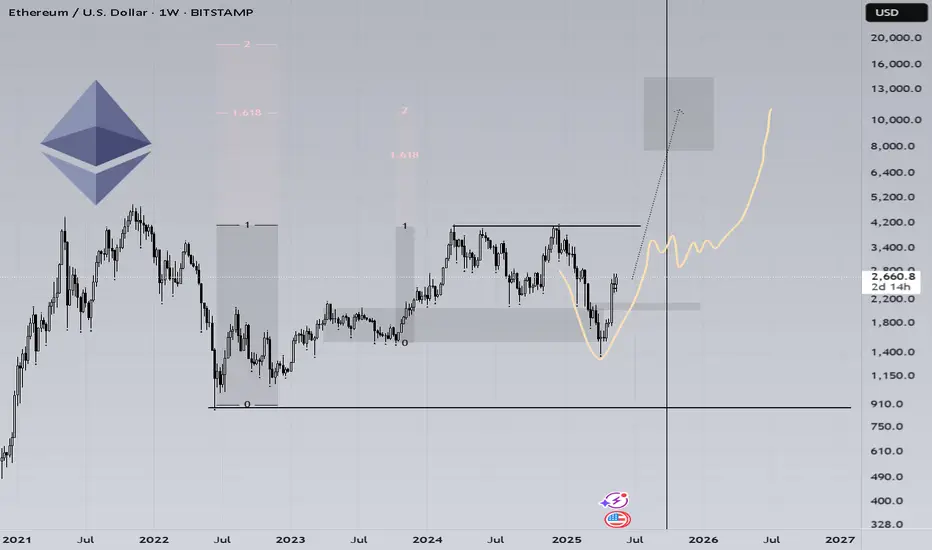
ETH 10 000$ soonAs for me, the fractial is the same)
Flashcrash in the preles of accumulation, the same good fast V-shaped reversal. BTC made 1.6 and 2 fib level, if copy paste it on ETH, it could be 10k$ easily. The dominance on the TOP, ETH/BTC on historical bottom. The cyclicality of the cryptocurrency market persists.
I would like to see June growth, going sideways at higher values closer to August. And starting in the fall to make the final movement.
They’re still laughing at $ETH.They’re still laughing at $ETH.
But the chart is screaming bullish.
Multi-year base + clean pennant = launch setup.
$8,000 is just the beginning.
Don’t fade it.

ETHEREUM FINAL PUMP INCOMINGETHEREUM FINAL PUMP INCOMING
The breakout is in.
Every cycle, CRYPTOCAP:ETH breaks ATH… then goes vertical.
This time won’t be different.
Don’t fade the final pump.

ETHEREUM FINAL PUMP INCOMINGETHEREUM FINAL PUMP INCOMING
The breakout is in.
Every cycle, CRYPTOCAP:ETH breaks ATH… then goes vertical.
This time won’t be different.
Don’t fade the final pump.

ALTCOIN ROADMAP: REVISITED!!! Ethereum vs NvidiaOne of the most insightful ratio charts that provides a remarkable glimpse into the vitality of Altcoins and the appetite for risk is when Ethereum outshines one of the fastest rising stars in the stock market, #NVDA!
The conventional Altcoin index indicates how many of the top 100 Altcoins are outperforming #BTC.
This is indeed a valuable metric that we can rely on for identifying peaks.
However, I believe that if we broaden our perspective and examine the ETH ratio against a Tech Titan, we can truly pinpoint the timing of the banana zone. When it starts and when it is confirmed violent uptrend.
My interest in this ratio was sparked when ETH was still a proof of work coin, validated through GPUs; it seemed like a natural starting point to assess whether the ETH price was overvalued or undervalued.
Even after the transition to POS, I still think it’s worth analysing, as shown by the recent double bottom on the ratio!
The next crucial question is when we can break the multi-year downtrend to genuinely confirm the Banana zone. Because without ETH, there’s no party.
If we enter a big strong banana zone, I believe the ratio could swiftly trend towards 100, so we will be keeping a close eye on it!

ETH weekly consolidationETH currently trading in a weekly balance range. Looking like some bullish consolidation for a major move up back to 4k. Idea may take some more time to play out, but the longer it takes, the better the move. ETH to $4000

H&S should lead the breakout Very simple but the dip inside Head and shoulders or buy near the breakout formation.
Ethereum should finally tise and break Resistance #1 and reclaim 2585 then lastly to break above 2650 #2 Resistance

ETH/USD_ CUP AND HANDLE FORMATION ON 4H Chart This chart displays a classic "Cup and Handle" pattern forming on the Ethereum (ETH/USD) 4-hour timeframe. The pattern suggests a bullish continuation setup following a strong upward trend. The cup is smoothly rounded, indicating consolidation after an uptrend, while the handle shows a brief downward channel before breakout. The price has approached the resistance zone, and a breakout above it could confirm the pattern, signaling bullish momentum. The Ichimoku cloud also supports potential upside movement as the price is breaking through it, adding confluence to the bullish setup.
Entry: 2535
Target Points:
1st Target: 2700
2nd Target: 2800
3rd Target: 2900

Ethereum H4 | Approaching a swing-low supportEthereum (ETH/USD) is falling towards a swing-low support and could potentially bounce off this level to climb higher.
Buy entry is at 2,364.35 which is a swing-low support.
Stop loss is at 2,250.00 which is a level that lies underneath an overlap support.
Take profit is at 2,693.55 which is a multi-swing-high resistance.
High Risk Investment Warning
Trading Forex/CFDs on margin carries a high level of risk and may not be suitable for all investors. Leverage can work against you.
Stratos Markets Limited (tradu.com ):
CFDs are complex instruments and come with a high risk of losing money rapidly due to leverage. 63% of retail investor accounts lose money when trading CFDs with this provider. You should consider whether you understand how CFDs work and whether you can afford to take the high risk of losing your money.
Stratos Europe Ltd (tradu.com ):
CFDs are complex instruments and come with a high risk of losing money rapidly due to leverage. 63% of retail investor accounts lose money when trading CFDs with this provider. You should consider whether you understand how CFDs work and whether you can afford to take the high risk of losing your money.
Stratos Global LLC (tradu.com ):
Losses can exceed deposits.
Please be advised that the information presented on TradingView is provided to Tradu (‘Company’, ‘we’) by a third-party provider (‘TFA Global Pte Ltd’). Please be reminded that you are solely responsible for the trading decisions on your account. There is a very high degree of risk involved in trading. Any information and/or content is intended entirely for research, educational and informational purposes only and does not constitute investment or consultation advice or investment strategy. The information is not tailored to the investment needs of any specific person and therefore does not involve a consideration of any of the investment objectives, financial situation or needs of any viewer that may receive it. Kindly also note that past performance is not a reliable indicator of future results. Actual results may differ materially from those anticipated in forward-looking or past performance statements. We assume no liability as to the accuracy or completeness of any of the information and/or content provided herein and the Company cannot be held responsible for any omission, mistake nor for any loss or damage including without limitation to any loss of profit which may arise from reliance on any information supplied by TFA Global Pte Ltd.
The speaker(s) is neither an employee, agent nor representative of Tradu and is therefore acting independently. The opinions given are their own, constitute general market commentary, and do not constitute the opinion or advice of Tradu or any form of personal or investment advice. Tradu neither endorses nor guarantees offerings of third-party speakers, nor is Tradu responsible for the content, veracity or opinions of third-party speakers, presenters or participants.
