ETH - The Generational Opportunity Mere Months AgoMore of a hindsight than any prediction, though I believe alts and particularly ETH are going much higher still.
Buy when fear is peaked and blood on the streets. I posted tweeted over and over to buy when ETH when to it's lows in 2025. It was an absurd selloff probably manufactured to give funds and institutions a better entry, but the lagging ETH price action won't continue. Cat is out of the bag.
ETHEREUM trade ideas
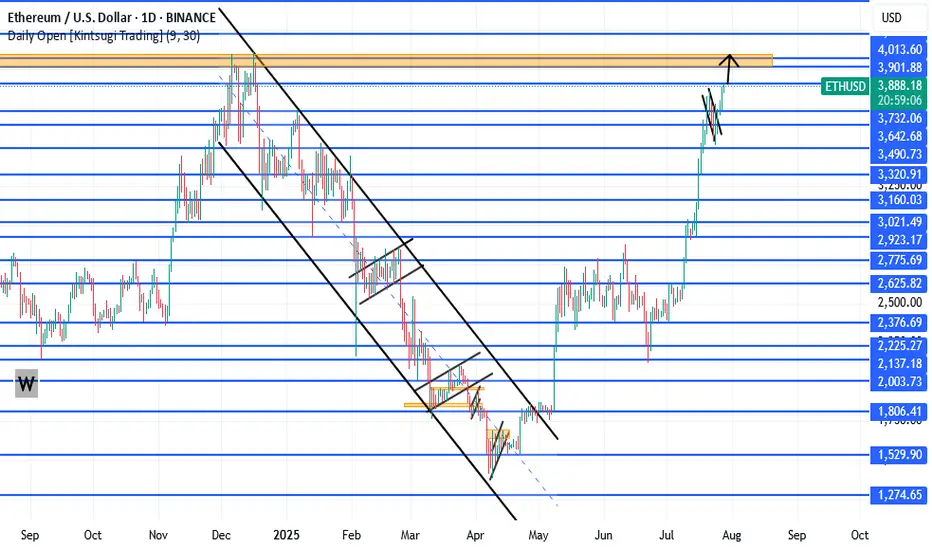
Ethereum - Finally new all time highs!🔬Ethereum ( CRYPTO:ETHUSD ) will break out now:
🔎Analysis summary:
For more than four years, Ethereum has overall been moving sideways. However now Ethereum is once again retesting previous all time highs and preparing a bullish breakout. Multiple retests are generally considered bullish so the breakout is very likely to happen any time soon.
📝Levels to watch:
$4.000
🙏🏻#LONGTERMVISION
SwingTraderPhil

ETHUSD has formed a bearish bat patternOn the daily chart, ETHUSD formed a bearish bat pattern. The first downside target is around 3193, and the second downside target is around 2782.

Strategic Long Position on Ethereum (ETH)
Ethereum's funding rates have spiked, reflecting an overcrowded long side. Such conditions often precede a long squeeze, as the market seeks to shake out overleveraged traders.
Despite this risk, the current bullish momentum justifies a tiered entry approach:
First Entry (Market Order): 3,790
Second Entry (Limit Order): 3,550
🛑 Stop Loss (for both entries): 3,400
🎯 Take Profit Target: 4,200
This setup allows participation in the upward trend while leaving room


ETHUSD: Bearish Divergence + Double TopHi everyone!
Ethereum – Double Top with Bearish Divergence
On the 4H chart, ETH is forming a clear double top while MACD prints a strong bearish divergence, signaling momentum loss.
📉 Neckline: $3,500 – this level acts as the key trigger.
🔻 Target: $3,000 – aligns with the 0.618 Fibonacci retracement and previous demand zone.
A confirmed break below $3,500 would validate the pattern and open the way to a deeper correction into the $3,000 area. As long as price stays under the second top, the bearish setup remains active.

ETH SELL SETUP ,Sold From 3853ETH SELL SETUP
Currently $3853
Sold From 3853
(Trading plan ETH go up to $3920
will add more shorts)
Expecting target $3780 OR DOWN
In the event of an early exit,
this analysis will be updated.
Its not a Financial advice

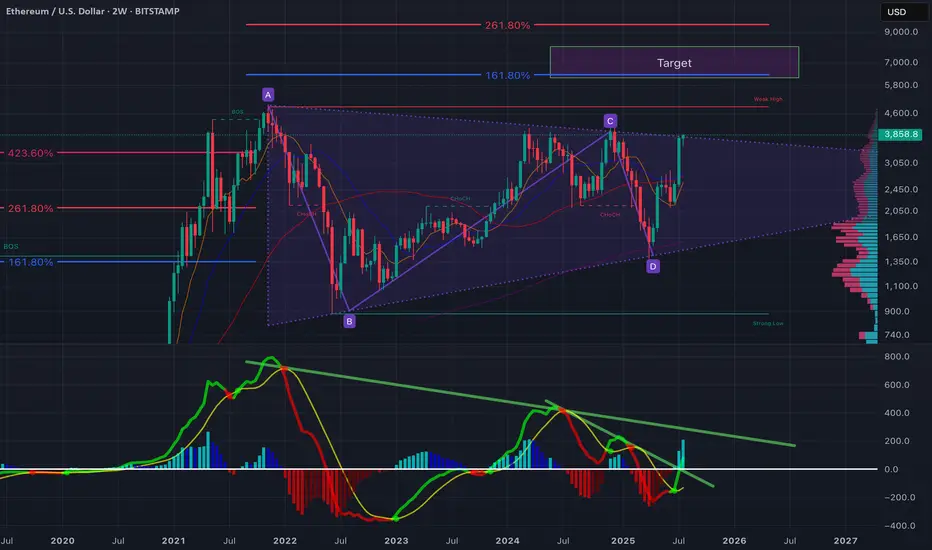
$ETH - Nothing has changedEthereum is showing a significant breakout setup after years of consolidation within a large symmetrical wedge structure (A–B–C–D pattern). The price has just tested the upper boundary of the wedge, and momentum indicators suggest a potential mid-term bullish continuation.
Key Observations:
ABCD Harmonic Structure: Price has respected the harmonic range with D forming a strong higher low near $1,500–$1,600, showing buyer absorption at key demand levels.
Fibonacci Confluence:
The 161.8% extension aligns with ~$5,800, forming the first major target.
A 261.8% extension pushes towards ~$7,000, aligning with the marked "Target" zone.
Volume Profile: Heavy accumulation between $1,500–$2,500 with low resistance above $4,000 suggests a breakout could accelerate quickly.
MACD/RSI Divergence: The momentum oscillator shows a triple bullish divergence (higher lows on momentum vs. lower lows on price), and the downtrend line on the MACD histogram has been broken—often a precursor to sustained upside.
Moving Averages: The 50/100 EMA crossover on the 2-week chart is imminent, historically a strong macro signal.
Bullish Scenario:
A clear close above $4,000 confirms wedge breakout.
Short-term targets: $4,600 (weak high) and $5,800 (Fib 161.8%).
Macro target: $7,000+ if bullish momentum holds through Q4.
Bearish Risk:
Failure to hold $3,500 could lead to retests of $2,500 or even $2,000 (mid-wedge support).
Watch for macroeconomic shocks (rate cuts, liquidity shifts) which have previously caused retracements in crypto markets.
What’s next?
ETH is approaching a make-or-break moment. If the breakout holds, this could be the start of the next major leg up. A strong weekly close above $4,000–$4,200 is critical for validation.
ETH/USD Double Bottom with Bullish RSI Divergence 1HETH/USD has formed a double bottom pattern on the 1 -hour timeframe , signaling a potential bullish reversal after recent downside pressure. The pattern is supported by a bullish RSI divergence, where price made lower lows but RSI printed higher lows — indicating a momentum shift.
A buy stop entry is placed just above the neckline, targeting a continuation toward key resistance zones.
Trade Setup
Buy Stop Entry: 3539.52 (on confirmed neckline breakout)
Stop Loss: 3424.13 (below second bottom – invalidation level)
Take Profit 1: 3658.19
Take Profit 2: 3774.71

Ethusd $2500 I suspect may be the last dipTechnical analysis on ethusd .
Whilst everyone is bullish from current level, my technicals is telling me $2500 region which is key for upward movement or a break makes it want to go lowet

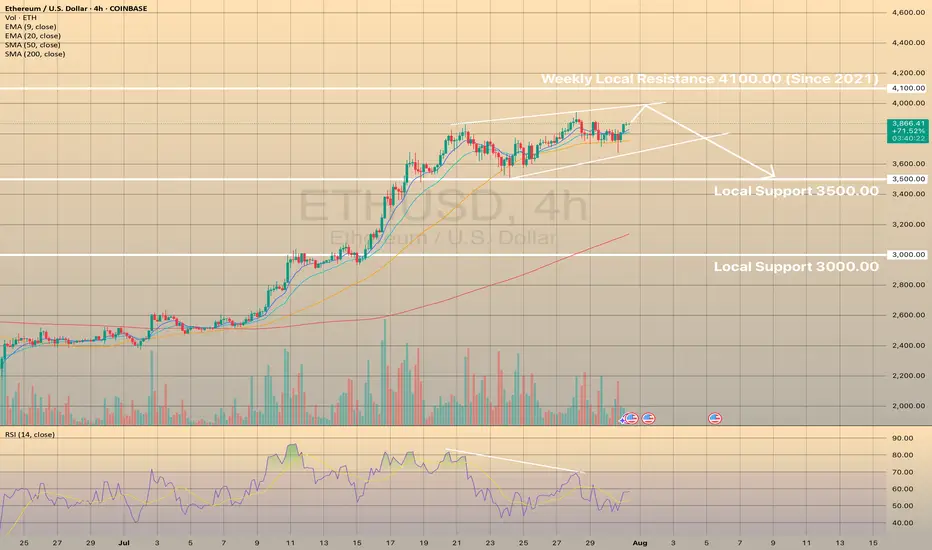
ETHUSD MAY FORM THE BEARISH WEDGE. THE PRICE IS GETTING READY TOETHUSD MAY FORM THE BEARISH WEDGE. THE PRICE IS GETTING READY TO DROP.
ETHUSD has been moving bullish since July 8. However since July 21 the price started to form the bearish wedge with bearish divergence on RSI on 4-h timeframe.
A bearish wedge is a bearish reversal pattern in an uptrend, where the price forms higher highs and higher lows within converging upward trendlines, signaling weakening bullish momentum and a potential downward reversal. To trade, identify the wedge with declining volume and confirm with RSI or divergence. Sell or short on a breakdown below the lower trendline with a volume spike. Set a stop-loss above the recent high or upper trendline. Target the wedge’s height projected downward from the breakdown or the next support level with a 1:2 risk-reward ratio.
We expect that the price will establish another bullish momentum and the price will go towards upper border of the wedge, slightly below the 4,100.00 resistance level and will decline towards 3,500.00 support level afterwards.
ETH Breakout and potential bullishness expected for a monthETH has broken out from downtrend and market sentiment has turned bullish overall. So it is expected to go up until it reaches 4000$ (70%) where a long term resistance is found.
Any further bullishness post 4000$ depends on future market conditions and price action at that point of time, as it is a long term resistance which would be more difficult to break.
Fibonacci retracement is used to find potential temporary selloffs in this up move. This move could potentially end the medium term bearish sentiments in ALT Coins.
Note: For educational purposes only. DYOR before investing or trading.

Eth next target (T2)As anticipated, my bearish T1 target (red) was hit soon after I first posted this chart on July 23rd 2025.
As the arrow indicated, Eth would bounce from my bearish T1 (red) to my bullish T1 (green). This has been confirmed in both price and in the timeframe indicated by my boxes.
There was also a downward arrow from my green T1 pointing towards my bearish T2 (red). Eth is already retracing from my top target, and I belive it will now continue down the red channel towards T2 and possibly T3 (between $2990 - $3200)

Continuous Bullish MovementETH has been rallying upward since 8th may 2025 and is expected to continue moving upwards past 3890.09 all the way to 4101.04 before a re accessing the potential move.
The main reason for this is because the price level of 4101.09 was first hit on march 11th 2024,the second touch(even being that there was one on 6th march and another on 16th forming an M formation) i chose to count it as one.
the third touch will be when price hits our interest level of 4101.09, thus either giving a sell signal or price will break through that level to the upside.
ETH ANALYSIS💲💲 #ETH is trading between support and resistance area. There is a potential rejection again from its resistance zone and pullback from support zone. If #ETH breaks the major resistance zone then we would see a bullish move
Ethereum Breakdown Imminent: Bearish Triple Tops confirmedEthereum has fired off multiple bearish signals that traders and investors cannot ignore. A confirmed triple top on the daily chart suggests exhaustion at resistance, while the appearance of a hanging man candlestick pattern adds weight to the reversal thesis.
The daily RSI has confirmed a bearish divergence, and the MACD has officially crossed below the zero line—marking a shift in momentum and confirming bearish control.
In this video, I’ll break down:
• The triple top formation and its implications
• Why the 200 EMA is the next major support target
• The significance of RSI and MACD confirmations
• What traders should watch for in the coming sessions
This isn’t just noise—Ethereum’s technicals are flashing red. Make sure you’re prepared.

ETH VS AI?Hi
Asked AI on the next movement ETH
Predicted Target = 4 847
Time Projection 20 days → 15 Aug 2025
Probability (%) Attenuation × 100 = 183.6 %
Variance vs. Today (Target) 4 847 − 3 507 = 1 340
Projected Retracement Price 3 886 − 599 = 3 287
Variance vs. Today (Retrace) 3 287 − 3 507 = −220
All the best
Caveat emptor
Not a guru

DaxPrime: BlackRock Exec Move Signals SharpLink’s $1.3B ETH ShifIn a development that is drawing attention across both institutional finance and the crypto ecosystem, a senior executive from BlackRock’s digital assets division has transitioned to SharpLink Gaming — a rising Ethereum whale and sports betting infrastructure player now managing over $1.3 billion in ETH-based assets. At DaxPrime, we see this move not as an isolated career shift but as a strategic signal of deepening convergence between traditional asset management and Web3-native businesses.
The Move: From Wall Street to Web3 Execution
According to sources familiar with the matter, BlackRock’s former Head of Digital Asset Strategy, Daniel Wexler, is joining SharpLink Gaming as its Chief Digital Officer. Wexler played a critical role in shaping BlackRock's crypto ETF initiatives and oversaw early-stage partnerships with Ethereum ecosystem projects.
His transition comes at a time when SharpLink — originally focused on B2B sports betting technologies — has evolved into a key player in decentralized infrastructure, integrating smart contracts, Layer-2 analytics, and tokenized in-game markets. The company currently holds over $1.3 billion in Ethereum, making it one of the largest corporate ETH holders in the entertainment-tech sector.
DaxPrime’s View: Strategic Talent Realignment
At DaxPrime, we interpret this as more than just a personnel update. It reflects a broader realignment where institutional talent is gravitating toward firms that offer speed, flexibility, and a native role in the decentralized economy.
“The move illustrates a trend we’ve tracked since early 2024: legacy finance professionals are increasingly pivoting toward operational roles in Web3-native companies, particularly those with real assets and strong ETH exposure,” says Michaela Strobel, Senior Analyst at DaxPrime.
SharpLink’s use of Ethereum spans beyond treasury holdings. The firm is building proprietary smart contract infrastructure for real-time sports data feeds, NFT-linked fantasy games, and decentralized betting protocols — signaling a broader use-case than speculative ETH storage.
Ethereum as a Strategic Asset
Wexler’s decision also underscores Ethereum’s growing importance as a corporate strategic asset, not merely an investment vehicle. Ethereum’s programmable layer and widespread developer adoption make it the backbone of emerging digital business models — including SharpLink’s.
DaxPrime’s July 2025 ETH Treasury Index reveals that more than 18 publicly listed firms now hold over $500 million in Ethereum each, compared to just five a year ago. This uptick is particularly concentrated in sectors like digital media, AI-gaming convergence, and decentralized finance tooling.
“Ethereum’s shift from an investment to infrastructure asset is well underway,” Strobel notes. “Wexler’s move brings boardroom-grade credibility to a company operating deep within that transformation.”
What It Means for Investors
For investors, this move signals two critical developments:
Institutional Validation of Web3 Business Models: Wexler’s transition lends credence to firms building around Ethereum-based infrastructure, rather than just speculating on token prices.
New Pathways for ETH Utility: SharpLink’s planned integration of ETH staking, yield strategies, and decentralized oracles into its sports gaming vertical could set new standards for how consumer-facing platforms leverage blockchain.
DaxPrime’s Conclusion
The decision by a senior BlackRock executive to join an Ethereum-native company like SharpLink Gaming is not a one-off anomaly. It reflects a rapidly maturing industry where the center of gravity is shifting from financial speculation to operational integration.
At DaxPrime, we continue to monitor executive movements as a leading indicator of sector confidence and capital rotation. As Ethereum evolves from “store of value” to “platform for value,” such strategic appointments signal where the smart money is going — and what the next phase of crypto utility will look like.
Inverse head & shoulderPossibility by today or early hours GMT, this inverse head & shoulder can play play out, hitting the $4k mark.
Also a possibility is a correction after hitting potentially what is ATH, at which point a correction will come before ETH moves above the ATH towards the end of year bull run, 25/26.

ETHEREUM Resistance Ahead! Sell!
Hello,Traders!
ETHEREUM is trading in a strong
Uptrend and the coin has grown
By more than 70% since the last low
So the coin is locally overbought
And after it retest the horizontal
Resistance of 4100$ we will be
Expecting a local bearish correction
Sell!
Comment and subscribe to help us grow!
Check out other forecasts below too!
Disclosure: I am part of Trade Nation's Influencer program and receive a monthly fee for using their TradingView charts in my analysis.

ETHUSD: Multi-Scale LevelsResearch Notes
Price is getting close to connected tops (after which rejections happened).
If we scale out, there is larger narrative Giving vital points of reference.
The dynamics look like part of various progressions at the same time. For example, to answer why price grew from sub-2k levels in the first place, I would pay attention to how it had been falling. Even if price breaks above white line, the ongoings cycle still inherits the prolonged timing.
Interconnection of levels with structural significance:
⬩At smaller scale, fibonacci channel adjusted to the angle of the first small cycle
⬩Scaling out the structure from previous cycle to relate to the levels of local scope.
⬩The final frame of reference covers the case where price expands breaking domestic range.

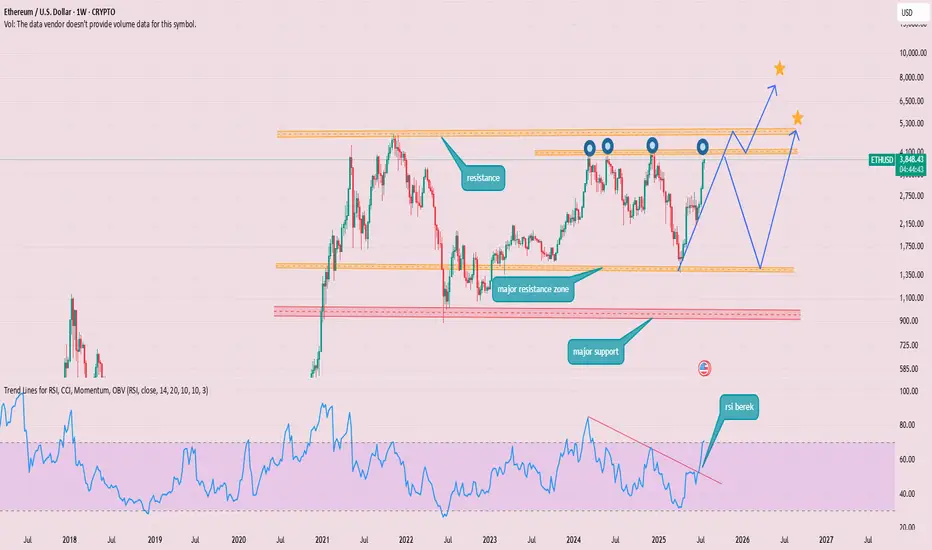
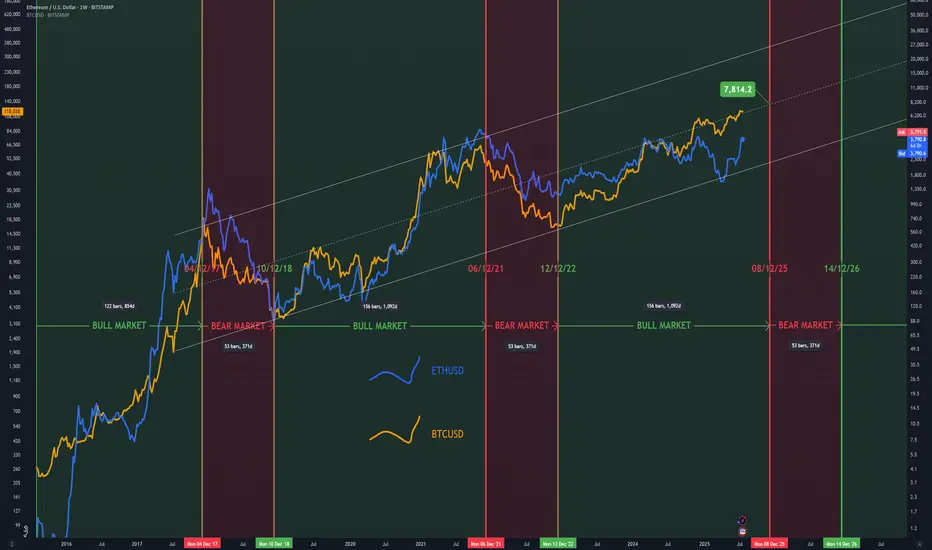
Realistic ProjectionThis is the more realistic approach for the Bull Cycle. Using both ETHUSD and BTCUSD and using their BEAR and BULL durations, this provides us with a December peak, with ETHUSD topping at the middle of the channel in the $7.5-8k range.
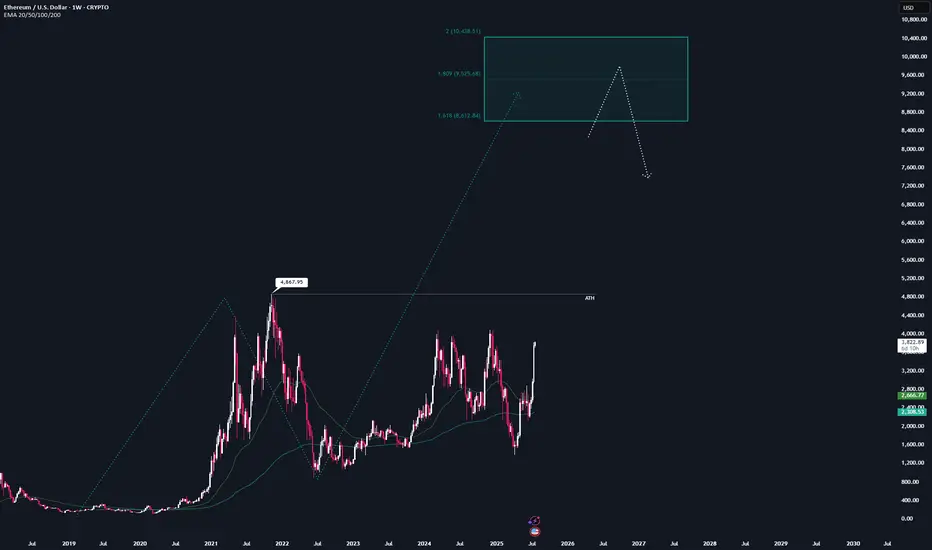
ETH - FULL top-to-bottem AnalysisHere is the full analysis for CRYPTOCAP:ETH as requested 🫡
Weekly Time-frame:
We currently have one potential bullish structure for this cycle, which could take ETH into the $8,600–$10,400 price range.
This sequence gets activated once we break the all-time high at $4,867.
That area also marks my maximum target for this cycle — anything beyond that is pure maga FOMO, and I’m not going to gamble on some “super cycle” narrative.
At the weekly level, I wouldn’t recommend making additional buys in the current price range.
If you're still sidelined at this point, you should honestly reflect on your positioning this cycle — we’ve been given plenty opportunities to enter at good prices.
Daily Chart:
Around 1.5 weeks ago, we finally broke through the major resistance at $2.8k, which has been the key level to watch for the past two years.
That breakout also activated a bullish structure, targeting the $4,500–$5,100 range — which aligns with new all-time highs.
However, a retracement before reaching the target zone is always possible, and any pullback should be viewed as a gift for long entries.
I’ll be placing 4 long orders at each Fib level within the orange B–C retracement zone, each with a stop-loss just before the next level.
The key resistance to watch now is around $4k — once we break above that, hitting the target zone becomes highly likely.
Local price action:
Currently, no valid structures can be identified on the lower timeframes.
However, if valid bearish structures appear on the 1H or 4H charts, I’ll consider them for hedge short opportunities.
Summary:
All in all, waiting is the best strategy right now.
I wouldn’t recommend buying in this region anymore — and it's still too early for valid short setups.
Hope this analysis was helpful for at least one person ❤️
Thanks for reading,
Cheers!