ETHUSD News Over / 30 minutes time frame Bullish Trade
Mange risk Always chart explains trade plan well
ETHEREUM trade ideas

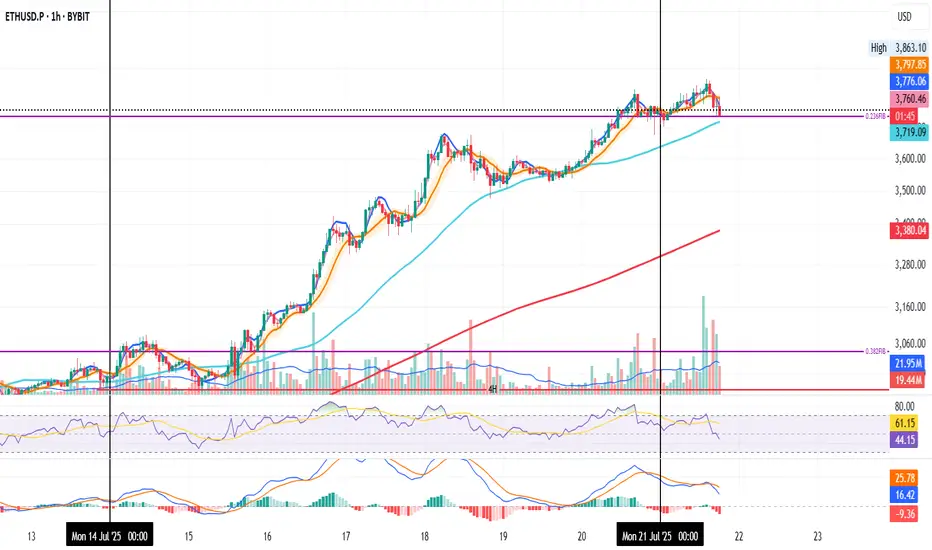
ETH on the 1H and the 0.236 Fib level
Could be a retest. Could be a fakeout. Could be the start of a move down.
RSI and MACD are both dropping.
SMA < MLR < BB Center confirms a downtrend.
50MA is sitting below the Fib level.
200MA is far below at $3,400, but rising quickly.
If tonight’s candles start closing under the Fib level, the warning gets louder.
If not, more upside remains likely.
Always take profits and manage risk.
Interaction is welcome.
Ethereum (ETH/USD) Chart AnalysisEthereum (ETH/USD) Chart Analysis
**Trend Overview:**Ethereum (ETH/USD) Chart Analysis
* The chart shows **strong bullish momentum**, with Ethereum maintaining an upward trend of **higher highs and higher lows**.
* The price is currently around **\$3,618**, well above the key moving averages:
* **EMA(7): \$3,610**
* **EMA(21): \$3,539**
* **EMA(50): \$3,419**
**Support Levels:**
* The recent pullback found support at the **\$3,570–\$3,600 zone**, which is now acting as a **key horizontal support**.
* Below this, **EMA 21 (\$3,539)** and **EMA 50 (\$3,419)** offer additional dynamic support zones.
* Marked support areas **S1 and S2** also highlight previous breakout zones that could act as strong demand levels if retested.
**Bullish Outlook:**
* As long as ETH stays **above the support zone**, the bullish trend is likely to continue.
* A bounce from the current level could lead to a **retest of \$3,740**, followed by a move toward the **\$4,000 target** shown by the projected green path on the chart.
**Indicators & Sentiment:**
* Price respecting the EMA lines confirms **strong buyer interest** on pullbacks.
* No visible bearish divergence, and the chart structure favors **trend continuation**.
**Conclusion:**
Ethereum remains in a **bullish structure**, with strong support around \$3,570–\$3,600. As long as it holds above this zone, the next upside targets are \$3,740 and potentially \$4,000. A break below the EMAs would signal weakness, but for now, momentum supports continued gains.

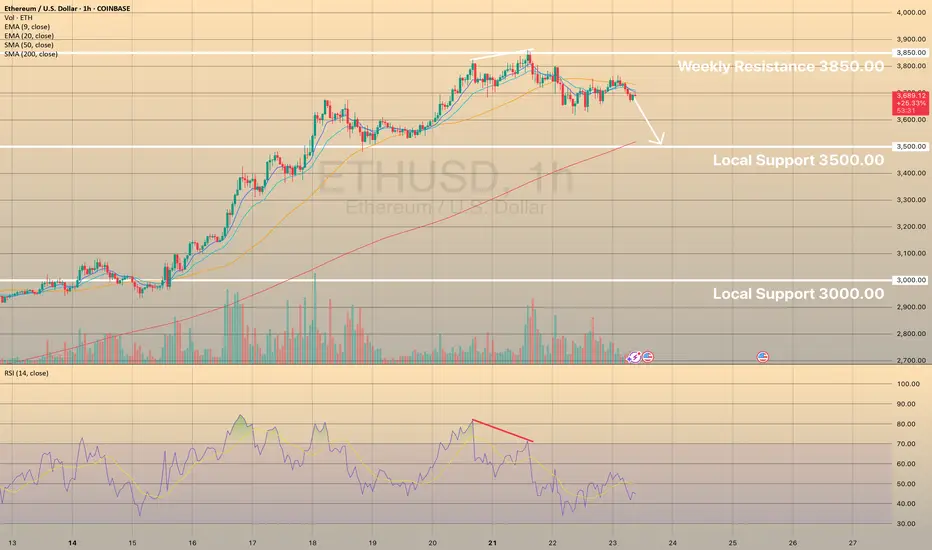
ETHUSD FORMED A BEARISH WEDGE. READY TO REVERSE?ETHUSD FORMED A BEARISH WEDGE. READY TO REVERSE?📉
ETHUSD has been moving bullish since July 9, forming the bearish wedge, supported by the bearish divergence. Today the price started to breakdown this pattern.
A bearish wedge is a bearish reversal pattern in an uptrend, where the price forms higher highs and higher lows within converging upward trendlines, signaling weakening bullish momentum and a potential downward reversal. To trade, identify the wedge with declining volume and confirm with RSI or divergence. Sell or short on a breakdown below the lower trendline with a volume spike. Set a stop-loss above the recent high or upper trendline. Target the wedge’s height projected downward from the breakdown or the next support level with a 1:2 risk-reward ratio.
The decline towards local support of 3,500.00 is highly expected. If the bearish impulse gets strong enough, we may see the decline towards 3,000.00 support level.

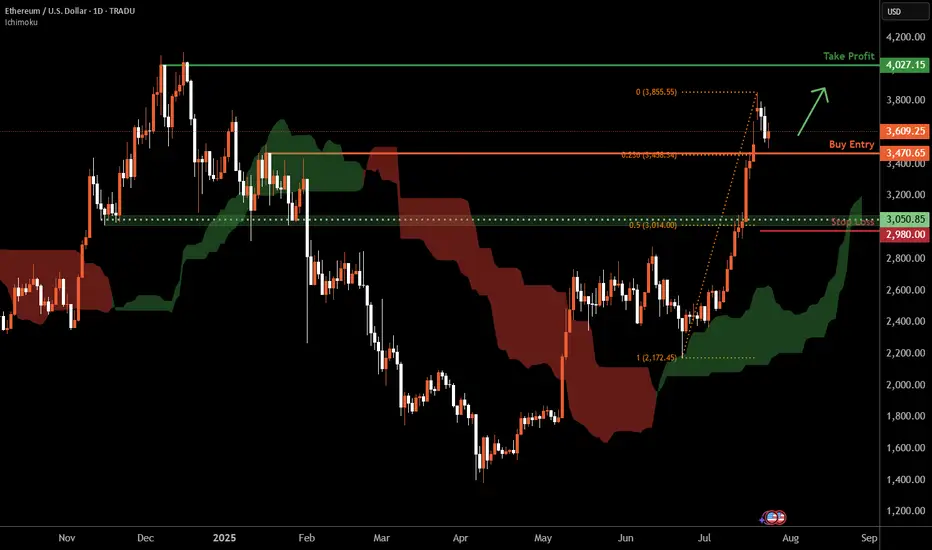
Ethereum D1 | Bullish uptrend to extend higher?Ethereum (ETH/USD) is falling towards a pullback support and could potentially bounce off this level to climb higher.
Buy entry is at 3,470.65 which is a pullback support that aligns with the 23.6% Fibonacci retracement.
Stop loss is at 2,980.00 which is a level that lies underneath a pullback support and the 50% Fibonacci retracement.
Take profit is at 4,027.15 which is a multi-swing-high resistance.
High Risk Investment Warning
Trading Forex/CFDs on margin carries a high level of risk and may not be suitable for all investors. Leverage can work against you.
Stratos Markets Limited (tradu.com ):
CFDs are complex instruments and come with a high risk of losing money rapidly due to leverage. 66% of retail investor accounts lose money when trading CFDs with this provider. You should consider whether you understand how CFDs work and whether you can afford to take the high risk of losing your money.
Stratos Europe Ltd (tradu.com ):
CFDs are complex instruments and come with a high risk of losing money rapidly due to leverage. 66% of retail investor accounts lose money when trading CFDs with this provider. You should consider whether you understand how CFDs work and whether you can afford to take the high risk of losing your money.
Stratos Global LLC (tradu.com ):
Losses can exceed deposits.
Please be advised that the information presented on TradingView is provided to Tradu (‘Company’, ‘we’) by a third-party provider (‘TFA Global Pte Ltd’). Please be reminded that you are solely responsible for the trading decisions on your account. There is a very high degree of risk involved in trading. Any information and/or content is intended entirely for research, educational and informational purposes only and does not constitute investment or consultation advice or investment strategy. The information is not tailored to the investment needs of any specific person and therefore does not involve a consideration of any of the investment objectives, financial situation or needs of any viewer that may receive it. Kindly also note that past performance is not a reliable indicator of future results. Actual results may differ materially from those anticipated in forward-looking or past performance statements. We assume no liability as to the accuracy or completeness of any of the information and/or content provided herein and the Company cannot be held responsible for any omission, mistake nor for any loss or damage including without limitation to any loss of profit which may arise from reliance on any information supplied by TFA Global Pte Ltd.
The speaker(s) is neither an employee, agent nor representative of Tradu and is therefore acting independently. The opinions given are their own, constitute general market commentary, and do not constitute the opinion or advice of Tradu or any form of personal or investment advice. Tradu neither endorses nor guarantees offerings of third-party speakers, nor is Tradu responsible for the content, veracity or opinions of third-party speakers, presenters or participants.
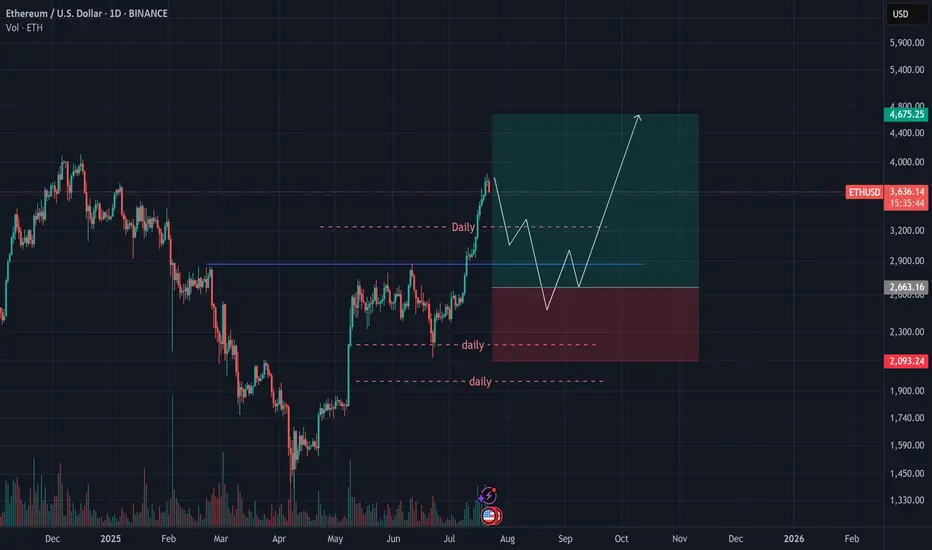
Ethereum (ETH) Analysis – July 21, 2025Ethereum has decisively broken through the key $3,000 level, pushing toward $4,000 with strong bullish momentum.
📉 While a short-term correction is likely in the coming weeks, ETH — much like Bitcoin — tends to attract increased investor interest with each dip.
As such, a continued rally toward $5,000 by the end of September remains well within reach, given the current structure and sentiment.
✅ Personally, I’m waiting for a pullback to around $2,700 as a more optimal re-entry point.

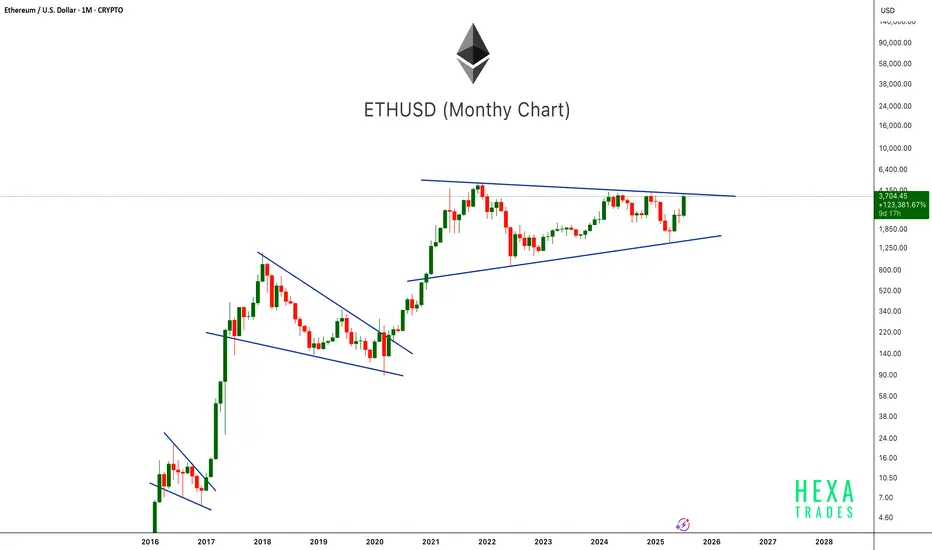
ETH Ready to Pop!ETHUSD is once again testing the upper boundary of a long-term symmetrical triangle on the monthly chart. This pattern has been forming since the 2021 peak, showing consistently higher lows and lower highs. Previous breakouts from similar consolidation patterns (2017 and 2020) led to massive rallies. With the current monthly candle showing strong bullish momentum, a confirmed breakout above this structure could mark the beginning of Ethereum's next major bull run. Keep an eye on the breakout level for confirmation.
Cheers
Hexa
Ethereum: Breakout Holds Strong | Next Targets $4K, $7K+Last week, three major crypto bills cleared the U.S. House of Representatives—and Ethereum (ETH) is emerging as the biggest winner from this legislative momentum.
ETH recently broke out of a rounding bottom pattern and hasn’t looked back. Momentum continues to build, and it’s now outperforming most other major assets.
📈 Technical Highlights:
✅ Short-term target: $4,000
✅ Long-term potential: $7,000–$8,000
🛡️ Key support: $2,700–$2,800 (bullish as long as this holds)
📣 Takeaway:
Ethereum’s breakout remains intact. Pullbacks into support could offer high-probability setups for swing traders and long-term investors.
#Ethereum #ETHUSD #Crypto #Trading #TechnicalAnalysis #CryptoTrading #EthereumPrice #Altcoins #Bullish #Breakout

ETHUSD SEEMS TO RETEST SUPPORT LEVEL OF 3,500.00ETHUSD SEEMS TO RETEST SUPPORT LEVEL OF 3,500.00
The ETHUSD has hit some resistance at around 3,850.00 this week. But it's since pulled back from that level, which might be a sign of a cooling trend. That's backed up by the RSI going bearish.
Right now, the price is below the 50 SMA on the 1-hour chart, indicating a mid-term downtrend.
We could see the price find some support at 3500.00 or so. Additionally the SMA 200 lays nearby, providing extra support here.
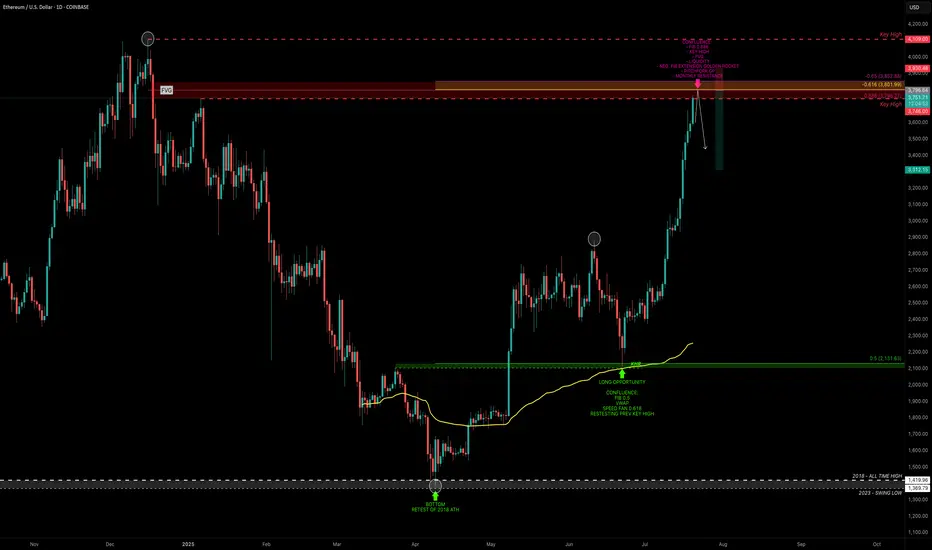
ETH — Rally Exhaustion or More Upside?ETH has been on an absolute tear. After retesting its old 2018 all-time high, it marked a bottom at $1383 — a brutal -66% correction over 114 days from the $4109 top.
From there, ETH ripped +100% in just one month, followed by 40 days of consolidation, and now, over the past 28 days, it’s surged another +76%, currently trading around $3715 — all without any major correction.
So the big question:
What’s next? Are we near a short setup, or is it time to long?
Let’s break it down.
🧩 Key Technicals
➡️ Bounce Zone:
On June 22, ETH retested the 0.5 fib ($2131.63) of the prior 5-wave Elliott impulse, with extra confluence from:
Anchored VWAP
Speed fan 0.618
➡️ Key Highs to Watch:
$3746 → recent local high
$4109 → 2021 all-time high
➡️ Fib Retracement Levels:
ETH has smashed through all major fibs, including the golden pocket (0.618–0.65) and 0.786 fib. The 0.886 fib at $3798.27 is the last major resistance, just above the $3746 key high.
At this zone, we also have:
Fair Value Gap (FVG)
Monthly Resistance
Negative Fib Extension Golden Pocket Target
➡️ Momentum Signal:
ETH is currently on its 8th consecutive bullish daily candle — historically, after 8–13 consecutive candles, price tends to cool off or correct. A sign to be cautious about longing here and consider profit-taking.
🔴 Short Trade Setup
Look for a potential SFP (swing failure pattern) at the key high $3746 to initiate a short trade.
This offers a low-risk setup with:
Entry: around $3746 (if SFP confirms)
Target (TP): ~$3300
Stop-loss: above SFP
R:R ≈ 1:4+
💡 Educational Insight: Why You Don’t Want to Long the Top
Markets often trap late longers near key highs or resistance zones — this is where smart money distributes while retail piles in emotionally.
Lesson: Look for zones of confluence (fib, VWAP, liquidity, FVG) and avoid chasing extended moves after multiple bullish candles.
Patience and confirmation at reversal points lead to higher-probability setups — you don’t need to catch every pump.
Final Thoughts
We’re approaching major highs, so this is a time for caution, not FOMO. Watch for reaction and potential reversals near $3750–$3850.
Stay sharp, manage risk — and remember, tops are where longs get trapped.
_________________________________
💬 If you found this helpful, drop a like and comment!
Want breakdowns of other charts? Leave your requests below.
$Ethereum / USD 4H AnalysisMARKETSCOM:ETHEREUM / USD 4H Analysis
ETH has shown a massive rally of +82.5%, climbing from the $1,900 area to a local high of ~$3,670.
🔑 Key Levels & Zones:
🔹 Resistance Zone:
~$3,750–$3,800 Price is reacting here after a strong bullish move. Potential local top if no breakout follows.
🔹 First Demand Zone:
~$3,500 Nearest 4H demand zone. A possible area for a short-term bounce or continuation if price retraces.
🔹 Mid-Level Demand Zone:
~$2,950 Previous consolidation zone, now flipped into support. Stronger structure here.
🔹 Deep Support Zone:
~$2,530 Major support in case of a deep correction. Confluence with previous breakout zone and unfilled demand.
🧠 After an 82% run, ETH might enter a short-term distribution or pullback phase. Eyes on how it reacts around $3,500. If that level holds continuation possible. If not expect deeper retracement.

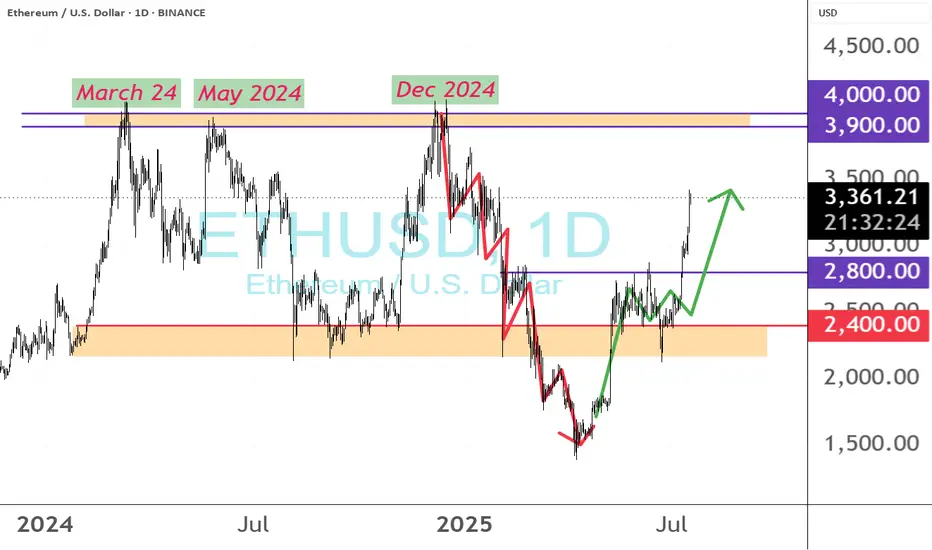
ETH $3,900–$4,000 Major Resistance: Can This Rally CLEAR $4,000?#ETH $3,900–$4,000 is still a very major resistance for ETH, having been tested in March, June, and December 2024… all without success. Let’s see if this rally is able to CLEAR the $4,000 level?

ETHUSD-SELL strategy 12 hourly chart REG CHANNELAs always crypto movements are severe, and one can never judge the corrective timings. Overall the view remains the same, and when carefully scaling in, is always warrented and proper risk management strategies.
Strategy SELL @ $ 3,675-3,750 area and take profit @ $ 3,175 area. On previous shorts if applicable, scale down slowly.

ETH/USD Short Setup – Bearish Opportunity Amid Bullish RSI DiverLooking to short Ethereum at current levels as price action shows bullish RSI divergence at the top, signaling potential exhaustion of the uptrend.
Trade Plan:
Sell Stop: 3,680
Stop Loss: 3,865
Take Profit 1: 3,495
Take Profit 2: 3,310
This setup aims to capitalize on a potential reversal as momentum weakens. Managing risk carefully with a well-placed SL above the recent high.
🔍 Watching closely for confirmation — a break below 3,680 would validate entry.
#ETHUSD #CryptoTrading #ShortSetup #TechnicalAnalysis #RSIDivergence


ETH weekly turning positive too targeting $5000 sl $1500Weekly trend turning slowly turning positive with daily already in a positive channel, expecting 5000 with corrections along the way. Dipping below $1500 would invalidate

ETH turned bullish on the daily chart, great R:R hereTargeting mid to upper 3000s in the mid-term (2-3 months) and expecting 5k plus by year end. ETH will get it's turn, don't worry

ETHUSD heading towards the top of the D1 frame✏️ CRYPTO:ETHUSD is in a strong uptrend towards the resistance zone of the 3800 daily frame. There are not many conditions for the sellers to jump in and reverse the current trend. Wait for the price reaction at the resistance of the D1 frame to consider the SELL strategy. Because currently if BUY is too Fomo.
📉 Key Levels
Sell trigger: Rejection from 3800
Target 3400, potentially 3,380
Leave your comments on the idea. I am happy to read your views.

ETHUSD (15m) – Precision Pullback Anticipated Before Final Expan📈 ETHUSD (15m) – Precision Pullback Anticipated Before Final Expansion
VolanX Protocol: Synthetic Capital Deployment Phase II
🗓️ July 20, 2025 | ETH @ $3,776
🚨 Market Intelligence Snapshot:
"Structure delivered. Liquidity engineered. Expansion phase in effect."
🔍 Current Readings:
🟥 Weak High tapped at $3,817
📈 Regression Line intact, favoring bullish continuation
📊 Premium zone reached – expect pullback to equilibrium before next leg up
💼 Protocol Alignment – VolanX:
Synthetic Block Order cluster from $3,701 to $3,629 (blue & yellow mitigation zones)
Reversal Potential Zone (RPZ) aligned with 0.618–0.786 retracement of latest impulse
Volume Surge at break of falling wedge confirms breakout strength
Choch → BOS Sequencing validated with structural integrity
📌 Projected Moves:
📉 Pullback into Equilibrium ($3,700–$3,629)
📈 Expansion targets:
$3,883 (1.236)
$3,989 (1.618)
Final: $4,210 (2.414) – profit booking zone
🧬 Status: Synthetic capital locked and deployed
🕒 Next Watch: Rejection or acceptance at 0.618–0.786 FIB zone
🛡️ “Discount fuels premium. Wait for precision, not permission.”
#ETHUSD #VolanX #SyntheticDeployment #SmartMoneyConcepts #LiquidityGrab #FVG #PriceAction #AlgoDrivenTrading #WaveAnalysis #ETH

Ethereum at Crucial Resistance – Will the Bulls Hold or Fade?Ethereum at Crucial Resistance – Will the Bulls Hold or Fade?”
Ethereum is currently trading near a key resistance zone around $3,800, as marked on the chart. After a strong bullish rally with clear Break of Structures (BOS) along the way, ETH has now reached an extended point where price may face selling pressure.
The Bollinger Bands are stretched, showing overextension, and the marked arrow suggests a possible correction or pullback from this level. A retest of previous support zones (~$3,400–$3,200) could be expected if the resistance holds.
⸻
Key Levels:
• 🔼 Resistance: ~$3,800
• 🔽 Support: ~$3,400 / ~$3,000
• 🔄 Price Action: Watching for rejection or breakout confirmation
This is a textbook case of price approaching a strong resistance level after a bullish wave, where caution and confirmation are key for the next move.

ETH BUY SETUP ,Bought From $3720ETH BUY SETUP
Currently $3720
Bought From $3720
(Trading plan If ETH go down
to $3630 will add more longs)
Expecting target $3830 OR ABOVE
In the event of an early exit,
this analysis will be updated.
Its not a Financial advice
