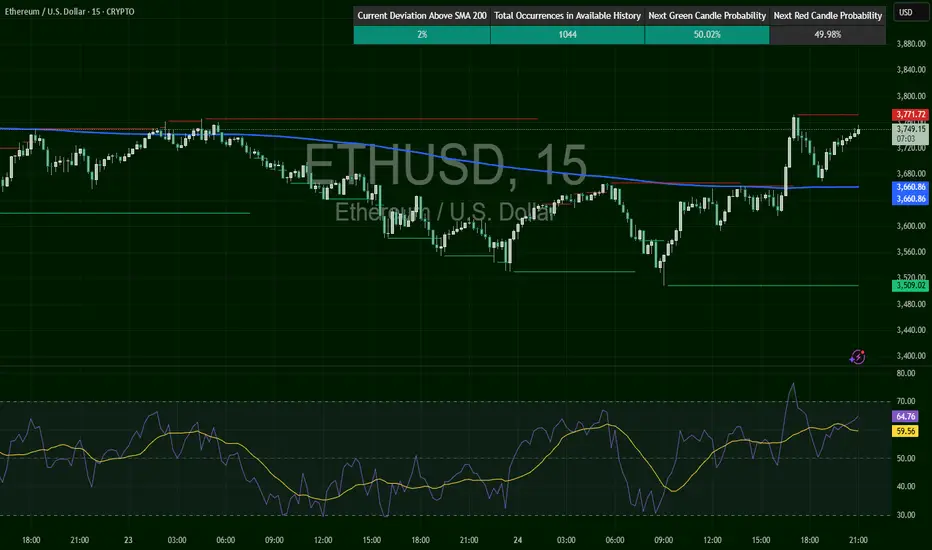
ETHUSD – From Breakdown to BreakoutETH reversed off a major demand near $3,510 and exploded past the 200 SMA into $3,747. Currently, price is resting just under resistance at $3,771, with RSI at 64.49 — strong and trending. If this resistance breaks, next leg up begins. If rejected, expect retest of $3,680–$3,700 range.
ETHEREUM trade ideas
Ethereum short updateDon't be surprised to see some buying coming into play at the POI's highlighted below.
Hedging involves entering into a trade that is expected to perform in the opposite direction of an existing position, effectively protecting against potential losses.
ETHUSD – Breakout Confirmation & Premium Targeting🚀 ETHUSD – Breakout Confirmation & Premium Targeting (VolanX Protocol)
ETHUSD has broken out of its descending channel with a clean BOS (Break of Structure) and aggressive volume spike from the 3,620–3,650 demand zone. This breakout suggests a shift in order flow, with liquidity now being targeted toward premium levels.
Key Observations (1H SMC):
BOS: Clear bullish structure shift above 3,669 and 3,705 levels.
Volume Surge: Buyers stepped in aggressively near the equilibrium zone.
Liquidity Pools: Weak highs around 3,767 and 3,813 are prime targets.
Premium Zone: Between 3,767 – 3,875, marked as the next magnet zone.
Ultimate Target: 4,003 key level if momentum sustains.
VolanX Playbook:
Long Bias:
Entry Zone: 3,669–3,705 (retest of BOS level)
Targets:
3,767 (first liquidity grab)
3,813–3,875 (premium zone)
4,003+ if breakout trend extends
Invalidation:
Close below 3,621 = bullish scenario voided, revert to discount pricing.
VolanX Signal:
This breakout suggests institutional order flow absorption and rotation toward high-value zones. Monitor retests for long entries and manage risk under 3,621.
#ETH #ETHUSD #VolanX #SMC #CryptoTrading #Liquidity #OrderFlow #PriceAction #TradingView #AlphaSignals

ETH/USD: Watching the levels. It broke out of the downtrend and its going up, I think the momentum has just begun, Let's see where we go this time. Big time fan of ETH so excited!

ETH 1H — Decision Point Ahead
ETH just confirmed a bullish RSI divergence, with price finding support at the 200MA.
MACD supports the move, and the trend structure is clean: MLR > SMA > BB Center.
Now, price is hovering at the 0.236 Fib level.
A few strong closes above it could open the door for more upside.
If rejected, we might revisit the 200MA for another test.
Either way — we’ll find out soon.
Always take profits and manage risk.
Interaction is welcome.

ETHUSD: [VolanX ETHUSD SMC Outlook] — Compression → Expansion📈 — Compression → Expansion Setup Brewing
Chart Context (15m):
We're in a descending channel compression zone, rejecting from discount demand after BOS (Break of Structure) & CHoCH (Change of Character) confirmations. Volume spiked at the low, signaling potential accumulation. Current price is coiling just under the equilibrium zone.
🔍 Technical Setup:
🟢 Weak Low Sweep into high-volume demand zone
🔴 EQH (Equal Highs) + Liquidity resting near $3,754
🟣 Premium Supply Zones above $3,700 — final liquidity targets
🔻 Still under bearish internal structure (lower highs intact)
🟠 Equilibrium retest holding as micro support (watch for impulse)
🎯 VolanX Execution Path:
Break above $3,667 trendline = early long trigger 🚀
Target 1: $3,700 zone reclaim = confirmation of strength
Target 2: $3,754 liquidity hunt 🧲
Rejection from $3,754–$3,775 = potential short setup
🔻 Invalid Below:
Close below $3,600 with volume = bearish continuation
Retest of $3,523 “Discount” zone or liquidity void
📊 Volume Profile:
Highest reactive node: $3,623–$3,646
Spike near low = trap or base?
📡 VolanX Signal Protocol:
Accumulation + Compression = Expect Expansion.
ETHUSD may be rotating toward premium liquidity unless invalidated. Watch for breakout confirmation above descending trendline + EQH run.
🧠 Narrative Bias:
Markets are pricing in ETH's role in upcoming ETF decisions & regulatory clarity. VolanX AI aligns this structure as "coiling before institutional deployment."
#ETH #VolanX #SmartMoney #LiquiditySweep #CryptoTrading #OrderFlow #VolumeProfile #ETHUSD #TradingView #AlphaSignals #VolanXProtocol #SMC #PriceAction

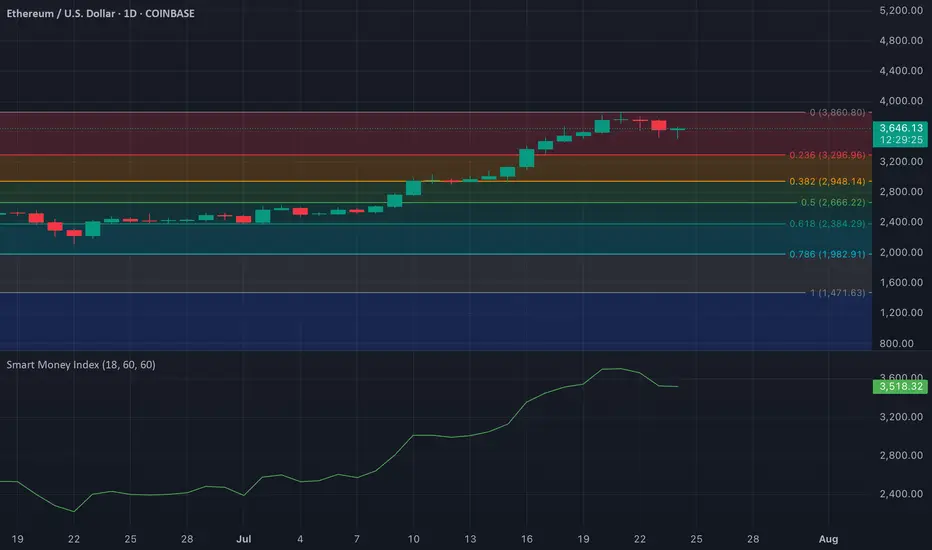
ETH/USD: Smart Money Index Signals Distribution Post-RallyOn the ETH/USD daily chart, a notable drop in the Smart Money Index (SMI) is confirming bearish sentiment among key market players. Since July 20, the SMI has declined by 7%, signaling increased selling activity from institutional investors and seasoned traders—often referred to as "smart money."
The SMI works by contrasting intraday trading behavior: it gauges retail-driven morning trades against institutional-dominated afternoon moves. A falling SMI, like the one seen on Ethereum, suggests that smart money is quietly exiting positions. In this case, it points to profit-taking after ETH’s recent price rally, reinforcing the idea that the current pullback may be more than just noise. Traders should monitor further declines in the SMI as a sign of continued distribution.
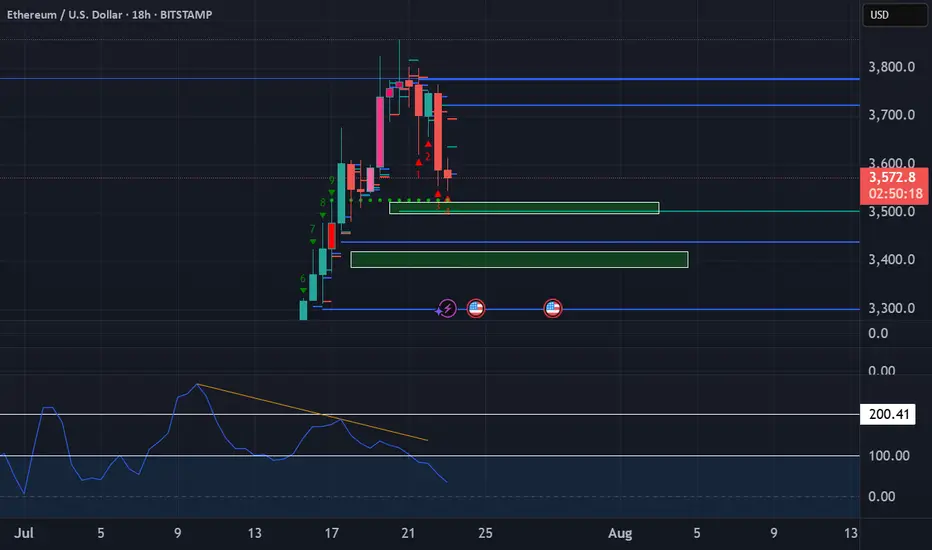
ETHUSD, XRPUSD - BEARISH DIVERGENCE SUCCESSFULLY WORKED OUT
ETHUSD, XRPUSD - BEARISH DIVERGENCE SUCCESSFULLY WORKED OUT
On these 2 graphs you may observe ethereum and ripple declining after strong bearish divergence showed up on both of these instruments. Here, the bearish divergence proved to be a success. In both cases the price has almost reached first targets: 3,500.00 for ETHUSD and 3.00000 for XRPUSD.
What will be next?
It looks like downwards correction still persists and we may observe some deeper than now decline with possible targets of 3,000.00 for the ETHUSD and 2.60000 for the XRPUSD.
ETH my notes for short termwaiting for a short time correction time. supports: 3500 - 3300 - 3050. then new ath process till october
not financial advices, notes for myself

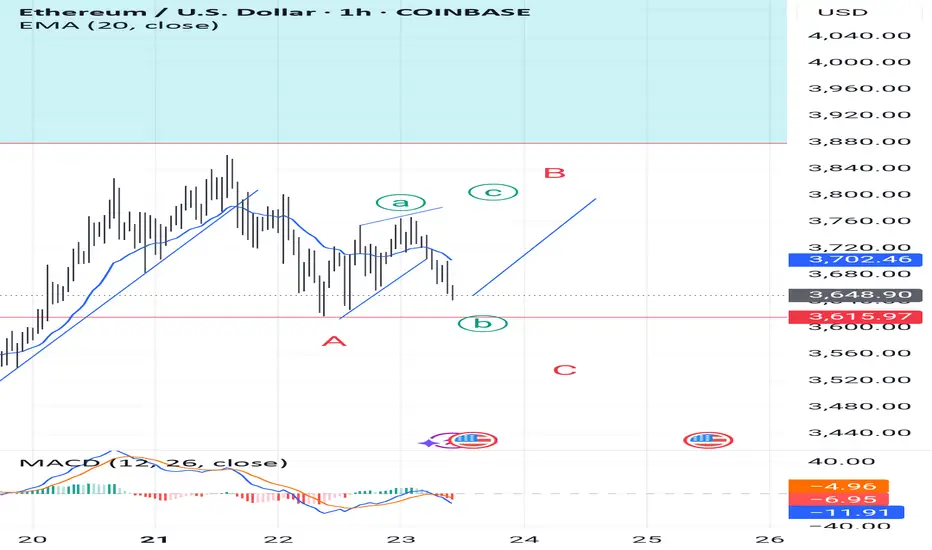
EthusdLeading diagonal has formed a wave and now we see b as a flat.
If the price doesn't go below (a)3615, I think we may see c wave of (B).
It may come strong and quick
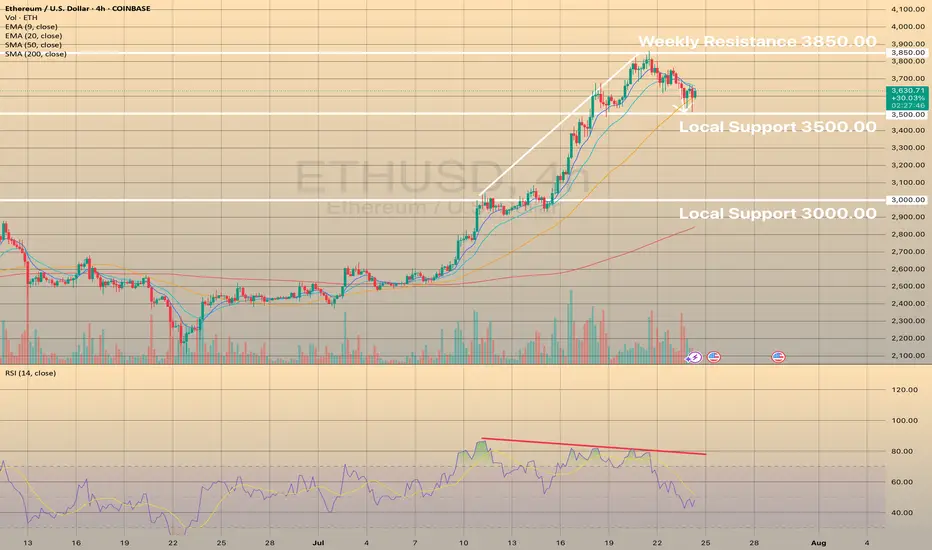
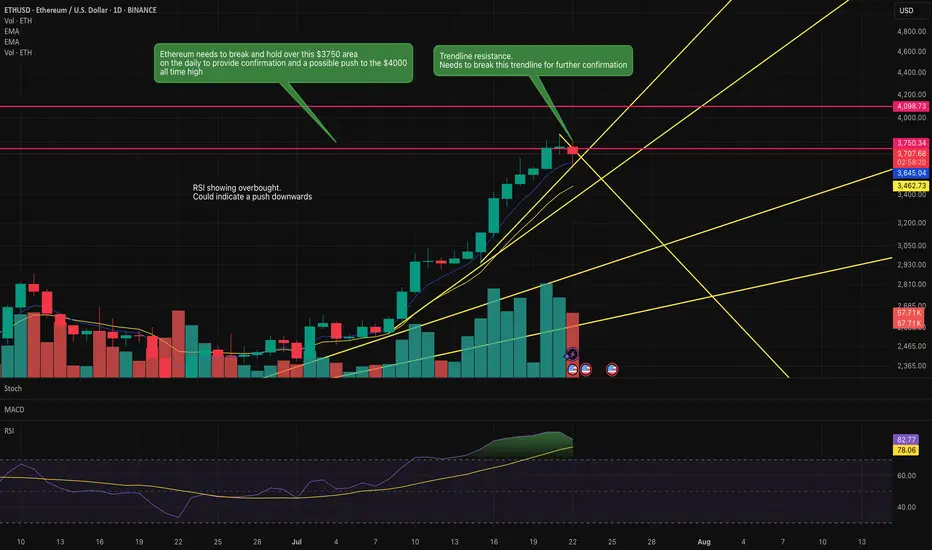
Is Ethereum going to push above this key resistance?Ethereum is knowcking against this key resistance area.
If it pushes above this $3750 area then it has a clear run to the previous all time highs of $4000.
RSI indicates overbought so it could indicate a reversal to the downside.
Key trendline is being honoured currently. However, a break of this trendline may indicate the move upwards to the previous all time high.
Watch this space over the next couple of days.
Ethereum Bullish Rally IncomingIf Ethereum can break above that point and clear $2,840, this level will turn into a major support, where fresh supply waits. However, a drop below the 200-EMA could lead the price to retest $2,400. A break below this level would shift momentum negative and risk a slide toward the April low near $1,500.
Read More at: www.cointrust.com

ETHUSD - Decision TimeWhat do make of the current situation?
What if you are long?
Here's what to expect:
a) support at the U-MLH, further advancing up to the WL
b) open & close within the Fork. If so, there's a 95% Chance of price dumping down to the Centerline.
Taking 50% off the table is never bad.
50% money in the pocket if price falls down to the Centerline.
Or if it advances up to the WL, you still have 50% that generates profits.
Either way, you have a winner on your hands.
Don't let it dig into a Looser!

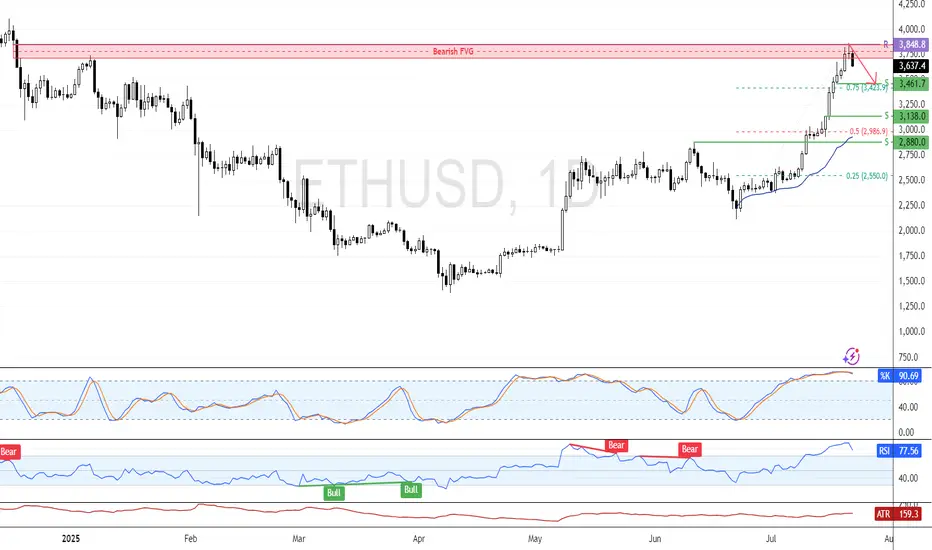
ETH Eyes Consolidation from Overbought ZoneFenzoFx—Ethereum pulled back from the daily bearish FVG. The recent candle closed with a long wick and flat body, reflecting market uncertainty. Momentum indicators remain in overbought territory, signaling a possible consolidation phase.
If resistance at $3,848.0 holds, the price may decline toward support at $3,461. However, the bullish outlook stays valid as long as ETH/USD holds above $3,848.0.
ETHUSD – Cracked at the TopETH broke sharply below $3,750 and sliced beneath the 200 SMA with strong volume. RSI slipped to ~41 and remains suppressed. Price tested the $3,655 demand zone and bounced slightly, but bulls are clearly losing grip. Any bounce below $3,730 is suspect for continuation shorts.
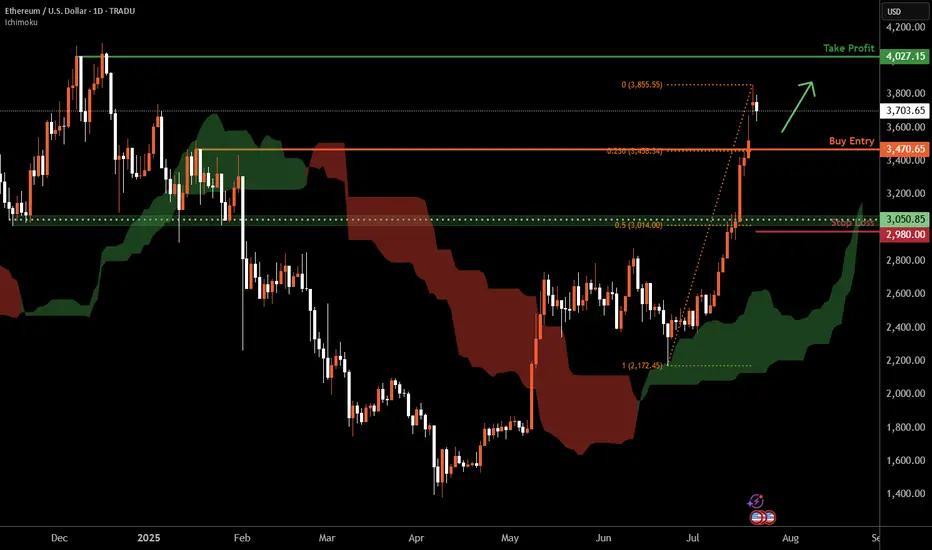
Ethereum D1 | Potential bullish bounceEthereum (ETH/USD) is falling towards a pullback support and could potentially bounce off this level to climb higher.
Buy entry is at 3,470.65 which is a pullback support that aligns with the 23.6% Fibonacci retracement.
Stop loss is at 2,980.00 which is a level that lies underneath a a pullback support and the 50% Fibonacci retracement.
Take profit is at 4,027.15 which is a multi-swing-high resistance.
High Risk Investment Warning
Trading Forex/CFDs on margin carries a high level of risk and may not be suitable for all investors. Leverage can work against you.
Stratos Markets Limited (tradu.com ):
CFDs are complex instruments and come with a high risk of losing money rapidly due to leverage. 66% of retail investor accounts lose money when trading CFDs with this provider. You should consider whether you understand how CFDs work and whether you can afford to take the high risk of losing your money.
Stratos Europe Ltd (tradu.com ):
CFDs are complex instruments and come with a high risk of losing money rapidly due to leverage. 66% of retail investor accounts lose money when trading CFDs with this provider. You should consider whether you understand how CFDs work and whether you can afford to take the high risk of losing your money.
Stratos Global LLC (tradu.com ):
Losses can exceed deposits.
Please be advised that the information presented on TradingView is provided to Tradu (‘Company’, ‘we’) by a third-party provider (‘TFA Global Pte Ltd’). Please be reminded that you are solely responsible for the trading decisions on your account. There is a very high degree of risk involved in trading. Any information and/or content is intended entirely for research, educational and informational purposes only and does not constitute investment or consultation advice or investment strategy. The information is not tailored to the investment needs of any specific person and therefore does not involve a consideration of any of the investment objectives, financial situation or needs of any viewer that may receive it. Kindly also note that past performance is not a reliable indicator of future results. Actual results may differ materially from those anticipated in forward-looking or past performance statements. We assume no liability as to the accuracy or completeness of any of the information and/or content provided herein and the Company cannot be held responsible for any omission, mistake nor for any loss or damage including without limitation to any loss of profit which may arise from reliance on any information supplied by TFA Global Pte Ltd.
The speaker(s) is neither an employee, agent nor representative of Tradu and is therefore acting independently. The opinions given are their own, constitute general market commentary, and do not constitute the opinion or advice of Tradu or any form of personal or investment advice. Tradu neither endorses nor guarantees offerings of third-party speakers, nor is Tradu responsible for the content, veracity or opinions of third-party speakers, presenters or participants.
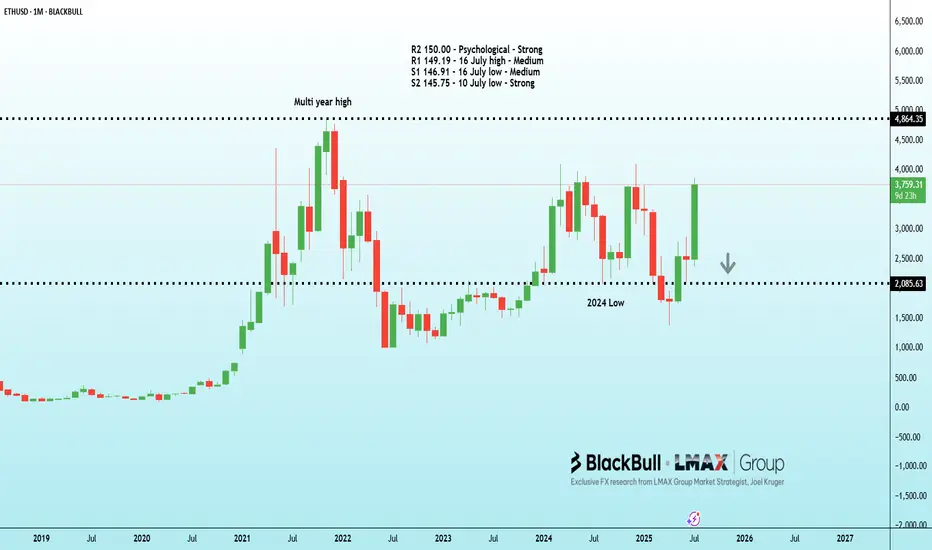
Dollar softens, Yen soars on BOJ normalization bets | FX ResearcThe US dollar got off to a soft start to the week, though thinner summer trading conditions have restrained activity across G10 and emerging markets. The Japanese yen stole the spotlight in G10 after the Ishiba coalition lost its upper house majority, fueling speculation about potential Bank of Japan policy normalization and political instability, which likely drove yen demand.
Meanwhile, positive market sentiment tied to a possible Trump–Putin meeting was overshadowed by skepticism about the sustainability of equity and Bitcoin rallies, given the sharp rise in US equity futures and bond market trends.
Political pressure on the Federal Reserve is intensifying, with Treasury Secretary Bessant questioning the Fed's credibility while also advocating for US–China trade talks and hinting at tougher terms for Europe. Despite calls from the administration and GOP figures for lower interest rates, the Fed anticipates price increases in August data.
In Canada, the Bank of Canada survey pointed to trade uncertainties and weak demand curbing inflation, with tariffs impacting corporate margins rather than consumers. On the fiscal side, the CBO estimates Trump’s tax cuts will add $3.44 trillion to the US deficit over the next decade—a significant but slightly reduced figure compared to earlier projections.
Exclusive FX research from LMAX Group Market Strategist, Joel Kruger
Ethereum Metric Projections for $5,700-$7,500 RangeEthereum (ETH/USD) - Integrating Cowen's Cycle Top Insights: Butterfly Pattern & S&P Fractal in One Chart, Plus Risk Metric Projections for $5,700-$7,500 Range
I've consolidated key ideas from quantitative analyst Benjamin Cowen's recent analysis into a single visual framework for Ethereum (ETH/USD) on the weekly timeframe, as of July 21, 2025, with ETH hovering around $3,500 following its rebound from the "going home" phase earlier this year. By overlaying Cowen's bearish butterfly harmonic pattern and the S&P 500 fractal (1989-1992) directly onto the chart, I've made his structural predictions accessible in one cohesive view, highlighting potential cycle tops without needing separate tools for those elements. For the risk metric bands, which aren't plotted here, I've pulled in Cowen's dynamic projections below as a complementary layer. His base case dovetails with the chart's signals, pointing to a realistic top between $5,700 and $7,500 ahead of a possible 2026 bear market, barring significant economic shocks. Let's dive in.
1. Bearish Butterfly Harmonic Pattern: Core Structure and Targets (Integrated on Chart)
Drawing from Cowen's "butterfly effect" video, I've labeled the pattern (points X, A, B, C, D) right on the chart to show its Elliott Wave roots and reversal potential at highs.
X to A: The foundational low-to-high move from the early 2020s.
A to B: Culminating at the ~$4,850 peak (2021 ATH).
B to C: The pullback to ~$900 (2022 low), nailing the 0.786 Fibonacci precisely.
C to D: The ongoing rally, with C spanning the 0.382-0.886 range—Ethereum pivoted at ~0.382 first, then probed lower.
Minimum target per Cowen: A 1.618 extension from B lands at ~$5,700, a spot to consider lightening up.
Bolder projections: Extending to 2.24 from B (~$7,500) or 1.272-1.618 from X (~$6,000-$7,300).
This setup, triggered post-ETH's "home" drop in Q2 2025 (which floored ETH/BTC), remains intact on the chart and forecasts rejection at D, ushering in the marked "anticipated bear market."
2. S&P 500 Fractal Comparison (1989-1992): Historical Roadmap (Overlaid on Chart)
I've directly superimposed Cowen's favored fractal onto the ETH price action for easy comparison, capturing its "perfect" alignment down to small dips and surges.
Parallels: ETH's post-halving trajectory echoes the S&P's extended climb before peaking.
Outlook: Projecting to January 2026 (factoring in ~6 months of remaining bull phase per 4-year crypto rhythms), the fractal hints at a low-end top around $5,300.
Fuller extension: Should the uptrend stretch (mirroring ETH's delayed 2018 top relative to BTC), it could hit ~$7,500 pre-bear phase.
Cowen ties this to BTC's recurring bears in 2014, 2018, and 2022 (post-halving), suggesting ETH aligns similarly—expect ATH breaches (~$4,850) but tempered by fading cycle intensity.
3. Ethereum Risk Metric: Quantifying Overheating and Diminishing Returns (Separate Projections)
Cowen's proprietary 0-1 scale (0 low risk, 1 high) adds data-backed context, sitting at ~0.672 currently (0.6-0.7 band, signaling room for gains before excess heat).
Recurring setup:
ETH "homes" at 0.3-0.4 risk across cycles (Q4 2016, Q4 2019, Q2 2025), syncing with ETH/BTC lows and ATH-bound rallies.
Past peaks:
Touched 0.4-0.5 and 0.5-0.6 in 2017/2020; highs at ~0.7-0.9, with 2017 grazing 0.9-1 fleetingly and 2021 at ~0.8-0.9 before faltering.
Dynamic targets (evolving with price; assuming no 2020-like crash from unemployment jumps):
0.7 risk: ~$4,100 (close to range ceilings and ATH entry).
0.8 risk: ~$5,600 (cautious peak aligner with butterfly mins; limited historical dwell time).
0.85 risk: ~$6,600 (momentum-fueled midpoint if post-ATH strength holds).
0.9 risk: ~$7,700 (stretch goal; brief past visits, adjusted for cycle fade).
0.95 risk: ~$9,000 (euphoria territory; Cowen flags as exit signal, improbable baseline).
1.0 risk: ~$10,000 (absolute cap; theoretical, not expected amid history's ~4% time over 0.8).
This bolsters the $5,700-$7,500 as grounded, per Cowen: "Realistic because folks crave $10,000"—rooted in data sans overreach.
4. Key Chart Annotations Supporting the Outlook
Momentum/Volume: Carp Momentum showing divergence; declining volume on upswings (e.g., Vol 8.42M labeled).
Other Annotations: Recent drop: -2,652 (-60.64%) over 265-200d; projected declines: -3,983.89 (-81.89%) over 351 bars/274d, and -4,527.68 (-80.01%) over 31 bars/21d, -4,710.46 (-81.99%) over 31 bars/274d.
Core view: Momentum for $4,000-$4,850 breaks, but with potential consolidations or 20% dips en route (e.g., daily RSI heating up, possible August-September correction like 2017).
5. Cycle Top Predictions and Navigation Strategy
Confluence Range: $5,700 (safe, 0.8 risk/butterfly floor) to $7,500 (bold, 0.9 risk/fractal ceiling)—Cowen's "realistic" span, screaming sensibility over $10K hype.
Upside outliers: $9,000-$10,000 at 0.95-1 risk, but Cowen urges bailing there.
Horizon: Late 2025/early 2026 crest, then bear (regression retest like priors).
Cowen's Dynamic DCA Out: Sidestep top-guessing by scaling sales at bands—off original stack:
0.6-0.7 (~$3,500-$4,100 now): 1/10th.
0.7-0.8 (~$4,800 ATH): 2/10ths (30% total).
0.8-0.9 (~$5,700-$7,500): 3/10ths (60% total).
0.9-1 ($9,000+): Rest (4/10ths).
Strength-selling yields dip-buy cash, hodl remnant for surprises.
6. Trade Setup (Bearish Long-Term, Bullish Near-Term)
Long Entry: Buy dips to $3,000-$3,200 support, eyeing ATH push.
Short Entry: At $5,700+ on cues (bear engulf, >0.8 risk).
Stop Loss: Over $4,850 (bull) or $8,000 (bear void).
Take Profits: Layered—$4,800, $5,700, $7,500; bear lows $2,000-$1,500.
Risk: 1-2% trades; crypto vol demands caution. Cowen: No certainties, but patterns favor ATHs pre-drop.
Void: Volume-backed $8,000+ surge eyes $10,000+, scrapping bear case.
Not advice—DYOR on macros/ETH shifts. Cowen sees pattern repeats with softer peaks. Your ETH thoughts? Comment!
#ETH #Ethereum #CryptoCycle #BearishButterfly #PricePrediction
Likes/follows if valuable!

ETH Season?Well, in all of its history Ethereum’s recent lows remind me the most of December 2019 while the recovery after reminds me the most of the bull rally after March 2020. Either way I think the time for ETH and crypto as a whole is very near. Here’s my charted roadmap. If BTC hit a new high and then some over a whole year already since it hit a new high, then how do we not expect ETH to do the same and probably amplified as well as certain alt coins too. Curious to see how this thesis plays out. Not financial advice

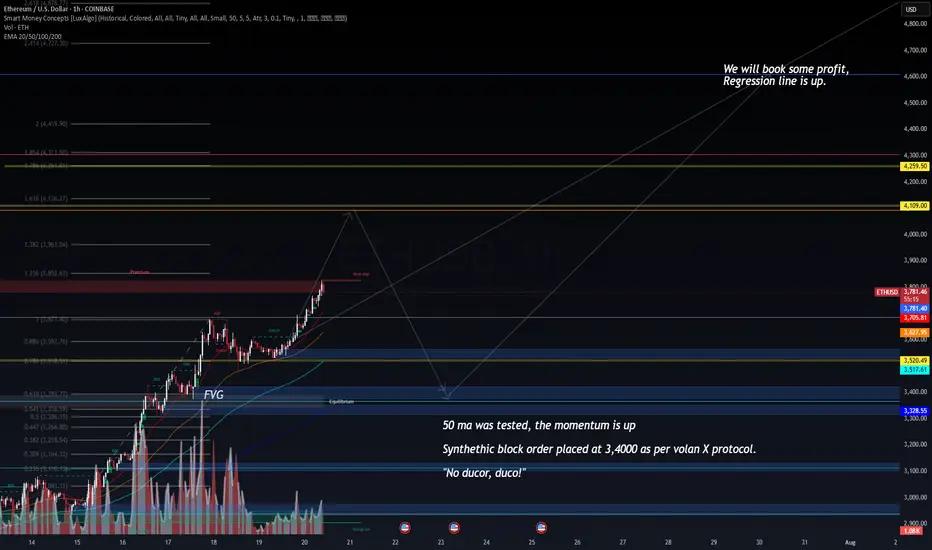
ETHUSD – Deploying Synthetic Capital as per VolanX Protocol📈 ETHUSD – Deploying Synthetic Capital as per VolanX Protocol
1H Chart | July 20, 2025
"No ducor, duco!"
(“I am not led, I lead.”)
🧠 Market Context:
Price is holding above the 50 MA, confirming upward momentum. Liquidity has been taken from prior internal highs, and price continues pushing into the premium zone above the 1.0 Fibonacci level.
🔧 VolanX Protocol Deployment Update:
✔️ Synthetic Block Order: Placed at $3,400, with precision according to Volan X synthetic injection model.
✔️ Regression Line: Sloping upward – momentum remains in favor of bulls.
✔️ Weak High Targeted: $3,850 zone approached with clear aggression.
✔️ Volume Uptick: Observed near FVG and mitigation zones – ideal for synthetic deployment timing.
📍 Key Zones:
🚩 Block Order Zone: $3,400
🎯 First Profit Target: $3,852 – $3,961 (Premium zone)
🟡 Ultimate Target: $4,259 – $4,419
🔵 Equilibrium Support: $3,328
💬 Narrative:
"We will book some profit, Regression line is up."
Price is behaving according to expectations. The 50 MA retest confirms the continuation bias, and we now monitor for the next volatility compression before expansion. Expect smart money to aim for the inefficiencies left near the $4,100–$4,250 level.
📊 Deployment Signal: LIVE
🧬 VolanX Engine: Active
📍 Next Review: Upon 1.382 fib reaction or volatility compression
#ETHUSD #VolanX #SyntheticCapital #SmartMoney #MomentumTrading #TradingStrategy #FVG #PriceAction #CryptoAnalysis

ETH is up about 50% Since June 2025Relying on the absolute intraday low from June to claim that ETH is “up 70%” is a textbook data‑skewing mistake often found in AI‑generated headlines. A more robust approach is to average prices over several days (or even a full week). On that basis, ETH has risen roughly 50% since June— not 70%. Don’t let a distorted headline push you into adding leverage through perpetuals just because your strategy’s returns lag spot performance; that reaction only compounds impermanent‑loss risk.

Inspired my Benjamin CowenWhilst this is also high speculation and to not be used to predict the market, using Benjamin Cowen's idea of using the SPX Index's 1990's timeframes and extending them to match the potential ETHUSD cycle.
You'll see how the early parts to the moves are near 1/1 of each other. Looking into the future, you'll also see that the SPX's moves interact with the middle part of the channel multiple times, and begins to decline in the potential bear market (yellow dashing lines). This also looks pretty convincing. Charts are so fascinating.
