ETHGBP trade ideas


ETH goes boing.The lower black support line is keeping ETH at bay. I expect a bounce up to the fib before a sharp return down and breach.

Fib retracement for trade entry for amandaFib retracement for trade entry for amanda Fib retracement for trade entry for amanda Fib retracement for trade entry for amanda

ETH my prediction for short time correctionMy thought about the ETH recent cycles using Fib retracement. If I am correct my next long will be below £488.
I am not financial advisor it is just for education purpose.


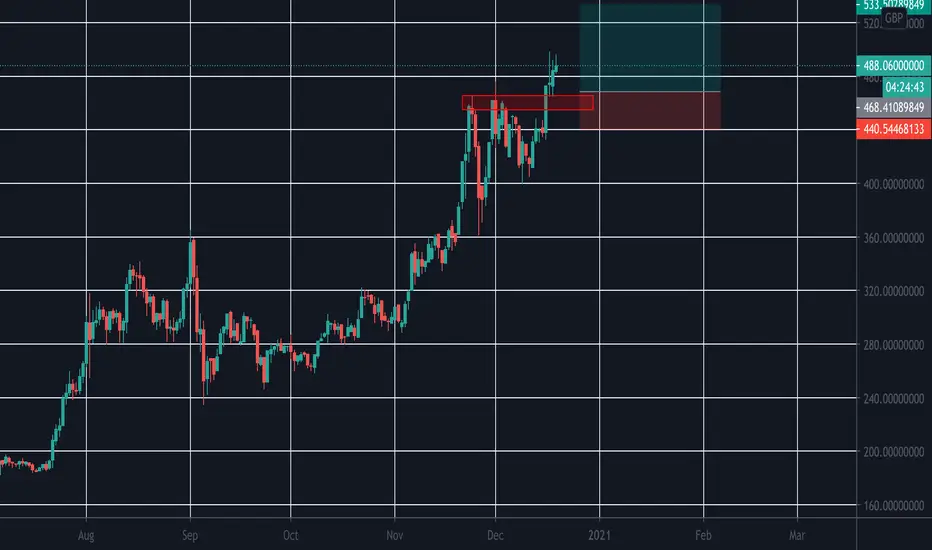
Can ETH break the resistance line soon?looks to me like a reverse head and shoulders pattern forming? would love to see this 🚀

daily analysis of ETHREUM/ BRITISH POUND Hi friends
the daily chart of this market shows that it will experience with a high probability a downtrend in the coming days but also we must be vigilant of the change of direction towards the opposite
please subscribe to receive new analyzes


ETH - One More Drop; then it's time to moon Part 2So my previous idea was invalidated, sad to say i didn't add on to my existing longs... but importantly i didn't lose any capital!
My alternative count is now in play, i see this as Wave B of Wave 2 (Wave 1 start on March lows). I am now expecting a Wave C to form. Before shorting i will be waiting for confirmation on lower time frames; shorting here is risky for sure. Please note that Y wave of (B) may not yet be over yet, continuation may lead to £218 before reversing.
If we see price start to decline;
T1 £185.52
T2 £169.16
Hopefully this plays out, if not there is a more bullish count that can be argued here but this is now my primary count. Longer term swing targets remain unchanged.

ETH - One More Drop; then it's time to moonThis last 6 weeks of trading ETH or BTC has been pretty frustrating, lots of shifting bias and no clear pictures. BTC and ETH are very closely correlated, so for the most part the charts are similar, however due to DEFI i do expect ETH to outperform BTC.
My idea is that ETH is currently ending it's B wave within Wave 2 of a larger degree impulse since March low's. That means that a C wave down needs to complete before starting an impulsive move up.
This idea would be invalidated over £194.
Buy zone from £180 > £172, i will be laddering with greater volumes the lower we go. I would then expect price to impulsively move above £300!!!


ETHGBP - Rising Wedge - Not Looking GoodRising wedge clearly formed on ETHGBP pairing, breakdown out of the wedge with a target of 100-95GBP will take it nicely to the 0.236 FIB which is also support from December plus R turned S back from late 2018.
RSI also showing Double Top although middle of the road, not yet overbought
The state of the oil industry cannot be excluded as an external factor that could have ramifications across the crypto world as bag holders start to cash in


ETHEREUM GOING TO BLEED Last few weeks have seen all crypto's bleeding.
Going into the back end of march we can still see this uncertainty. The price movements in the markets arise from the millions of people who interact with it each day. The human component of the market prevail, emotions and instincts interchangeably, cause volatility.
1. The 11/03 saw a decline of -49%. Almost half of the entire value of ETH was lost in 24 hours.
2. From 13/03 to 16/03 (3d 2h 30m) the price has been consistently fluctuating between £95-£109. From this two rectangles have been placed as areas of bullish or bearish. Breakouts from each area gives an indication of direction of movement and market sentiment.
3. White descending triangle. This is a bearish pattern. One line connects series of lower highs and second line connects series of lows.

ETHGBP T.A. Im currently not trading as a want to allow the market sometime to orientate itself. Currently for me the market is too violitile, hence why I have completed this long-term T.A.


BTC 17.02.20 Bullish Into March 🚀🌘Doward trend in red parallel channels. Into green trend from jan into the new year
