HolderStat┆ETHUSD seeks to $3200KUCOIN:ETHUSDT surged after breaking out of a triangle and pushing through multiple resistance levels. The latest move above $2,900 confirms a bullish continuation, with $3,200 as the next major zone. Consolidation below resistance has built the base for the current rally.
ETHUPUSDT trade ideas


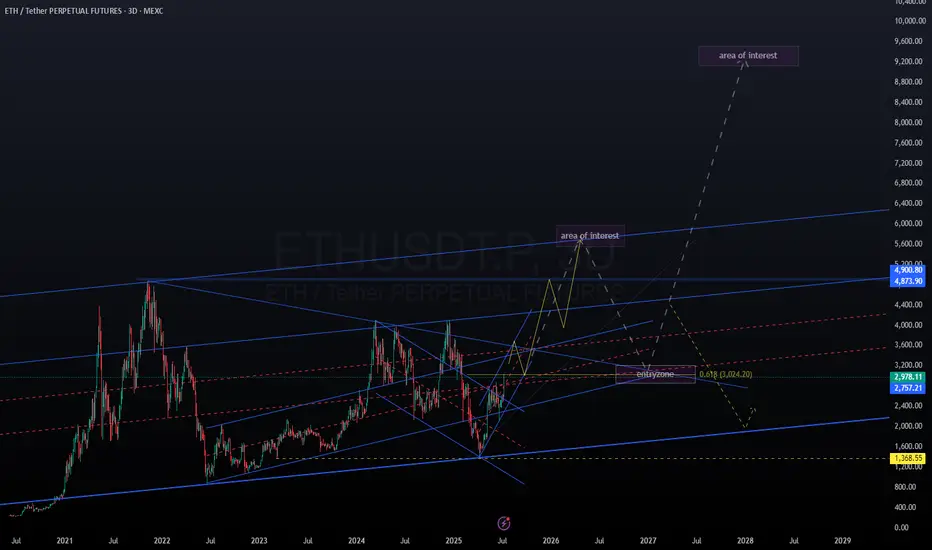
ETH long term outlook 2025-2028 (crystal ball version)Based on time fibs and fib projections.
No financial advice.
If ETH pushes up, looking at a pull back starting early to mid september, then retrace to 0.5 fib and push up into dec. After which possibly come back and test the 4k area where price broke out from. Next push up with a top in Mar/April.
The next is purely speculative (as is this whole post).
Deep retrace after local top in April26, to the 3k level.
If price finds support at 3k, then the next leg up has a chance at 9k end of 2027, Jan 2028.
Otherwise, if support doesn't hold, continuation down into bear market.
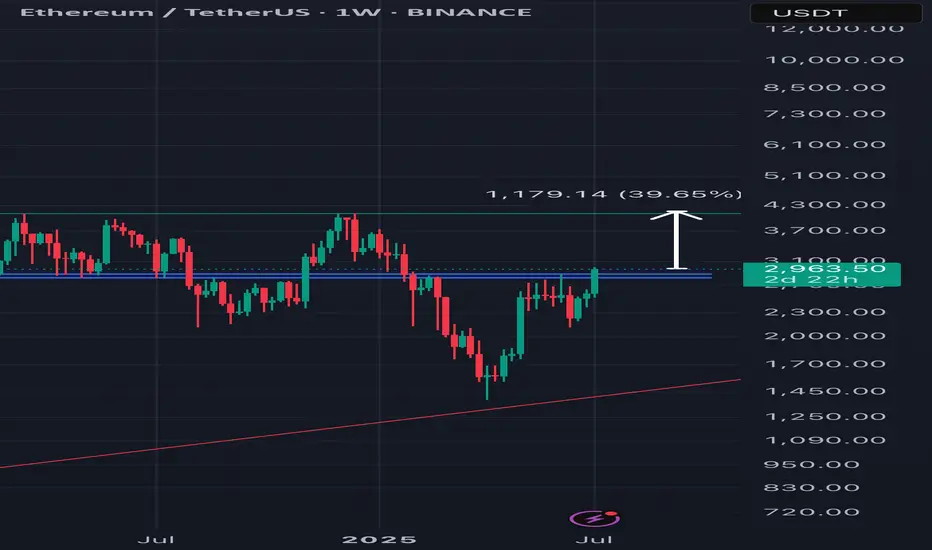
Ethereum (ETH): Strong Breakout Happened | Targeting $3200-3300 Ethereum had a strong breakout, and we are getting closer and closer to our major target of $3200-3300.
A smaller target of $3000 has been reached and we see that after smaller rejections, buyers still keep the pressure, so our major target remains the same
Swallow Academy

ETHUSDTHere is a great move for ETH after a long time.
So I can recommend some levels to trade and bullish move has been started.
good luck
DYOR!

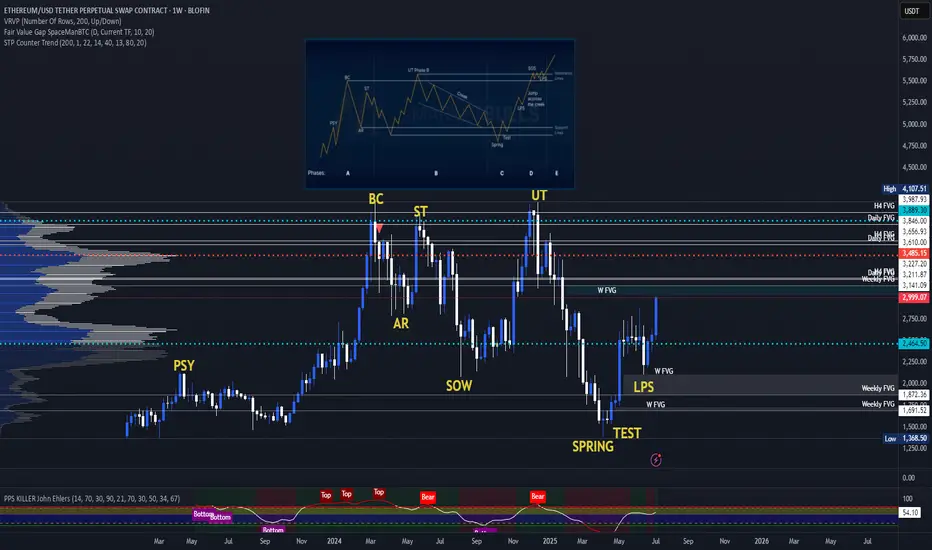
ETH Wyckoff Re-AccumulationETH (and many of the major altcoins) has a macro re-accumulation going on right now. The targets would be well beyond our current all-time highs. There has been a lot of bullish news recently with large investors buying heavily into ETH, which should act as a catalyst to jump-start the mark-up phase of this re-accumulation and "Jump Across the Creek" as they say.
ETH New Analysis (12H)This analysis is an update of the analysis you see in the "Related publications" section
The previous analysis is still valid | its timeframe is higher, but in this update, we've moved to the lower timeframes.
It seems a valid bottom has been formed on Ethereum, and we may not see a lower low, provided that the price doesn't move higher first but instead drops directly into our support zone. If that happens, the price could potentially move upward from there.
Ethereum seems to be searching for a support zone to reach higher levels. The marked area could potentially launch the price upward.
In this analysis, the support zone, targets, and invalidation level have been updated.
For risk management, please don't forget stop loss and capital management
When we reach the first target, save some profit and then change the stop to entry
Comment if you have any questions
Thank You

ETH Long / Buy SetupAs of many times mentioned that, will short eth above 3k or 3k, but it still shows Bullish momentum no sign of weakness, maybe this entry triggers during weekend due too low volume, search for ifvg, if any 1D or 4hr Bullish fvg truns into bearish ifvg then will take short on ETH. For now will take long with SL and proper risk management.

EthusdEasy target here if it can keep pushing above 3k and the weekly ends above it it will sure go to 4k where is a good point to sell . Alt season it’s starting now
Ethusdt bullish cup and handle dailyEthusdt is forming a big cup and handle pattern in daily time frame. A close above 2850 in daily time frame may activate the pattern.
Targets are 3300, 4000 and 5500
Pattern invalidation: A close below 2100

Long trade
ETHUSDT 4H Chart Analysis
Date: Sat 05th July 2025, 4:00 PM
Session: London to NY AM
Key Trade Details
Entry: 2,515.17
Profit Target: 2,864.44 (+13.89%)
Stop Loss: 2,479.01 (−1.43%)
Risk-Reward: 9.66
Key Reasons for the Trade:
Bullish Breakout above 2,515, supported by strong volume surge.
Price Above EMA & WMA: Clear trend confirmation.
Strong Momentum: The RSI is overbought, indicating bullish strength, but watch for a potential short-term pullback as the price approaches resistance.
Target Zone: Prior resistance cluster at 2,820–2,860.
Current RR in Play: Trade already moving

$ETH: The 1-week chart is an absolute disaster!Once again, I want to make it clear: I’m naturally a bull. But I live in Thailand, far from the noise of influencers shouting "buy, buy, buy!" I’ve learned my lesson—when they scream buy, you get rekt. That’s why I rely solely on the charts.
Charts are just mathematics—they don’t lie. So here’s my honest interpretation of what I’m seeing for Ethereum:
🕐 Daily Outlook
Yes, we might see a few nice bounces in the short term. But if your plan is to hold ETH, you should be paying attention to higher timeframes, especially the weekly.
📉 Weekly Chart — It's Ugly
We’re clearly in a descending wedge, and overall, ETH is bearish. Don’t be fooled by the hype or the people trying to take your money.
- RSI is bearish, with a strong bearish divergence still unfolding.
- MACD is on the verge of a bearish crossover, and what’s worse, it’s doing that without even touching the neutral zone—a major red flag.
The last time we saw this setup? November 2021. The price crashed below $1,000.
🔍 Where’s the Support?
This cycle, the support zone looks closer to $1,500, mainly due to institutional interest and the ETF narrative. A full retracement seems unlikely, but technically speaking—it’s still a possibility.
🤔 Why Is This Happening Despite Institutional FOMO?
Here’s the key: ETH has staking, and every month, new CRYPTOCAP:ETH is minted to pay stakers. This creates constant inflation. On top of that, many stakers compound their rewards, accelerating the inflation. And guess what? These same stakers are selling as soon as ETH pumps.
So fundamentally, Ethereum is under pressure because of its own staking mechanics—a system flaw that creates long-term selling pressure.
Do your own research (DYOR). I could be wrong—but at least I’m not trying to sell you a course.

$ETHUSDT: Uptrend signal in the daily timeframeEthereum is ready to move higher, as I anticipated when the BINANCE:ETHBTC signal flashed...
Best of luck lads!
Cheers,
Ivan Labrie.

ETH Needs big money injection ASAPRising wedge presented in the chart is a bearish pattern.
To cancel this bearish pattern we need :
- Break the $2,800 level with bigh green candle
- The break should occur with big volume
- The break should be as soon as possible.
Otherwise, the downtrend will continue and he decline will be sharp.
COINBASE:ETHUSD BITSTAMP:ETHUSD CRYPTOCAP:ETH CRYPTOCAP:ETH.D

Ethereum & monthly 20MAEthereum is gaining strength and will likely break above the monthly 20 MA. Will it maintain this momentum by month's end and remain bullish in the coming months?
Good luck HODLRS ✌️🤞

ETH Pullback Before Next Rally? Hello guys!
Ethereum is currently testing a strong resistance zone around the $2,678 level, which has previously acted as a key barrier. Price action has been climbing steadily within an ascending channel, indicating a clear bullish trend in play.
However, since ETH is right at the resistance, we could see a short-term correction or pullback toward the $2,560–$2,580 support range (highlighted zone), which also aligns with the midline of the channel and previous consolidation structure.
If this support holds, a healthy bounce from this area would likely push ETH toward the next bullish target around the $2,760–$2,800 zone, which sits near the upper boundary of the current channel.

ETH BREAKING OUT?Ethereum is making a strong weekly push into resistance around $2,817 – a key level that acted as support throughout 2023 before flipping to resistance in early 2024. Price is now testing this zone after a steady string of higher lows, and the move is backed by increasing volume, signaling genuine momentum. ETH has already reclaimed its 200-week moving average and is now challenging the 50-week MA from below. A weekly close above both would mark a major technical shift, suggesting the end of a long consolidation phase and the potential start of a sustained uptrend. If bulls can push decisively above this level, the next major target sits near $4,093. For now, all eyes remain on whether Ethereum can reclaim this final resistance before the path higher opens up.

HolderStat┆ETHUSD retest of the resistance lineBINANCE:ETHUSDT has exited a falling wedge and is forming a bullish continuation pattern. With price action building above $2,500, a breakout toward $2,800 is in play, targeting the supply zone around $3,000. Structure favors bulls.

ETHEREUM BREAKOUT CONFIRMED!Hey Traders!
If you’re finding value in this analysis, smash that 👍 and hit Follow for high-accuracy trade setups that actually deliver!
After months of consolidation inside this massive symmetrical triangle, ETH finally breaks out on the daily chart—and this could be the spark for the next major rally! 🔥
📈 Structure: Symmetrical Triangle
✅ Breakout Confirmed
📍 CMP: ~$2,760
🎯 Next Major Target: $5,000+
This is the breakout bulls have been waiting for! If momentum sustains, ETH could enter price discovery territory soon. Buckle up—the real move might just be beginning. 🚀
Let’s see how far it runs from here!
Drop your targets in the comments 👇

ETH Price Forecast: Keep Bullish Above 2519ETH Price Forecast: Keep Bullish Above 2519
Finally, ETH is holding strong above 2520. Over the previous days, ETH lost momentum and was about to invalidate the pattern, as it reached 2475.
However, the uncertain situation from geopolitical tension and tariffs is still supporting the bulls on the crypto market.
On the other hand, ETH still has room for growth and as long as the price respects this flag pattern, the chances of ETH rising further remain high despite the developments in BTC.
You may find more details in the chart!
Thank you and Good Luck!
PS: Please support with a like or comment if you find this analysis useful for your trading day

ETHUSDTThis is very easy...
best support level 2300 to 2500 for jump price. but was needed for jump price for get enrgy for movement to high levels by fake breakout.
First level of resistance 2800 to 3000.
⚠️Control Money Management in your capital.

Ethereum Analysis – Vitalik’s Gas Cap Proposal Adds PressureToday, I want to show you the possible moves for Ethereum ( BINANCE:ETHUSDT ) this week.
Please stay with me .
Let’s first take a look at the important news that has come for Ethereum in the last 24 hours :
Ethereum’s Gas Cap Proposal Sparks Concerns
Ethereum co-founder Vitalik Buterin recently proposed EIP-7983 , introducing a gas limit cap to prevent potential DoS (Denial of Service) attacks on the network.
Bearish Takeaways:
This proposal reveals a current vulnerability in Ethereum’s infrastructure. If gas limits grow unchecked, nodes may fail to sync, leading to possible network instability.
Imposing a gas cap could temporarily reduce transaction throughput, affecting DeFi protocols and NFT platforms that rely on Ethereum’s scalability.
The market tends to react cautiously to core protocol changes, and this uncertainty could trigger short-term selling pressure.
Bullish Counterpoints:
The cap aims to strengthen the network’s long-term stability against spam and DoS attacks.
It’s still in the proposal stage, with no immediate impact on users or network performance.
Conclusion:
While the long-term impact may be positive, the short-term uncertainty and exposed risks provide a bearish narrative for Ethereum, especially amid growing competition from alternative chains.
--------------------------------------
Now let's take a look at the Ethereum chart on the 4-hour time frame .
Ethereum is currently trading near the Heavy Resistance zone($2,929-$2,652) and Resistance lines , and is also trying to break the Support line .
In terms of the Elliott Wave theory , it seems that Ethereum has completed the Zigzag Correction(ABC/5-3-5) , so we can expect the next bearish wave .
I expect Ethereum to fall to at least $2,433 AFTER breaking the Support line, and if the Support zone($2,491-$2,323) is broken, we should expect further declines.
Second Target: $2,374
Note: Stop Loss (SL) = $2,689= Worst Stop Loss(SL)
Please respect each other's ideas and express them politely if you agree or disagree.
Ethereum Analyze (ETHUSDT), 4-hour time frame.
Be sure to follow the updated ideas.
Do not forget to put a Stop loss for your positions (For every position you want to open).
Please follow your strategy and updates; this is just my Idea, and I will gladly see your ideas in this post.
Please do not forget the ✅' like '✅ button 🙏😊 & Share it with your friends; thanks, and Trade safe.

Ethereum (ETH): $2800 Reached | Targeting $3200-$3300 NowEthereum did a really good bounce from the local support area, where buyers still keep the momentum as of now.
As our target got reached, we also noticed that buyers are not reducing the pressure to the resistance zone, which means most probably we are about to break out from that smaller sideways channel.
If we see a break from here, our target is set to $3200-$3300.
Swallow Academy
