ETH Forming Bullish AB=CD Pattern | Eyes on Breakout #Ethereum (ETH) is showing strong bullish momentum on the 4H timeframe and is currently developing a classic AB=CD harmonic pattern, which often precedes a continuation of trend.
✅ Key Observations:
#ETH is holding within a solid uptrend structure
No signs of bearish divergence or reversal patterns yet
Momentum remains healthy, with buyers in control
🔍 What to Watch For:
We are closely watching the previous Higher High (HH) — currently acting as a key resistance level. A 4H candle close above this level will serve as confirmation for the continuation of the bullish trend.
📈 Trading Plan:
Once #ETH breaks above the resistance and confirms with a close, we’ll look to enter a long position with proper risk management and stop-loss placement below recent structure.
💬 What’s your bias on #ETH in the short term? Are you already long, or waiting for the breakout too?
📌 Don’t forget to Like, Comment, and Follow for more clean setups and strategy-based analysis!
#ETH #Ethereum #CryptoTrading #ABCDPattern #TechnicalAnalysis #Harmonics #TradingSetup #Breakout #PriceAction
ETHUPUSDT trade ideas

Ethereum (ETH): Buyers Taking Back Control!Ethereum had a nasty fall both on Sunday and Saturday where price dipped from $2500 to $2100.
Despite that movement took place during the weekends it was harsh one and we are expecting osme kidn of re-test to happen towards the local broken area (near 200EMA).
Swallow Academy

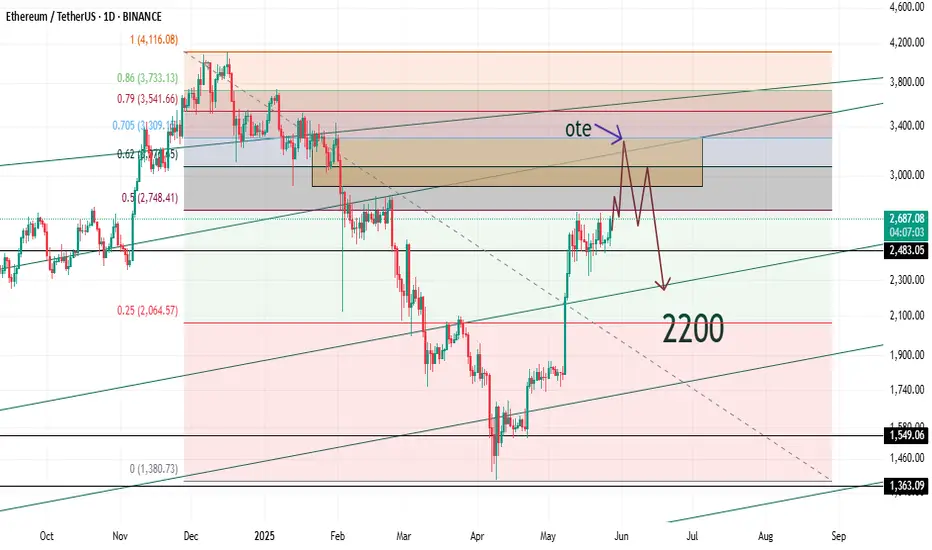
"Trap Ahead : Liquidity has a Price"Everyone’s screaming “bull market!” again…
Yeah, until the market humbles them—like always.
Let me walk you through what’s actually happening:
ETH is headed for a flashy detour to $3,300
—everyone’s gonna feel rich for a second.
Then?
Down she goes. Straight below $2,300.
Trust me, euphoria has a price.
Meanwhile, BTC is dressing up for above $113,500.
But don’t fall in love with the pump—it’s not here to stay.
That move? Just enough to get everyone trapped.
Next stop: sub-$93K.
Yup, the wolf said it.
This market doesn’t care about your hopes.
It rewards the patient, and devours the emotional.
Liquidity is the meal. You’re either the hunter… or the feast.
Follow Alpha Sigma Wolf
If you’re tired of hopium and want clarity instead.
Because I don’t do “maybe.”
I do moves.
Let the sheep cheer. We’ll be waiting.
#SMC #SmartMoney #CryptoAnalysis #ETH #BTC #AlphaSigmaWolf
Ethereum (ETH): Lost Control Over 200EMA Ethereum has lost control over the 200EMA, where we had a strong sell-side movement due to the US news.
As this was the movement during the weekends, now we are looking for recovery to happen at least a couple of days from now on, which would mean that buyers will take back the control over the 200EMA.
This line will decide the next major trend area for the coin!
Swallow Academy

ETH shortETH looking weak after failing to reclaim 2,250. Eyeing a short entry here with targets at
2137 and 2100. Stop-loss above $2325. Trend still bearish—don’t catch a falling knife! #ETH #CryptoTrading #BearishSignal

Ethereum Price Reversal ? $2100 Support & Altcoin Season OutlookAfter an extended period of consolidation, Ethereum (ETH) has finally retested the critical support level of $2,100, which aligns closely with the 0.5 Fibonacci retracement level of the bullish trend that began in April. This confluence of technical factors strengthens the validity of this level as a strong demand zone.
The price action suggests that ETH may be gearing up for a bullish reversal, as it respects both horizontal support and key Fibonacci structure. Historically, the 0.5–0.618 retracement zone acts as a high-probability reversal area in trending markets, particularly when accompanied by volume stabilization and long-tailed candles on the daily chart.
Trade Plan: Spot and Futures Positions
Given the current structure, this presents a favorable opportunity to accumulate ETH on spot for the anticipated altcoin season. In addition, leveraged long positions in futures can be considered with clearly defined risk parameters.
Entry Zone: Around \$2,100
Stop Loss: \$2,000 (below key support)
Target Levels:
Primary Target: $2,500 (previous resistance / psychological level)
Secondary Target: $2,600 (major structure high)
The risk-to-reward ratio remains attractive, particularly if the broader crypto market continues its uptrend and Bitcoin maintains stability.
Market Context
Broader macro sentiment and the dominance cycle suggest capital rotation into altcoins could be near. With Ethereum leading major Layer 1s, a recovery from this level could catalyze a wider altcoin rally**, making this an important zone to watch for both intraday traders and swing investors.
⚠️ Note: Due to ongoing geopolitical tensions between Israel, Iran, and the United States, global financial markets—including crypto—may experience heightened volatility. Traders are advised to manage risk carefully and avoid overleveraging during uncertain macro conditions.

Using PAR indicator to find divergence gaps to find clues of PA Using PAR indicator to find divergence gaps to find clues of PA

MACD Divergence Flashing Red, Could This Trigger a -30% Crash?Hey Realistic Traders!
Bearish Reversal Signal Flashing on BINANCE:ETHUSDT , Is the Bull Run Over?
Let’s Break It Down..
On the daily timeframe, Solana (SOL) has formed an ascending broadening wedge, which has now broken to the downside through both the lower trendline and a major support zone, indicating a shift in market structure.
Price action has also remained consistently below the 200-day EMA, signaling a potential transition from a bullish to a bearish trend.
A bearish divergence has appeared on the MACD indicator, where price makes higher highs while the MACD forms lower highs. This divergence indicates that buying momentum is weakening, even as the price pushes higher. Such a pattern often precedes a trend reversal and supports the expectation that the price may continue to move lower.
Given these technical signals, the price is likely to continue moving lower toward the first target at 1849.07, with a possible extension to the second target at 1534.44.
This bearish outlook remains valid as long as the price stays below the stop-loss level, currently marked at 2734.40. A move above this level would invalidate the bearish setup.
Support the channel by engaging with the content, using the rocket button, and sharing your opinions in the comments below.
Disclaimer: "Please note that this analysis is solely for educational purposes and should not be considered a recommendation to take a long or short position on ETHUSDT.

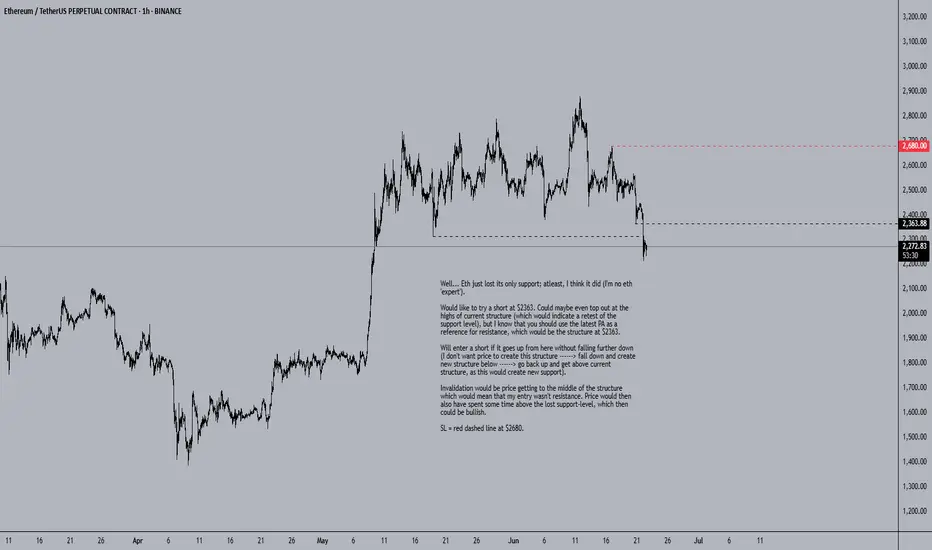
ETH Short SetupWell... Eth just lost its only support; atleast, I think it did (I'm no eth 'expert').
Would like to try a short at $2363. Could maybe even top out at the highs of current structure (which would indicate a retest of the support level), but I know that you should use the latest PA as a reference for resistance, which would be the structure at $2363.
Will enter a short if it goes up from here without falling further down (I don't want price to create this structure ------> fall down and create new structure below ------> go back up and get above current structure, as this would create new support).
Invalidation would be price getting to the middle of the structure which would mean that my entry wasn't resistance. Price would then also have spent some time above the lost support-level, which then could be bullish.
SL = red dashed line at $2680.
Still in the range(box of triangle)Keep an eye on candle pattern.
Especially, week candle.
( Hint🤫, No lower shadow(wick) usually makes price action. But there is high probability to make one more dip )

ETH Weekly – Eyes on $1900When panic creeps in, zoom out.
ETH on the weekly has lost both the 200MA and the 0.5 Fib.
In my opinion, if the BB center doesn’t hold here, price could retest the 0.618 Fib level a zone it tends to flirt with often.
The $1900 area might become a solid buy zone.
Always take profits and manage risk.
Interaction is welcome.

ETHEREUM for $750?In this chart, I am showing you the worst possible scenario. If we compare this cycle to the past, we see some very similar things on the weekly chart:
- Weekly RSI divergence
- Testing the 50-level RSI and the trend line from the bottom to the top
- Correction to the 0.5 fibbonacci level.
- Last time we had a war between Ukraine and Russia and now we have a war between Israel and Iran
- Last time everyone on X(twitter) was talking and cheering about Alt-Seoson and ToTheMoon and now we have the same situation, DYOR, check X
$750-800 for Ethereum are the lows of the two global channels. So it's a logical bottom. And after the price reaches the bottom, we can reach the top of the channel.
Hence after this mega-dump we will see #ETH at $18000-20000.
What do you think about this scenario?

ETh more dump to $2100-$2030Just recently hopped into ETH short. Aiming for $2100 to $2030
Market is correcting on the weekly tf and this is a probably area that it might use to create the new HL for continuation back up.
Time sensitive.
Stop: $2235-$2245 area. $2245 is safer a bit lower RR though.

Pullback and DownHi there!
We have a nice pattern and very clear also. We should take care about BTC movement if we trade ETH or any other ALT coin!
Our main target is very clear ABC Fibonacci extension 161,8 and Fibonacci retracement 61,8 and HH of previous cycle! Sure, under this cluster level is a liquidity zone where you can make new cheap buys :-).
Good luck traders!

ETH Bearish Retest – Heading to $900?Description:
On the weekly chart, ETH has once again failed to break back above the long-term ascending trendline that started in 2020. After losing this trendline support earlier, price is now treating it as resistance — a textbook bearish retest.
The market reaction suggests weakness, and the lack of strong volume on the upside raises concerns about buying momentum. If this structure holds, we might be looking at a broader correction in play.
📉 Key Observations:
• Bearish rejection from the multi-year trendline.
• Structure resembles a lower high formation.
• Weak volume on bounces, showing hesitation from bulls.
🔍 I’m personally watching the $1,000 zone as a potential magnet if downside pressure builds. Some may even expect a retest of the $900 range — not a prediction, just a scenario.
💬 What do you think? Are we headed for a deeper flush or is this just a trap before a breakout? Drop your thoughts ⬇️
#Ethereum #ETH #CryptoWeekly #TechnicalAnalysis #Trendline #BearishSetup

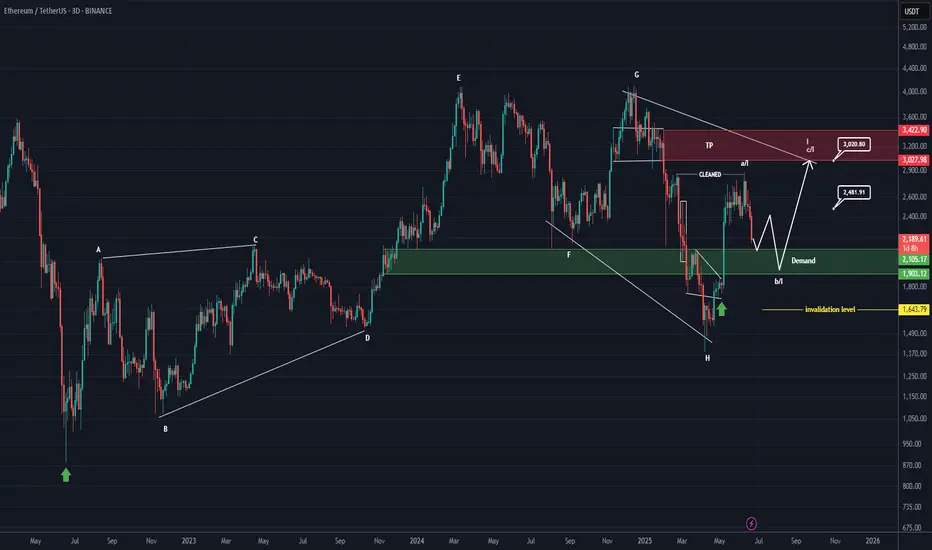
ETHEREUM Analysis (3D)First of all, pay close attention to the timeframe | it's a higher timeframe.
From the point where we placed the green arrow on the chart, Ethereum appears to have entered a bullish phase | specifically, a symmetrical pattern.
It currently seems to be in wave I of this symmetrical structure, which is the final wave. Wave I itself appears to be composed of three parts (ABC). At the moment, Ethereum seems to be in wave b of wave I.
We expect wave b of I to complete within the green zone, after which the price would move into wave c of I.
The price seems inclined to complete wave b of I near the bottom of the green zone.
Targets are marked on the chart.
In the green zone, it’s no longer reasonable to look for Sell/Short positions, especially when the price is approaching the bottom of the green area.
A weekly candle close below the green zone would invalidate this analysis.
For risk management, please don't forget stop loss and capital management
When we reach the first target, save some profit and then change the stop to entry
Comment if you have any questions
Thank You
ETHUSDT LONG POSITION ENTRY: 2582.66
TAKE PROFİT : 2770.95
STOP LOSS : 1/3
Do not use high leverage!
Remember cash management (planning)!
Please follow the stop-loss rule!

ETH/USD Weekly | The Full Breakdown – Structure, Spring, and Set
This is my full Ethereum weekly chart analysis — not just what I think might happen, but a walk-through of everything I’ve mapped and labelled, based on how price has behaved since the 2021 top.
Every structure you see here is there for a reason — from the symmetrical triangle and wedge, to the Wyckoff schematics, Elliott wave flow, Spring, and more. What we’re seeing now, in my opinion, is the end of a three-year macro compression. The move that follows could define the rest of this cycle.
Let me take you through it.
After the all-time high in late 2021, Ethereum entered a structured, controlled decline. Not a crash — but a step-by-step transition through market phases. Price dropped and bottomed into a clear accumulation phase — that’s the first box on this chart, labelled as “Accumulation (cause)”. This is where smart money started taking positions, confirmed by the Spring down to 0 and the base of the move at point 2. From there, price consolidated, gained strength, and then jumped the creek — a clear breakout above the accumulation range, which gave us the confirmation for markup.
The markup phase took us from that Spring up into a five-wave impulsive move, peaking around the distribution zone. You can see it clearly — labelled Distribution, and boxed off between points A, B, C and the final wave 5. This rally failed to make new all-time highs, stalled, and was rejected cleanly. From there, we rolled over and started losing structure — and this is where it gets important.
Right after distribution, we got a breakdown I’ve labelled “Break The Ice”. This wasn’t just another dip. It was the moment we lost all structure from the markup — the line that had held the previous lows snapped, and volume stepped in. This is often the first real signal that we’ve entered the markdown phase. From a Wyckoff perspective, this breakdown is what separates Phase D from the start of a new accumulation cycle. It’s aggressive, deliberate, and clears out late longs — and that’s exactly what it did here.
Following that breakdown, we formed a new falling wedge — drawn from the top of the markdown all the way to the most recent lows. Price was making lower highs and lower lows, but with less aggression and momentum weakening. This wedge sits inside the larger symmetrical triangle, which has been developing ever since the 2021 top. The apex of this triangle, marked around $2,496, is where I believe everything will come to a head. Break that with conviction — and we could start a whole new macro leg.
But before we get there, something happened worth pointing out. That final breakdown inside the wedge? The one that dipped below and quickly reclaimed? That, for me, was the Spring. It’s labelled in yellow as “Spring” under point D. And it matches the Wyckoff schematic almost perfectly. Volume dried up on the move down. RSI and CCI both showed divergence. Then price bounced hard, reclaimed structure, and we’ve held ever since. This doesn’t look like continuation — it looks like a trap.
If that Spring holds, then we’re now in the Sign of Strength (SOS) phase. This is the moment where price reclaims its mid-structure levels, consolidates, and prepares for the breakout. We haven’t broken out yet — but the groundwork is in place.
My Elliott count also lines up. We had a 5-wave impulse from the Spring to the failed rally, followed by an ABC correction. What we may now be seeing is the completion of another Wave 2, setting up for a possible Wave 3 — the strongest wave of the cycle, if confirmed.
Now let’s talk entries. I’ve got my eye on the $2,130–$2,030 region. That’s where I’m placing my DCA bids. It’s the area just above the Spring reclaim zone, where price should react again if we retest. If we lose $1,690, I consider the Spring invalidated and will reassess. That’s my clean risk level.
Break and hold above $2,496, and the breakout is confirmed. That level is not just the wedge and triangle resistance — it’s also the psychological midpoint of this whole macro structure.
Everything’s mapped. Structure is clean. Volume is drying up. Momentum is shifting. And price is compressing right into the apex.
This isn’t a moment to chase. It’s a moment to plan.
If we break out, I’m ready to scale in. If we reject, I’ll be watching the DCA zone and the Spring level closely. Either way, I know what I’m looking for — and I know what invalidates the setup.
Let’s see what price does next.


Ethereum at a Critical Support Zone Ethereum Weekly Analysis – Long-Term Perspective
Ethereum is currently experiencing significant bearish pressure and has dropped into a major support zone on the weekly chart. If this critical support breaks, the next key target would be around $2,055, where the price aligns with a long-term ascending trendline, acting as a possible reversal zone.
However, if ETH manages to defend this area and confirms bullish weekly candle closures, we may see a potential recovery toward:
$2,278 as the first resistance
Followed by $2,435 as the next upside target
📌 All support and resistance levels shown in the chart are key decision zones that traders can use for entries, exits, or managing positions.
🧠 Don’t forget to follow for consistent long-term insights and clean technical setups like this.

Wait for ETHETH faced rejection at the weekly resistance near $2,700.
Price is likely to retest the current weekly support around the $2,100 zone.
Patience is key—wait for ETH to reach this support area before considering entry.
Disclaimer:
This analysis is based on my personnal views and is not a financial advice. Risk is under your control.

ETH NEW UPDATE (8H)This analysis is an update of the analysis you see in the "Related publications" section
After the pump and hitting the red zone, it got rejected.
It's better not to open a short position on Ethereum, as its dominance appears bullish | which means it might be resilient against a potential drop.
The closing of a daily candle above the invalidation level will invalidate this analysis.
For risk management, please don't forget stop loss and capital management
Comment if you have any questions
Thank You

