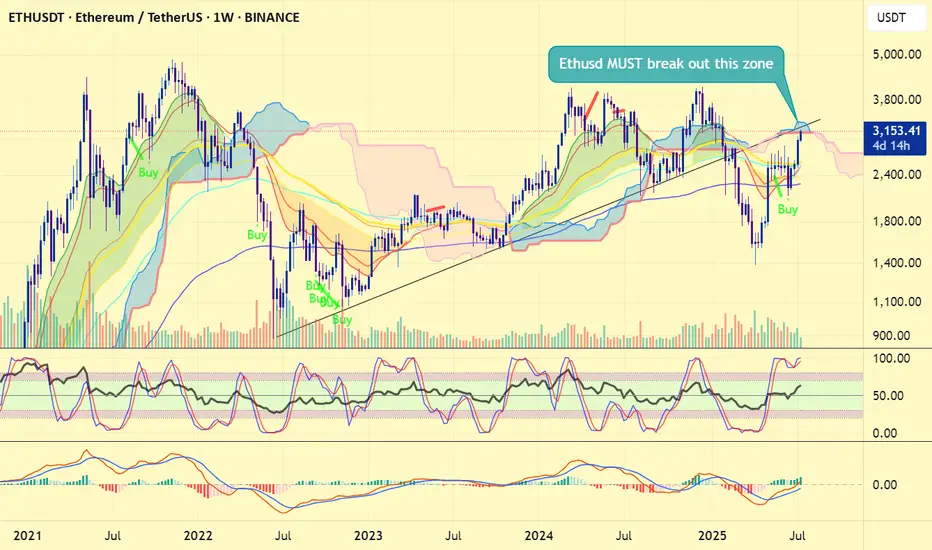
ETH Building Blocks - Keep it Simple🧱 Building Block - ETH Weekly Analysis 🧱
Ethereum has been trading within a well-defined structure, respecting key horizontal zones — each acting as a crucial building block in ETH’s macro journey.
🔹 Zone 1 ($1,700 - $2,100)
A strong demand and accumulation zone. ETH bounced from here multiple times, proving itself as the foundation of the current bullish attempt.
🔹 Zone 2 ($2,400 - $2,600)
We're currently hovering around this key mid-range resistance. A successful break above it would pave the way for the next major leg up.
🔹 Zone 3 ($2,900 - $3,400)
A major historical resistance turned supply area. ETH needs strong momentum and volume to break through this ceiling.
🔹 Zone 4 ($3,800 - $4,200)
The final building block before retesting ATH territory. A retest here could signal full bullish control in the coming months.
📍 As long as Zone 1 holds, ETH remains structurally bullish. Watch for breaks and rejections at each building block to gauge the next move.
Which block will ETH break next? 🔮
📚 Always follow your trading plan regarding entry, risk management, and trade management.
Good luck!
All Strategies Are Good; If Managed Properly!
~Rich
ETHUPUSDT trade ideas

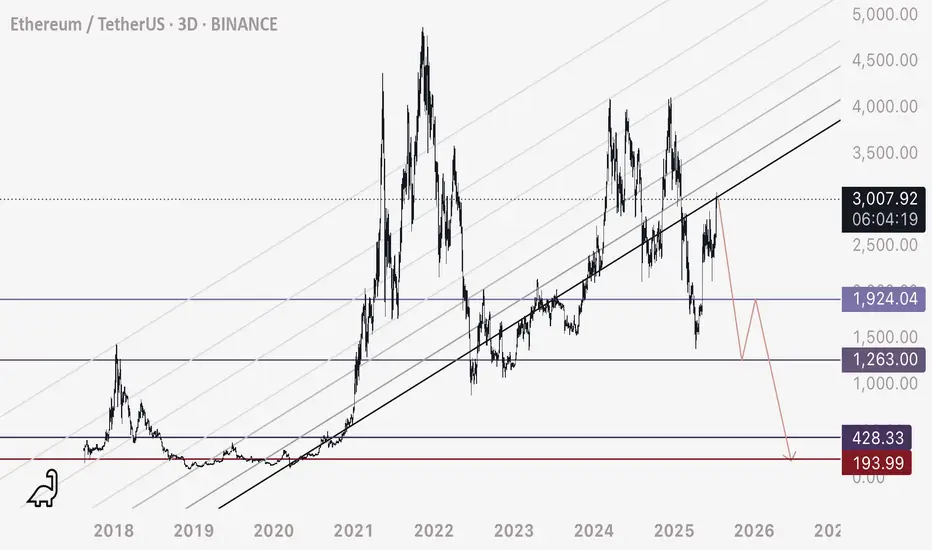
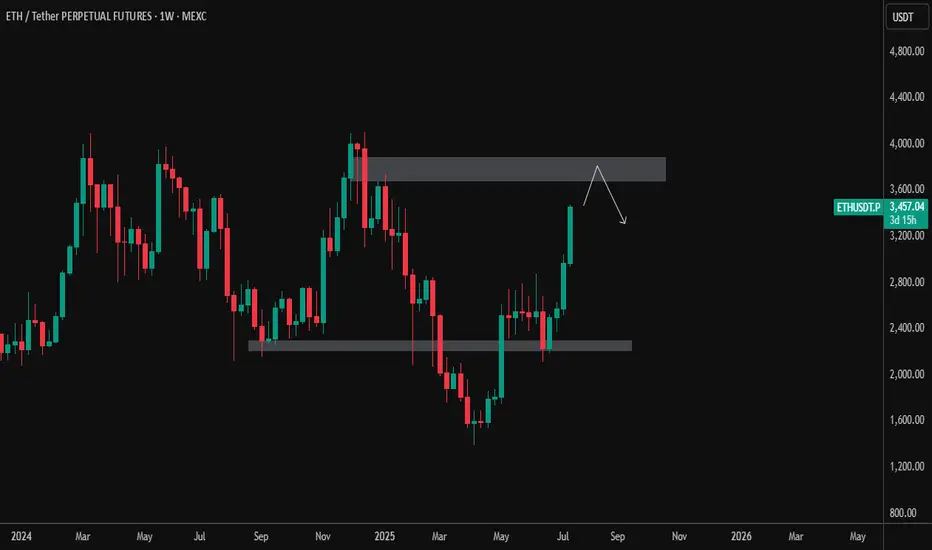
ETH - Potential Cycle Top hereETH is showing a potential cycle top per this parallel ascending channel.
Resistance would be around 3020 zone - if the channel breaks down, we may see these ultra low zones get hit if the macro landscape supports such a drastic fall.
Happy trading.
NEoWave Analysis of Ethereum 2025 Cash data chart shows that Ethereum is in a corrective phase and the wave structure from (A) to (C) has been completed. Initially, we expected a flat pattern to form; however, the wave structure-(C) was not an impulse and the flat was not confirmed.
As a result, given that the wave structure (A)-(B)-(C) is corrective and the waves differ in time, it seems that a contracting triangle pattern is forming and we are currently in wave-(D) of this triangle. Furthermore, wave-(D) could rise to $3630-3880 and end. Then a price correction in the form of wave-(E) may occur. This correction could end between $2900-3086 and if this range is broken downwards, wave-(E) could decline to $2000-2230, after which the main bullish move for Ethereum is expected to begin.
Good luck
NEoWaveChart

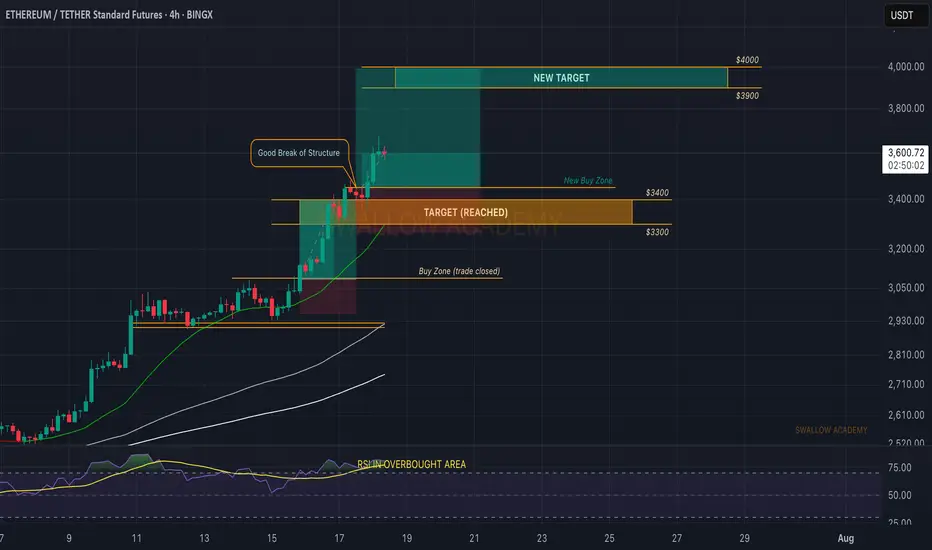
Ethereum (ETH): Buy Entry 2 Reached | $3300-$3400 IncomingNo remorse from buyers on ETH, where the price is pushing further and we are looking now at our new target, the $3300-3400 area, to be reached within this week.
There is not much more to talk about here, other than that we keep our bullish view (that we shared on a weekly timeframe).
Time for Ethereum to shine.
Swallow Academy

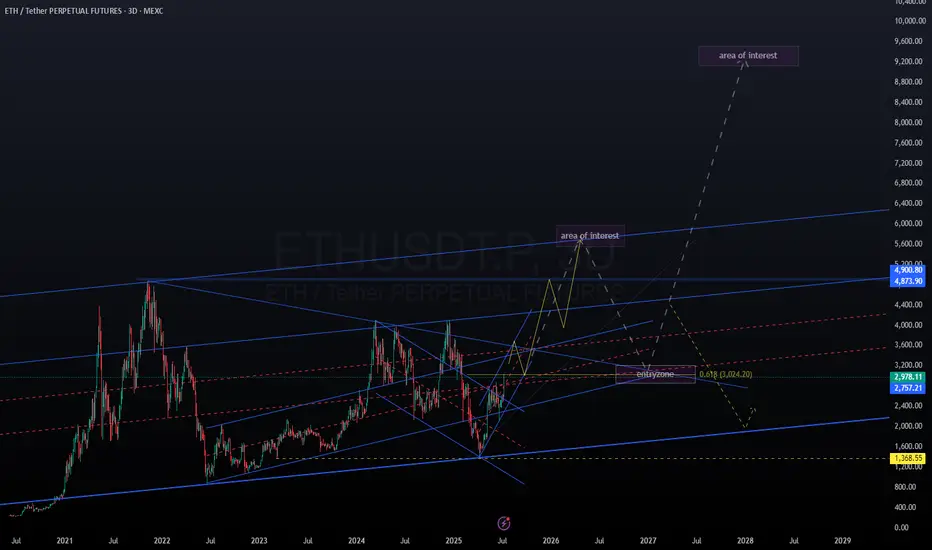
ETH long term outlook 2025-2028 (crystal ball version)Based on time fibs and fib projections.
No financial advice.
If ETH pushes up, looking at a pull back starting early to mid september, then retrace to 0.5 fib and push up into dec. After which possibly come back and test the 4k area where price broke out from. Next push up with a top in Mar/April.
The next is purely speculative (as is this whole post).
Deep retrace after local top in April26, to the 3k level.
If price finds support at 3k, then the next leg up has a chance at 9k end of 2027, Jan 2028.
Otherwise, if support doesn't hold, continuation down into bear market.
ETHEREUMEthereum Approximately $2,967.55 per ETH, watch for 30754 ascending trendline breakout or pull back into 2680 zone ,if we keep buying then 4100 zone will be on the look out as immediate supply roof break and close will expose 4900.my goal in this context is to see ETHUDT buy into my purple supply roof,it will happen .
Market Capitalization: Around $358 billion, making Ethereum the second-largest cryptocurrency by market cap.
Circulating Supply: About 120.7 million ETH.
Recent Performance: Ethereum has gained roughly 17.3% over the past week and about 7% over the last month, though it is down about 4% compared to one year ago.
Market and Technical Overview
Ethereum remains a key player in the blockchain ecosystem, supporting decentralized finance (DeFi), NFTs, and smart contract applications.
The price is consolidating near the $3,000 level, with technical indicators suggesting moderate bullish momentum but some short-term volatility.
Trading volume in the last 24 hours is around $29 billion, indicating strong liquidity and active market participation.
Ethereum continues to be a foundational blockchain platform with strong institutional interest and ongoing development, maintaining its position as a major digital asset in 2025.
#ethusdt #btc #bitcoin

Ethereum (ETH): Will Overtake The Bitcoin Soon? Ethereum has been moving much better compared to Bitcoin, which confirms our theory that ETH will now head for its ATH, just like Bitcoin did before.
We are looking for further movement to $4000 area, but be careful as we are entering weekends market, we should keep an eye on our entry area.
Volatility can happen but nevertheless, we are very bullish on ETH.
Swallow Academy
From now on, be careful!!Hello friends..
We are back with a new analysis of the Ethereum cryptocurrency, from the area I had previously specified, we are currently in profit by about 120%. (We gave a buy signal to the good cryptocurrencies in the market at the peak of market disappointment, you can enter the page to view.)
Now we have reached the resistance area where correction is possible, there is a strong resistance from the $3400 to $3600 area, you can sell 50% of your assets in this area if confirmed and add to your assets if corrected (I will indicate the buy areas in the next analysis).
If you have a cryptocurrency that you want us to analyze for you, you can write the name of the cryptocurrency in the comments, and wait for the analysis post (priority is given to the cryptocurrency that gets the most likes)
Don't miss our page in these bullish days of the market. (You won't lose

Ethereum (ETH): Time For Ethereum To Shine | $3300-$3400The daily timeframe is showing no remorse to sellers, with buyers strongly dominating the zones after a local resistance area near $2800 was broken.
After that breakout we had a smaller sideways consolidation movement, here we formed a proper BOS and now price is heading towarsd the upper zones. we are tergeting the $3300 to $3400 are as of now, where we might see another sideways movement before a breakout.
Swallow Academy

ETHEREUM BREAKOUT CONFIRMED!Hey Traders!
If you’re finding value in this analysis, smash that 👍 and hit Follow for high-accuracy trade setups that actually deliver!
After months of consolidation inside this massive symmetrical triangle, ETH finally breaks out on the daily chart—and this could be the spark for the next major rally! 🔥
📈 Structure: Symmetrical Triangle
✅ Breakout Confirmed
📍 CMP: ~$2,760
🎯 Next Major Target: $5,000+
This is the breakout bulls have been waiting for! If momentum sustains, ETH could enter price discovery territory soon. Buckle up—the real move might just be beginning. 🚀
Let’s see how far it runs from here!
Drop your targets in the comments 👇

Is ETH overextended and due for a correction?For those holding ETH, this is a good point to set up a hedge using derivatives.
If the price keeps going up (which I think is unlikely at this moment—perhaps it will move sideways), buying at these levels is crazy.
In fact, there’s been a recent rally, full of people on X and YouTube saying this is the big moment to buy… That immediately raises a red flag for me!
And what about the FEDFUNDS? Have you taken a look? Haha, just something to think about.
--
After a long time away from TradingView and the community, I’m back to breathe some life into it!
Missed you all — let’s enjoy life and make the most of what it has to offer!
eth mini scalp simple trade using order block 15minutes , but its not powerfull ob so maybe can go to our sl , just manage the risk , dyor!

Ethereum price is critical now#ethereum #eth price is now testing very very important resistance zone now and this also the bearish retest if #ethusd fails to leap over 3500 usd. 4 months ago, #ethusdt breakdown the 3 years of trendline, heavily dumped below 1400 usd and bounced. Now, CRYPTOCAP:ETH is testing this 3 years of trendline resistance zone + weekly ichimoku cloud.
Therefore ETH price has no other chance to at least reclaim 3450 - 3500 usd. True bullrun requires a new ATH. Heavy declination at current zone will not be tasty. This week' s close will determine the things i think.
Not financial advice.
Ethereum reached to our target
Ethereum reached to $3400 that we talked about since weeks ago, but now the daily RSI is at overbought area and we might see a correction.

Ethereum trading planBINANCE:ETHUSDT showed a minor pullback compared to Bitcoin. The price attempted to retest the $3,082 level again but faced strong rejection. Right now, $3,043 is acting as our reversal level - if we break through it, we've got a clear shot at our monthly target of $3,259. But as long as we're trading below this level, our immediate target is to test the $2,800-$2,700 range. More details are in yesterday's video analysis
Watch the triggers, and happy trading

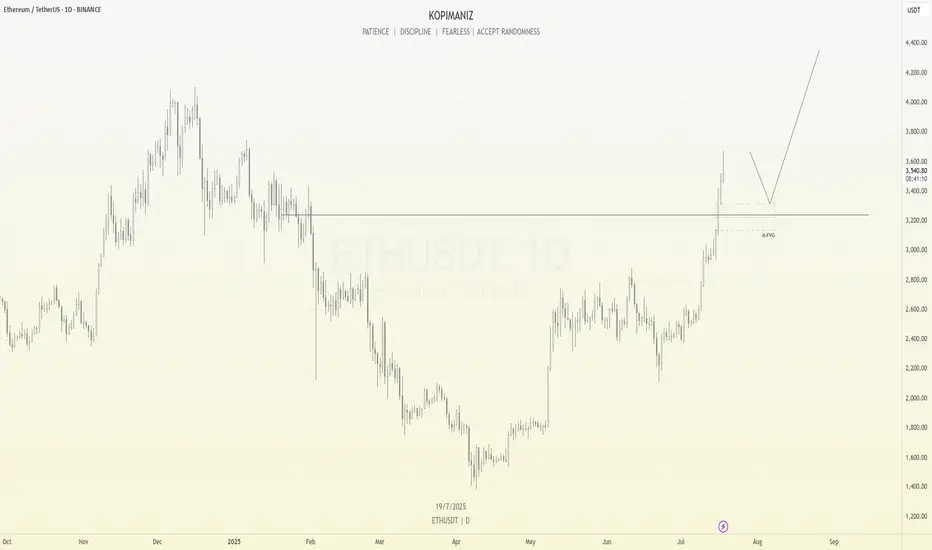
ETHUSDT Analysis – Potential Pullback Before ContinuationAfter a strong bullish rally, ETHUSDT may be ready for a short-term correction. The price has broken a key structure and is now trading well above previous resistance.
I'm expecting a potential pullback into the Fair Value Gap (FVG) area around $3,200, which also aligns with a retest of the previous resistance now turned support. If this level holds, it could act as a springboard for the next bullish leg, possibly targeting the $4,000+ region.
This setup follows a typical market behavior where price fills imbalance zones before resuming its trend.
Key levels:
Support zone: $3,200 – $3,300
Bullish continuation target: $4,000 – $4,400
Let’s see how price reacts at the FVG zone. Patience and discipline are key.
Ethereum (ETH): Looks Good, We Are Going For $3300-3400 EasilyWe are flying; Ethereum seems strong, so we are bullish on it. Our target of $3K was reached and broken easily, and now we are looking for the next resistance area to be reached, which is $3300-3400.
Targets are set; the first one got reached, and now we're heading towards the other 2 targets of ours!
Time for BINGX:ETHUSDT.P to shine.
Swallow Academy

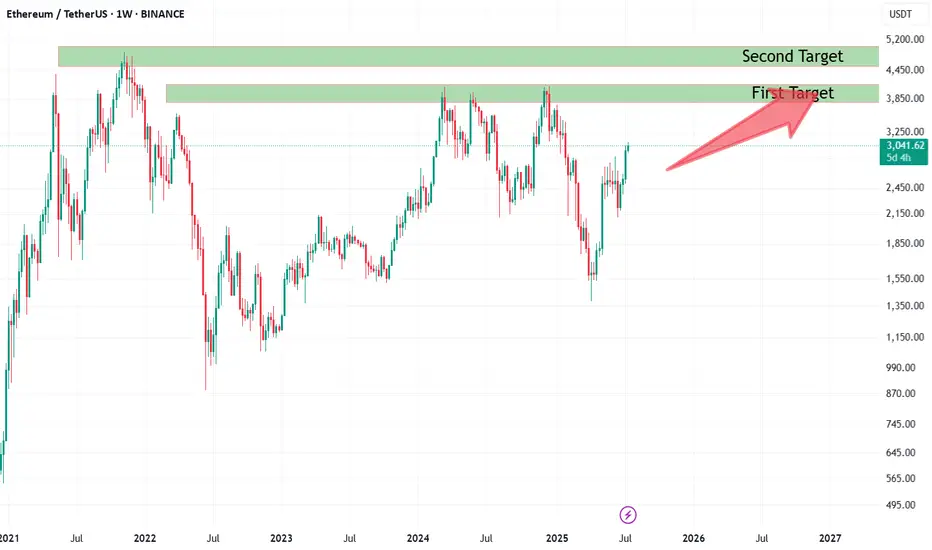
Binance Holds 25% of Exchange ETH: Smart Accumulation?According to cryptoonchain’s analysis of on-chain data from CryptoQuant, Binance now holds about 25% of the total Ethereum reserves across all exchanges. This significant figure could be a sign of smart accumulation by major market participants. Notably, Binance’s rising share has occurred while overall ETH reserves on exchanges have remained stable. In a situation where Ethereum’s price is still below its all-time highs—even as Bitcoin has set new records—this accumulation on Binance may signal that large investors are entering and expecting future price growth.
On the weekly chart, Ethereum is showing signs of strength and a possible continuation of its upward trend. If buyers maintain their momentum, the first target lies in the 3,900–4,200 zone, with the second target in the 4,850–4,950 range—close to previous all-time highs.
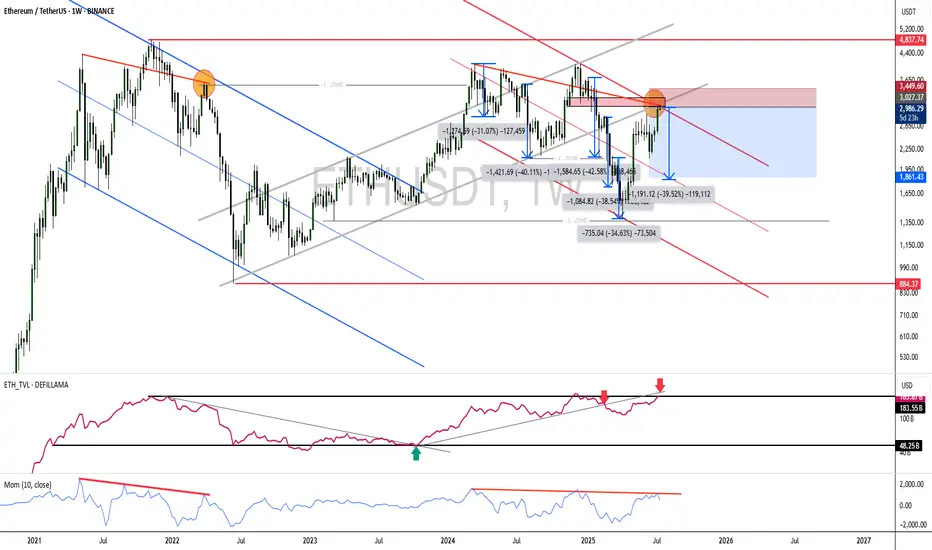
ETH/USDT – Weekly Chart Analysis (July 17, 2025)Ethereum has shown a strong bullish push, breaking above the prior consolidation zone between $2,400–$2,600. Price is now approaching a significant weekly supply zone between $3,800–$4,100 — a region that previously acted as a major reversal point.
🔹 Current Price: ~$3,460
🔹 Resistance Zone: $3,800–$4,100
🔹 Support Zone: $2,400–$2,600
📌 Possible Scenarios:
Rejection from resistance: ETH may test the upper supply zone and face selling pressure, triggering a pullback toward the mid-range or support.
Breakout & Close Above $4,100: Would signal strong bullish continuation with potential targets toward new highs.
📉 Watch for: Bearish price action near resistance or a potential lower high forming.
📈 Bullish Bias Confirmed if: Weekly close above $4,100 with volume support.
🧠 Patience is key at major levels. Let price action guide the next move.
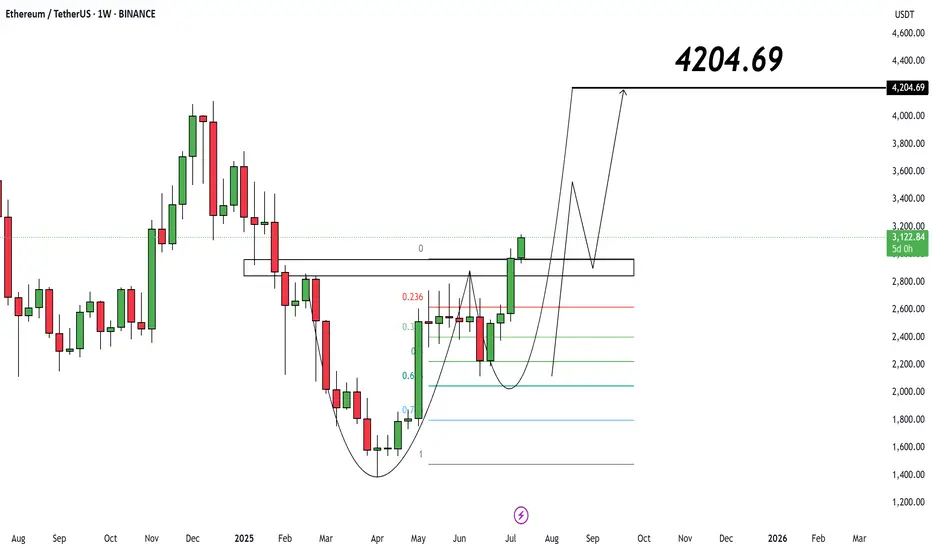
Ethereum ($ETH/USDT) – Weekly Analysis
Current Price: $3,127
📌 As long as ETH holds above $2,950, the bullish structure is intact.
🎯 Target:
• $4,204.69
🔍 Price is building momentum after multi-week consolidation. Pullbacks to $3K are potential re-entry zones.
Weekly trading plan for EthereumBINANCE:ETHUSDT Price has broken through the psychologically significant $3,000 level, but we're now seeing a clear 4-hour RSI divergence. Historical patterns suggest this divergence has a high probability of playing out. Expect potential correction initiation within the next 48 hours
Should the rally continue toward final targets:
The existing divergence may strengthen
A daily timeframe divergence could form
I'll await confirmation before considering short positions
As always, manage your risk wisely

$ETH - Scalps to Victory ~ 3011Scalps of eth which is missed and going to $3011 but it already moved from the point of movement! Touching soon!
The Loudmouth Pattern: It Yells, We Trade!
On the 30-minute chart, ETH is forming a classic Broadening Formation – or as some traders like to call it, “The Big Mouth Pattern” 😄. It’s noisy, unpredictable at first glance, but when it speaks, you’d better listen.
Right now, price is moving through the bullish leg of this setup, and if momentum holds, we’re eyeing the $4,000 psychological level, followed by the $4,120 – $4,170 supply zone.
🔹 Bullish Scenario (our expected outlook):
🎯 Target 1: $4,000
🟩 Main Resistance: $4,120 – $4,170
❌ Invalidation: Confirmed close below $2,946
If price breaks and holds below that red support zone, this setup gets thrown out the window.
📊 Risk Management:
Scale in on pullbacks – if structure remains valid
No chasing without confirmation
Keep risk under 1% of total capital
📈 The market’s big mouth is open – and until it closes below $2,946, we’re listening for bullish signals. 🤑
