ETH - Ranges overview (update) We've had some nice movements on ETH lately so let's have a look at where we are.
As previously discussed IF we reclaimed 2.5K we should expect the market to aggressively trade towards the HTF buyside (3.4K and 4K).
The buyside at 3.4K has been traded through already so no let's be PATIENT and see IF we get through 4K and higher.
As always WAIT FOR THE MARKET TO SHOW YOU ITS HAND.
Stay safe and never risk more than 1-5% of your capital per trade. The following analysis is merely a price action based analysis and does not constitute financial advice in any form.
ETHUPUSDT trade ideas
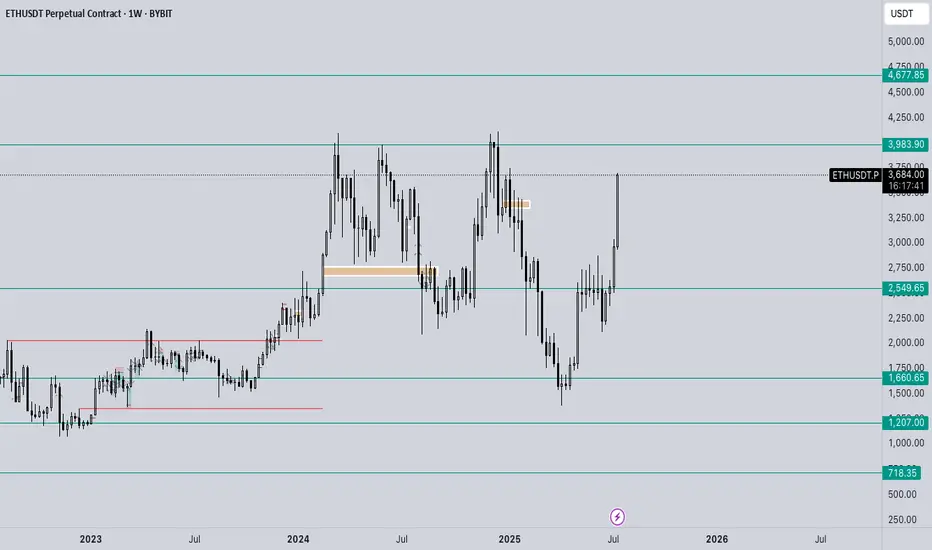
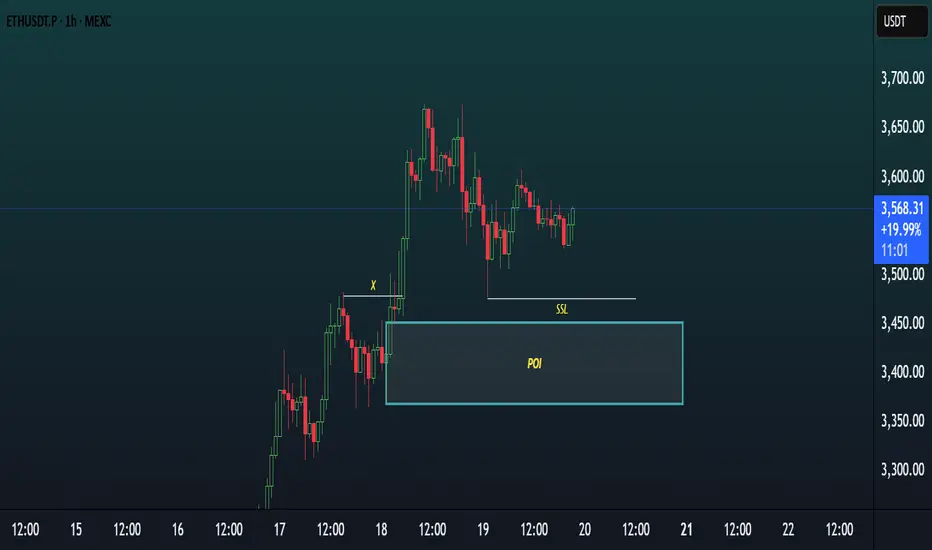
Chart Analysis (ETHUSDT, 1H)This chart showcases a Smart Money Concepts (SMC) style analysis on the 1-hour timeframe of ETHUSDT.P, focusing on a potential bullish setup.
Key Elements:
POI (Point of Interest)
A demand zone is clearly marked around the $3,400–$3,460 area, highlighted as a potential reversal zone where price may react bullishly.
SSL (Sell-Side Liquidity)
Sell-side liquidity has been swept below a recent low, indicating a possible liquidity grab before a reversal.
X (Previous Break of Structure)
Point “X” marks a significant BOS (Break of Structure) indicating bullish intent in prior price action.
Current Price Action
Price recently tapped into the POI, swept SSL, and is now consolidating slightly above the zone — suggesting accumulation or preparation for a bullish move.
Bias:
Bullish — Expecting a possible reversal or continuation to the upside after liquidity sweep and POI mitigation.
Is Ethereum Ready to Break Out? Watch This Key Trendline!Is Ethereum Ready to Break Out? Watch This Key Trendline!
In the 15-minute timeframe, Ethereum (ETHUSDT) is testing a major descending trendline. If a strong bullish candle closes above this level and price action holds, we could see a move toward the $3,637 resistance zone.
This area has acted as a significant technical level in the past, and a confirmed breakout may trigger further upside momentum.
🚀 A successful breakout could provide a solid long entry setup, with $3,637 as the first target. Keep a close eye on this move—momentum is building.
💡 Don’t miss more high-probability setups like this! Follow for real-time crypto analysis and trade ideas.

ETH | USDWe should monitor the megaphone formation. There's a strong possibility of a move to the targets identified by the breakout. Below, the green line and the megaphone's lower band I identified are excellent entry levels.

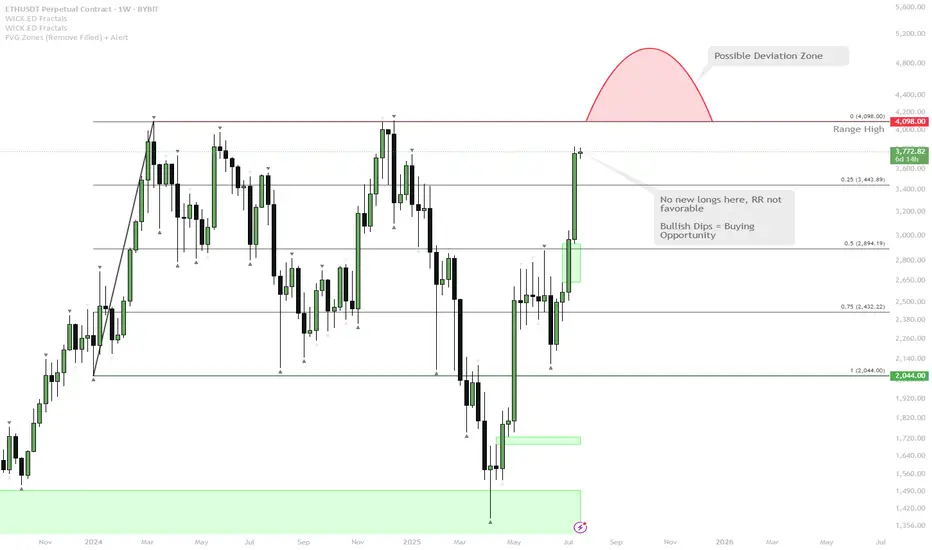
ETH Approaching Major Resistance — Watch for Range High Deviatio
ETH has rallied strongly and is now testing the range highs around $4,100.
The most likely scenario is a direct tap or wick above the range highs — this is a classic spot where the majority expects continuation, but also where deviations (fakeouts) frequently occur.
If price closes above and holds, it could trigger further upside. However, the risk/reward (RR) for fresh longs here is not attractive after such an extended move.
A deviation above range high (quick push above, then close back inside) is possible and would be a bearish signal in the short term.
After this wave, any deep dips in ETH will likely be a high-conviction buy, given the strong bullish momentum.
ETH is showing extremely bullish momentum as it approaches a major weekly resistance at the range high. The obvious play here is a sweep or break of this level, but with the move being so extended, a deviation or fakeout becomes increasingly likely. While momentum is still up, waiting for a dip or failed breakout (deviation) is a better risk/reward play than chasing longs here. Any meaningful pullback will likely present an excellent buying opportunity given the macro strength.
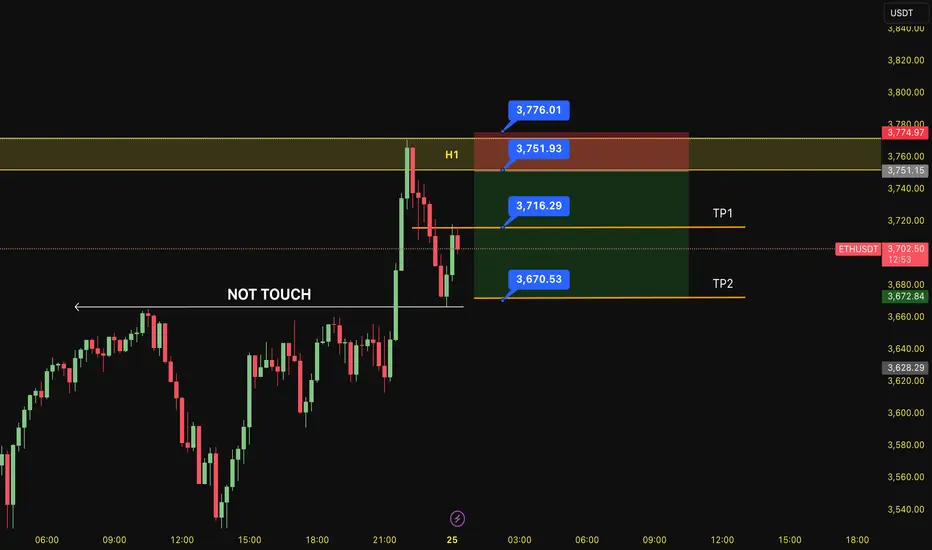
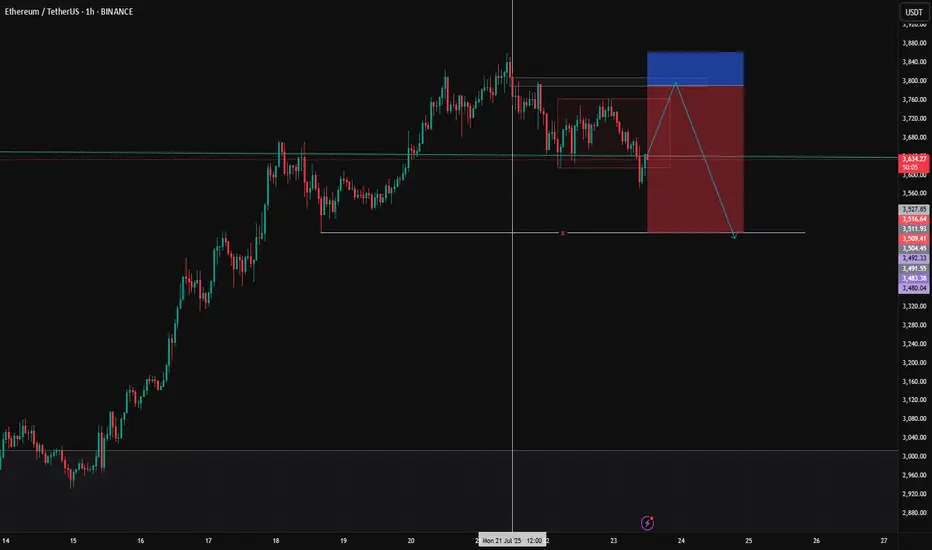
SELL ETH 25.7.2025Reversal trade order: SELL at H1~M15
Type of entry: Limit order
Reason:
- Candle creates reverse number 1 model
- The bottom hasn't touched any peak yet (meaning it hasn't reached a strong reversal zone)
Note:
- Management of money carefully at the price of bottom of M5 (3,716)
Set up entry:
- Entry sell at 3,751
- SL at 3,776
- TP1: 3,716
- TP2: 3,670
Trading Method: Price action (No indicator, only trend and candles)

HolderStat┆ETHUSD approaching $4kOKX:ETHUSDT continues its move after breaking above $2,900. Next resistance sits around $3,500. Uptrend remains intact while above $2,875.

Ethereum (ETH): Nothing Has Changed, We Still Target $4000Ethereum buyers have to reclaim back the middle line of Bollinger Bands, which recently switched the trends and is now under the control of sellers.
This sideways movement we have had is like a perfect setup, which will most likely lead the ETH to $4000K, which is one of the major resistance areas and a round number, which gives it a status of "psychological resistance."
Swallow Academy

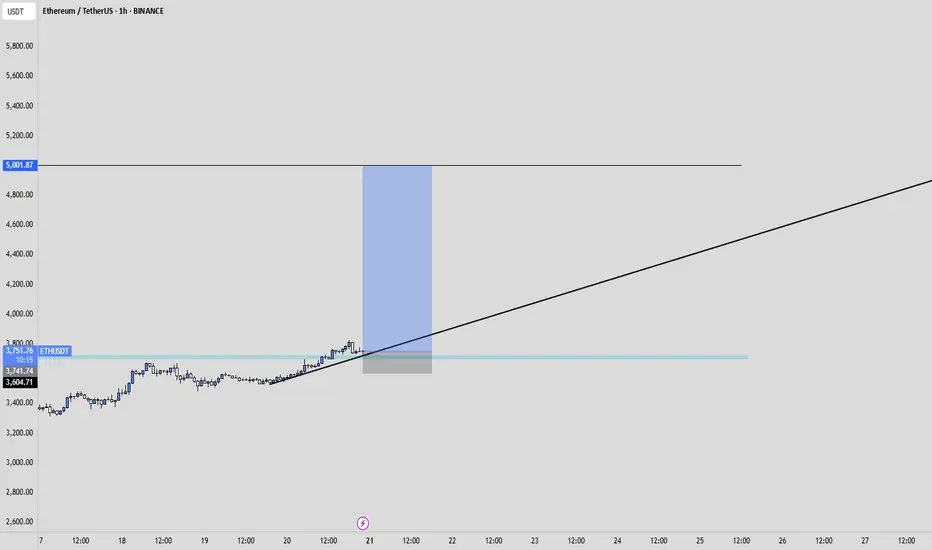
ETH to 5000USDBINANCE:ETHUSDT
Key take away points :
-Ethereum has been uptrending for a long time already.
-We did not break previous ATH yet.
-I believe we are in the alt season, and ethereum is just getting started.
-I expect price to break previous ATH within months, and to potentially reach 5-6K USD.
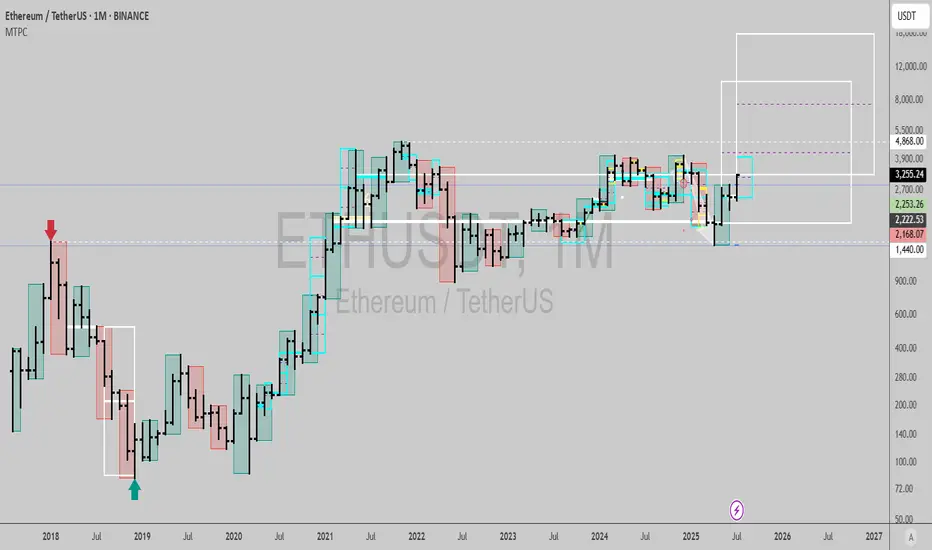
$ETHUSDT: Time at mode trend signalMonthly chart signal gives me a 17,975 United States of America Dollars per Vitalik Coin target🎯, within 19 months from now...
I don't think many people can fathom this but it is entirely possible, and probable now. (few bulls and those bullish mention 10k as a target, but nothing as high as this)
Best of luck!
Cheers,
Ivan Labrie.
Ethereum Breakout Could Spark the Next Altseason!A Massive Altseason Is Brewing… 🚀
Ethereum just flashed a major monthly breakout after printing a clean Morning Star reversal right at key support.
Now it's pushing against the upper resistance zone, a structure that held it back for over two years.
If CRYPTOCAP:ETH breaks and closes above this level, it won’t just be bullish for Ethereum — it could ignite the biggest altcoin season since 2021.
Why it matters:
📌 ETH is the heart of the altcoin ecosystem.
📌Historical breakouts like this led to 1500%+ moves.
📌The pattern and price action are lining up perfectly again.
Once Ethereum breaks cleanly above $4,000, expect altcoins to explode across the board — Layer 2s, DeFi, AI tokens, and even the meme coins could all start flying.
Keep your eyes on ETH. Its breakout is the spark… the altseason fire is coming.
DYOR | Not Financial Advice

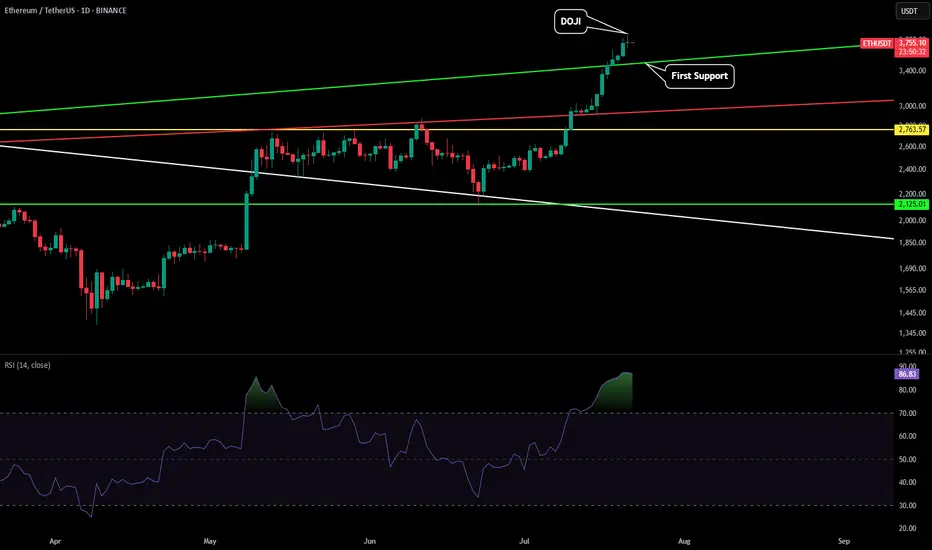
ETH - Pullback IncomingETH just printed a 1D doji reversal that could indicate a pullback should be expected. There is a lot of resistance between $3,800-$4,100 so a cooldown here would be nothing to worry about.
If we start seeing the price drop the first level of support we would want to watch is the green trendline. This could put price somewhere between $3,450-$3,530.
However if we see a wick down, or just start pumping back up creating a green daily candle following this reversal candle, that would signal this uptrend wants to climb to the $4k levels.
Be prepared for a pullback, but if we start seeing the momentum negate the reversal candle we will update this post.
Powell also speaks tomorrow so depending on what he has to say will most likely affect markets in a big way. Expect volatility.
ETHUSDT - Limited Return PriceEthereum is a reliable network for financial transfers and transactions and can be considered the second most popular digital currency after Bitcoin. Currently, this currency has reached the price range of $2,500 with temporary decreases, but this price is at its lowest level and the probability of liquidity entering this price area is very high. This price level can be used for long-term investment. I specify two targets for this price area: $4,000-5,000.
Sasha Charkhchian

ETHUSDT TECHNICAL LONG CHART PATTENT ETHUSDT Technical Outlook – Bearish Momentum Building
ETH has clearly rejected the resistance zone near 3900, and the structure has now shifted bearish after failing to hold above 3760.
📉 Trendline Breakdown: Price action confirms entry into a bearish phase, supported by lower highs and a descending trendline.
🟠 First Setup Zone: Around 3500
🎯 Primary Target: 3300
🚨 If momentum continues, a deeper pullback toward 3100 is possible in the coming sessions.
Key Resistance: 3760 – As long as ETH trades below this level, bearish continuation remains in play


Ethereum Analysis + Market Overview 🚀 Ethereum Analysis + Market Overview 🚀
Before diving into Ethereum, let’s quickly review the overall market conditions 👇👇👇
(For a more detailed market analysis, you can check my previous post, I’ll link it below.)
---
🔹 Analysis style:
Reviewing previous highs/lows breakouts in the mid-term (MWC - 4H).
Entries based on momentum & volume.
---
♦️ USDT.D
Support: 4.22
Max expected correction: 4.51
If 4.51 breaks upward, this could push us toward short positions.
---
♦️ BTC.D
Yesterday’s levels & analysis still remain valid.
Remember, on HWC (1D), after the recent downtrend, there’s only been one bullish candle.
For altcoins to rally: BTC.D must drop below 61.6 → 60.83 → 60.42.
Otherwise, if BTC.D grows (bearish for alts), 62.17 is the key resistance to watch.
---
♦️ TOTAL (Crypto Market Cap)
Must break 3.91 to confirm a bullish trend.
Early signal: 3.85 (1H timeframe).
---
♦️ TOTAL2 (Altcoin Market Cap)
Early bullish signal: 1.48
Confirmation level: 1.55
---
♦️ ETH (Ethereum)
Ethereum has shown strong support around 3500, despite the 48-hour drop, which reflects solid buying activity.
Additionally, positive whale news is increasing.
Early & risky trigger: 3653 (1H) – already broken.
Next potential entries:
3750 (1H)
3833 (4H)
Preferred entry: 3750, as it allows a tighter & safer stop-loss.
Beware: Fake breakout probability around 3833 is high.
Stop-loss for all 3 levels: 3455.
---
🔸 Entry Strategy:
If volume & momentum increase → place a stop-buy order on the exchange.
If volume is weak → wait for confirmed breakout above 3750.
---
♦️ ETH.D
The chart is fully bullish.
If ETH hits 3750, an early long position could be taken.
---
💎 Follow me & hit 🚀 for more real-time updates and setups!
---

ETH Short PositionHi
This is good zone for ETH correction , it's my personal idea and not trading advice.
please manage your risk .:)
EthFor a technical analysis of the provided ETH/USDT 1D chart, here are the key points:
1. **Current Price and Changes**: The current price is around 3,672.23 USD, down 1.99% (74.54 USD) from the previous day.
2. **Support and Resistance Levels**:
- **Resistance**: Near 3,672.24 USD (current SELL level), marked by the red line.
- **Supports**: Demand levels around 1,800 and 40 USD indicate potential support zones if the price drops significantly.
3. **Trend and Direction**: An upward trend line from the chart's bottom to the current point suggests an overall bullish trend, though the recent break below the resistance line may indicate weakness.
4. **Indicators**:
- The POI (Point of Interest) line near 3,672 USD highlights a key level where price is fluctuating.
- The lower indicator (likely RSI or similar) shows price oscillations, currently in a neutral zone with no clear buy or sell signal.
5. **Short-Term Outlook**: If the price fails to stabilize above 3,672 USD, it may move toward lower demand levels (e.g., 1,800 USD). A breakout and stabilization above resistance could target 10,000 USD (based on the upward trend line).
For a more detailed analysis, consider adding indicators like MACD or Bollinger Bands. Would you like me to create a visual chart in a separate panel?


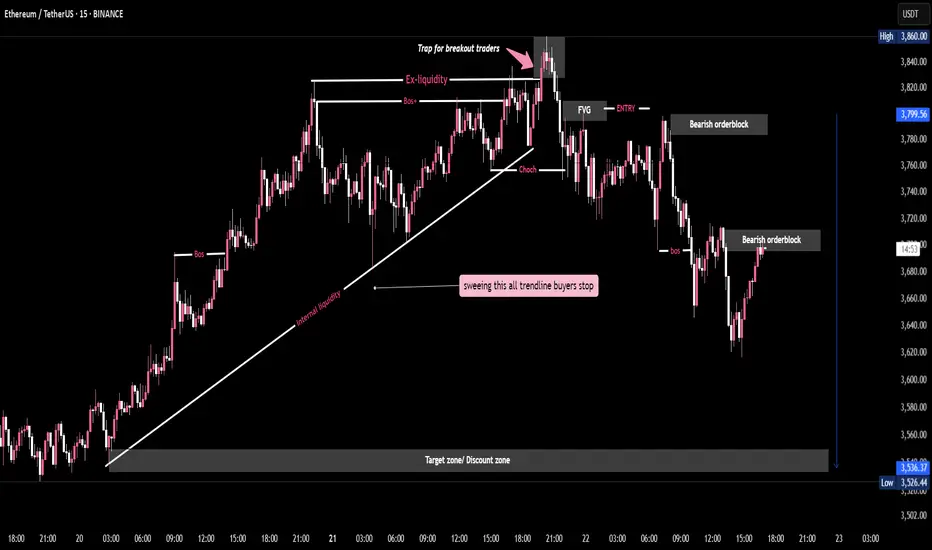
Liquidity Hunt Complete - ETH/USDT 15M BreakdownThis 15-minute ETH/USDT chart outlines a classic Smart Money Concept (SMC) short setup. Price action formed a bullish trendline, building internal liquidity and inducing breakout traders above previous highs (Ex-liquidity).
A clear CHoCH (Change of Character) and subsequent BOS (Break of Structure) confirmed bearish intent. Entry was taken at the Fair Value Gap (FVG), aligned with a bearish order block. Price is projected to sweep trendline buyers’ stops and target the discount zone below.
This analysis showcases liquidity engineering, stop hunts, and institutional footprints, providing a high-probability short scenario with well-defined entries, stops, and targets based on SMC principles.
Huge Bear Trap next in line??Ethereum Exit Queue: 518,180 ETH
Half a million ETH is currently queued for unstaking on Ethereum...
Keep in mind, August 1st, Trump's Reciprocal Tariffs get in effect
Everyone's talking about BTC's new ATH, ETH's rally, XRP new ATH, but no one is talking about August 1st...
Manipulation is taking place. Stay safe, because a huge bear trap might be next in line (BTC back to 90K)
*NOT INVESTMENT ADVICE*
#crypto #ethereum #eth #btc #bitcoin #trading #xrp #trump #tariff #finance #economy

ETH-----Sell around 3680, target 3650-3630 areaTechnical analysis of ETH contract on July 22:
Today, the large-cycle daily level closed with a small positive line yesterday, the K-line pattern continued to rise, the price was above the moving average, and the attached indicator was running in a golden cross. The overall upward trend was still very obvious, and yesterday's decline can be regarded as a correction based on the current trend. The price just returned to the support of the moving average, and the strong support position was near the 3630 area; the short-cycle hourly chart currently has a continuous negative K-line pattern, the price is below the moving average, and the attached indicator is running in a dead cross, so let's look at the retracement trend during the day, and pay attention to the 3630 area below the support.
Today's ETH short-term contract trading strategy:
The current price is 3680, short, stop loss in the 3745 area, and the target is the 3650-3630 area;
