ETHUPUSDT trade ideas

Weekly ETH candle sitting on 3 lines of resistance.This weekly ETH God candle is fighting with 3 lines of resistance. The white is the 25% discount zone calculated from Ethereums lowest to the highest point. Ethereum is right now roughly 25% below it's ATH. Plus two FIB retracement lines. There are 12 more hours till the end of this week, and unless we see a candle close above the 25% resistance line and a new one open, we may see some retracement. It would also be warranted to see some profit taking on the recent hype over the weekend, particularly with talks of Wall Street making announcements of plans to palce massive ETHEREUM buy orders. I expect some downtime towards the start of the week followed by the continuation of the pump possibly Tuesday or Wednesday.


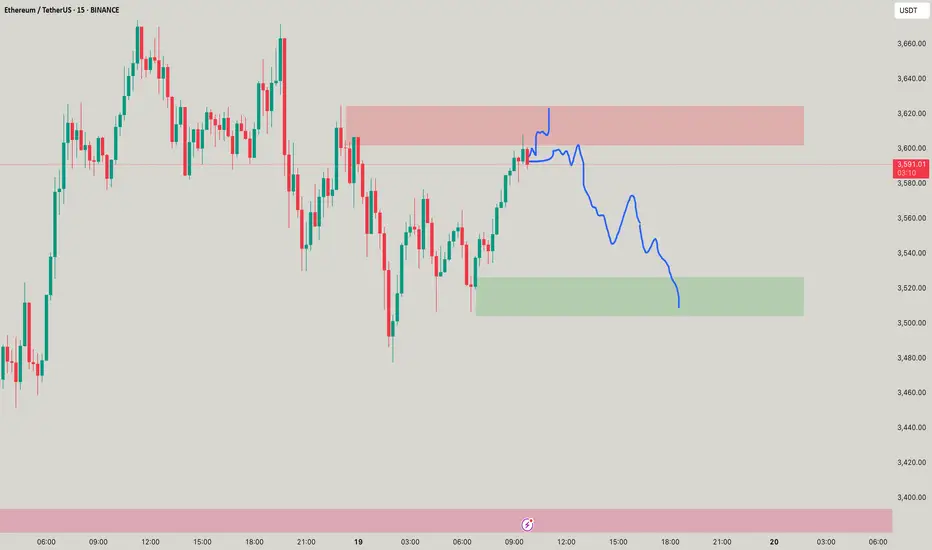
Ethereum (ETH): Buyers Accumulated | Time For Boune & BreakoutEthereum had its fun this week, and now we are already seeing some signs of buyer dominance forming here.
Based on our overall target and bigger timeframes, TAs, the $4000 is the target and 4hour candels are showing that buyers have not given away anything yet but rather have just been accumulating.
As long as we are above our entry area, we are bullish, and so should you be ...
Swallow Academy

Ethereum (ETH) Analysis – July 22, 2025🚨 Ethereum (ETH) Analysis – July 22, 2025
👉 Please read the previous post first. That one explains the fundamental background and market behavior that led to today’s setup.
Now let’s zoom in on ETH with some fresh analysis 👇
---
✅ ETH/BTC – Trend Structure
📈 The overall trend is still bullish, even though today's candles are red and corrective.
🔹 Resistance: 0.03242
→ A breakout here = confirmation to enter or continue long.
🔹 Support: 0.03072
→ Price reacted here, showing it’s a valid level.
🔹 Key Support: 0.02975
→ If broken, the bullish structure breaks, and a deeper correction may begin.
---
📊 ETH Dominance (ETH.D)
🔹 Resistance: 11.90%
→ Staying above this = support for keeping or adding to longs.
🔸 Support Zones:
11.45%
11.22%
→ Strong zones if market pulls back.
---
🌐 TOTAL2 (Altcoin Market Cap Without BTC)
🔹 Key Resistance: $1.55 Trillion
→ Breaking above this = more upside for altcoins, including ETH.
---
🔎 ETH/USDT – 4H Timeframe
✅ Mid-term trend is still up, but we are entering a correction phase.
📉 Price is testing the key 3,480 level.
📊 Volume is high, and momentum is fading, which shows buyers are getting weaker.
📈 20 EMA and 50 EMA are still rising, but flattening.
---
📌 Key Confluences
🧩 USDT.D at 4.14%
🧩 BTC Dominance at 61.31% and 60.42%
These levels + ETH chart = critical for making accurate decisions.
---
📈 Main Scenarios
🟡 Scenario 1 – Sideways Range
→ Price moves between 3,480–3,850
→ If confirmed, smart entries from edges with tight SLs make sense.
🔻 Scenario 2 – Breakdown of 3,480
→ Bullish 4H structure breaks
→ Possible drop to 3,200 or even 3,060
⚫ Scenario 3 – Breakout of 3,850
→ Likely moves to range between 3,850–4,000
→ Market enters a “macro decision zone”
🟢 Scenario 4 – Sharp Break Above 4,000
→ Strong bullish signal
→ Daily uptrend may continue toward 4,400 or even a new ATH
---
🚀 If this analysis helped:
🔁 Tap the rocket to boost
🔔 Follow for more clear updates
💬 Comment your thoughts or chart ideas!

ETHUSDTThis movement downtrend. If breake 2.790 movr to 3.500$ but breke 2.200 move trend to 1.500$.

DeGRAM | ETHUSD retest of the support level📊 Technical Analysis
● ETH exploded out of the purple median channel, invalidating March-July lower-highs; retest of 3 210 held as a fresh higher-low, confirming trend acceleration.
● Price is now travelling the channel’s outer parallel; flag pole projected from the 2 430→3 210 thrust aligns with the 4 150-4 250 supply zone shown in pink.
💡 Fundamental Analysis
● CME ether futures OI hit a 14-month high on 17 Jul while exchange balances dropped to a five-year low, signalling strong institutional demand and tight float ahead of expected spot-ETF approvals.
✨ Summary
Long 3 210-3 300; hold above 3 210 targets 3 600 → 4 200. Bull view void on a 16 h close below 3 020.
-------------------
Share your opinion in the comments and support the idea with like. Thanks for your support!
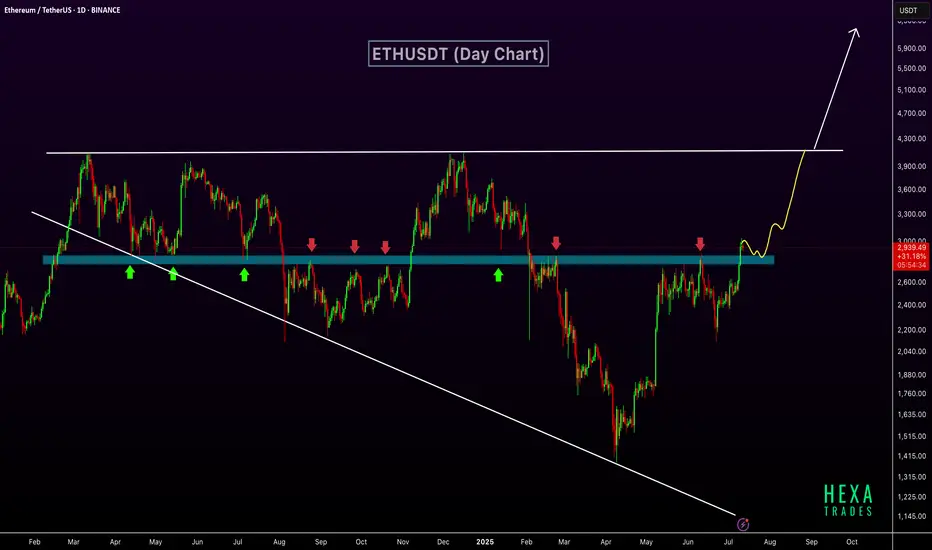
ETH Breaks Key Resistance – $6K Possible if Wedge BreaksETHUSDT has broken out above a key horizontal resistance zone that has historically acted as a strong support and resistance level. This zone, marked in blue, has seen multiple rejections and bounces over the past year, confirming its significance.
The recent breakout above this zone indicates a shift in market structure and suggests growing bullish momentum. The price action shows a clean move above resistance, with potential for a retest before continuing higher. The market is also forming a long-term broadening wedge pattern. The next target lies near the upper resistance of the wedge, around $4,000. If the price breaks above this broadening wedge, it could open the path toward the $6,000 level.
Regards
Hexa
ETH 3rd Attempt at Resistance — Breakout or Bull Trap?Ethereum is back at a major level that’s rejected it twice already. A breakout here could finally end the range and send price into discovery — but if history repeats, this might be the ultimate fakeout before a sharp reversal. All eyes on the next few candles.

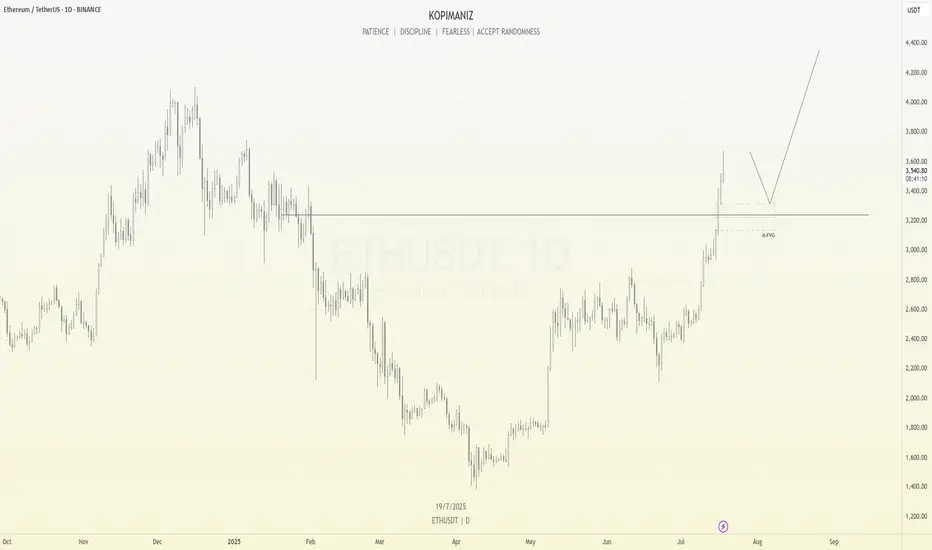
ETHUSDT Analysis – Potential Pullback Before ContinuationAfter a strong bullish rally, ETHUSDT may be ready for a short-term correction. The price has broken a key structure and is now trading well above previous resistance.
I'm expecting a potential pullback into the Fair Value Gap (FVG) area around $3,200, which also aligns with a retest of the previous resistance now turned support. If this level holds, it could act as a springboard for the next bullish leg, possibly targeting the $4,000+ region.
This setup follows a typical market behavior where price fills imbalance zones before resuming its trend.
Key levels:
Support zone: $3,200 – $3,300
Bullish continuation target: $4,000 – $4,400
Let’s see how price reacts at the FVG zone. Patience and discipline are key.
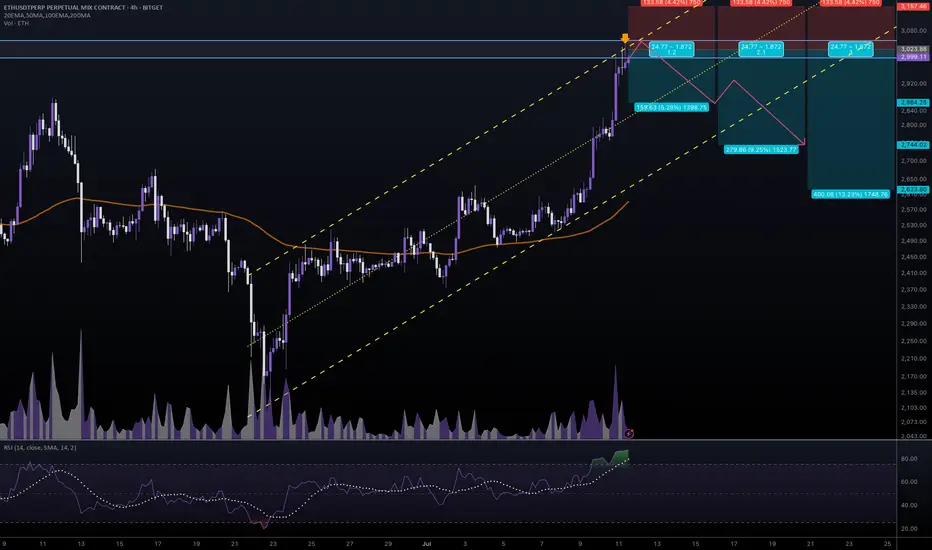
#ETHUSDT #4h (Bitget Futures) Ascending channel on resistanceEthereum printed a gravestone doji followed by a shooting star, RSI is overbought, local top seems in.
⚡️⚡️ #ETH/USDT ⚡️⚡️
Exchanges: Bitget Futures
Signal Type: Regular (Short)
Leverage: Isolated (9.0X)
Amount: 5.0%
Entry Zone:
2996.99 - 3050.49
Take-Profit Targets:
1) 2864.25
2) 2744.02
3) 2623.80
Stop Targets:
1) 3157.46
Published By: @Zblaba
CRYPTOCAP:ETH BITGET:ETHUSDT.P #4h #Ethereum #PoS ethereum.org
Risk/Reward= 1:1.2 | 1:2.1 | 1:3.0
Expected Profit= +47.5% | +83.3% | +119.0%
Possible Loss= -39.8%
Estimated Gaintime= 1-2 weeks
ETH Short OpportunityETH Short Opportunity 🟥 | Watch 3428 Closely
Ethereum is approaching a key resistance at $3428 — this zone could offer a great short setup if confirmed.
First target on the downside: $3340 📉
High R/R potential if price rejects this level.
Stay sharp and manage your risk!
🔔 Follow me for more real-time trade ideas and technical insights.

ETH/USDT : $3000 Reached, It's time foe $4000? (READ)By analyzing the Ethereum chart on the weekly timeframe, we can see that the price has finally broken the strong $2700 resistance and pushed toward the next target at $3000! Currently trading around $3150 and now within the $3130–$3440 zone, I expect a short-term rejection from this area. However, given the overall market trend, this level may not hold for long, and we could soon see a breakout toward the next targets at $3500, $3740, $4100, and $4470!
Please support me with your likes and comments to motivate me to share more analysis with you and share your opinion about the possible trend of this chart with me !
Best Regards , Arman Shaban
THE LATEST ANALYSIS :

ETH Buy Zone AlertETH Buy Zone Alert 🚨 | Eyes on 3340 & 3291
Ethereum is entering a strong demand zone between $3340 and $3291 — this could be a great long opportunity if price reacts well.
Short-term targets to watch: $3420 and then $3500.
Don’t sleep on this setup — keep it on your radar! 👀
📈 Follow for more actionable trade setups and real-time market updates.

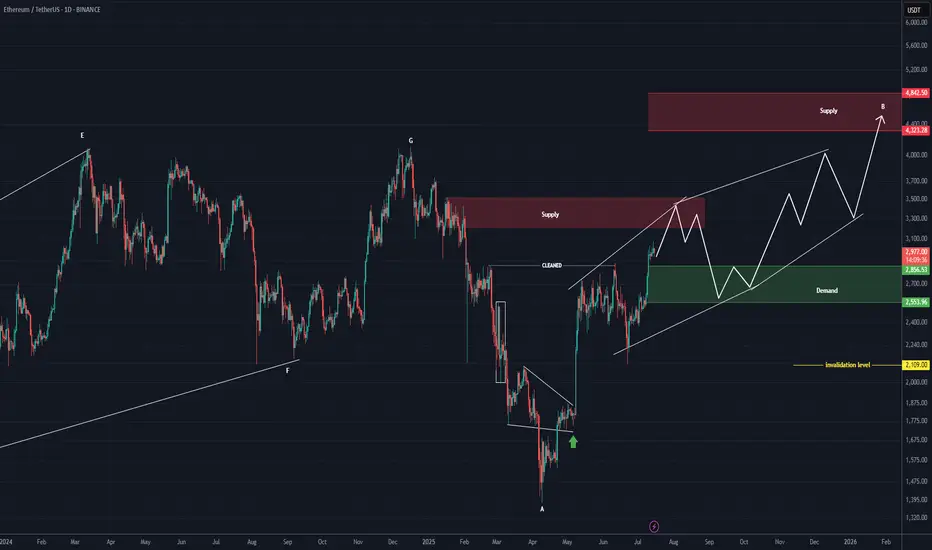
ETHEREUM Roara Map (1D)The previous phase of Ethereum appears to have been a completed diametric, and now it seems we are in a flat pattern.
It can be said that we are currently in wave B of the flat, which itself appears to be a diametric.
This diametric could even extend to the 4300–4800 range.
The green zone is the rebuy area.
A daily candle close below the invalidation level would invalidate this analysis.
For risk management, please don't forget stop loss and capital management
Comment if you have any questions
Thank You
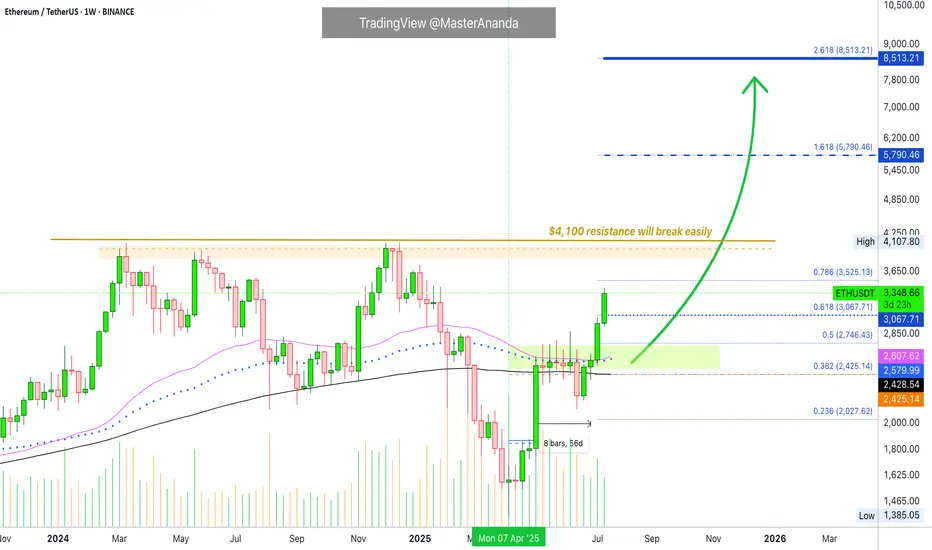
Ethereum · Going beyond $5,790 · $8,513 Next TargetThe eight weeks of consolidation, 56 days, happened as compressed (sandwich style) action right in-between MA200 and EMA55/89.
The EMA55/89 duo worked as resistance while MA200 worked as support.
Before a major move the market always tends to produce a form of shakeout. Sometimes it is call a bear-trap, a shakeout, a liquidity-hunt or stop-loss hunt event, a failed signal, etc.
Here Ether (ETHUSDT) closed below MA200 one week just to recover the next. In this case, we will call it a failed breakdown but we know this is a way to liquidate over leveraged long-traders, also a way to catch unsuspecting bears ready to short. The conclusion is simple, Ether recovered the next week above MA200 and the following week above EMA55/89 which worked as resistance for six weeks. With these levels behind us, the market is full green.
Notice the last two candles, big huge green candle. That is because resistance is no more.
With no resistance to stop prices from rising, Ethereum started to grow and we are now in full blown bullish mode.
The last major high sits at $4,107. This is an easy target, the minimum. Once support is tested the action moves toward resistance and this is where we are headed.
Some people will wonder if resistance will break or hold. Some unsuspecting bears, again, will even short at resistance thinking this is the logical move, they will lose all.
The truth is that this resistance and major high will break easily, we know this based on marketwide action and Bitcoin, Bitcoin is hitting new all-time highs every other day. In this way, we know that Ethereum will soon catch up and do the same.
Many altcoins are moving forward and growing, and some already conquered their December 2024 high price. This is another indication that shows Ether will not stay behind.
Whatever you do when Ethereum goes up, do not short. You can short if you are going to close the short after just a few hours or a few days, but instead of shorting a bullish trend, go LONG and enjoy maximum profits on the way up.
» Ethereum will break $6,000 and move toward $8,500 and beyond in the long-run.
You read it here first.
Thanks a lot for your continued support.
Resistance will break and the altcoins market will continue to grow. Not only for a few months but for a very long time.
When correction time comes, it will last a few months, we will get higher lows and then additional growth. Think of the pattern that came up on Bitcoin but with the altcoins; long-term growth.
Namaste.
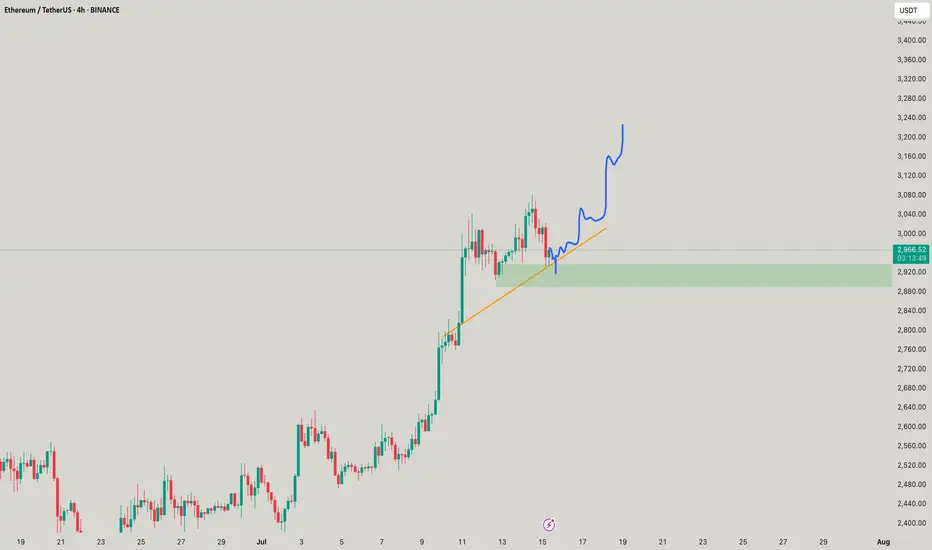
ETH continues to gather more upward momentumETH continues to gather more upward momentum
From our previous analysis, Ethereum is close to the last target, but the potential seems higher.
On the 60-minute chart, the price has already formed a small bullish flag pattern, indicating that the bulls are in control of the price and ETH could move beyond our last target.
I am looking for a possible upward move with targets at 3080; 3175 and 3250.
You may find more details in the chart!
Thank you and Good Luck!
PS: Please support with a like or comment if you find this analysis useful for your trading day

ETH - Can it go $3200??Yes looks good until stays above 2890, all buys are good in this range as scalps! AWESOME aint it?
Eth $2,500 Resistance — Will Harmonic Pattern Trigger a Rally?Ethereum Stuck at $2,500 Resistance — Will Harmonic Pattern Trigger a Rally to $3,400?
Ethereum has been trading in a prolonged consolidation phase around the $2,500 level — a region that has acted as resistance for several weeks. This extended period of sideways action could signify either accumulation or distribution, depending on what comes next. Technically, Ethereum remains capped below major resistance and has yet to confirm a bullish breakout. However, a deeper corrective move followed by a reclaim of key levels could activate a larger harmonic pattern, which presents a potential rally scenario toward the $3,400 region.
-$2,500 Resistance Zone: Price continues to stall at this critical area, signaling indecision
-$2,200 Support Level: A potential bounce zone where bulls may re-enter the market
-Harmonic Pattern Forming: Possible C-to-D leg expansion targeting $3,400, pending confirmation
Ethereum’s price has remained stuck around the $2,500 region, which has evolved into a high time frame resistance. Price has yet to show a decisive breakout, and this extended stay near resistance typically signals one of two things: stealth accumulation before a breakout, or distribution before a breakdown. The direction will become clearer once price action reacts to either a support retest or a break of the current range.
From a bullish perspective, a potential corrective move toward the $2,200 region — a well-established support — would provide a healthy reset for price action. This zone has previously acted as a demand area and aligns closely with the value area low. If Ethereum bounces from this level and reclaims the point of control (POC) around $2,550 — which also aligns with weekly resistance — it would be a strong structural signal.
This sequence of moves could activate a larger harmonic pattern currently visible in Ethereum’s price action. If valid, the market could enter the C-to-D expansion phase of the harmonic setup, targeting the $3,400 region. While this pattern remains speculative and unconfirmed, its structure is valid and aligns with both historical Fibonacci extensions and support/resistance dynamics.
For this pattern to be confirmed, Ethereum must hold the $2,200 support level and produce a strong reclaim of $2,550 backed by volume. Without this confirmation, the idea remains purely speculative and should be approached with caution.
If Ethereum corrects to $2,200 and reclaims $2,550, a bullish C-to-D harmonic expansion may play out targeting $3,400. Until then, ETH remains range-bound and capped under major resistance.

When does Bolran start?Read carefullyhello friends👋
💰Many of you are asking when Bolran will start or if it will start at all, we decided to explain it to you in a full post.
Well, you can see the Ethereum chart moving in a channel, and with a drop, it created a big fear that a fall is coming, and meanwhile, the buyers returned the price to above 2000 dollars with a strong and unexpected return.
✅️Now the price is stuck in the specified box between 2200 and 2500, and if this range is maintained, the price will easily move up to the range of 3200 in the first wave, and if it fails to maintain this range, the price will fall below 1500 dollars.
🧐Now, in our opinion, due to the rapid return of the price from the channel, this failure is a fake channel and the range will be maintained, and we are likely to see Ethereum rise in the coming weeks.
🤔You know that Ethereum is the leader of altcoins, and if it grows, important altcoins will grow, which is the beginning of Bolran, and there are important altcoins that can be used for good profit.
🌟You can join us if you like.🌟
🔥Follow us for more signals🔥
*Trade safely with us*

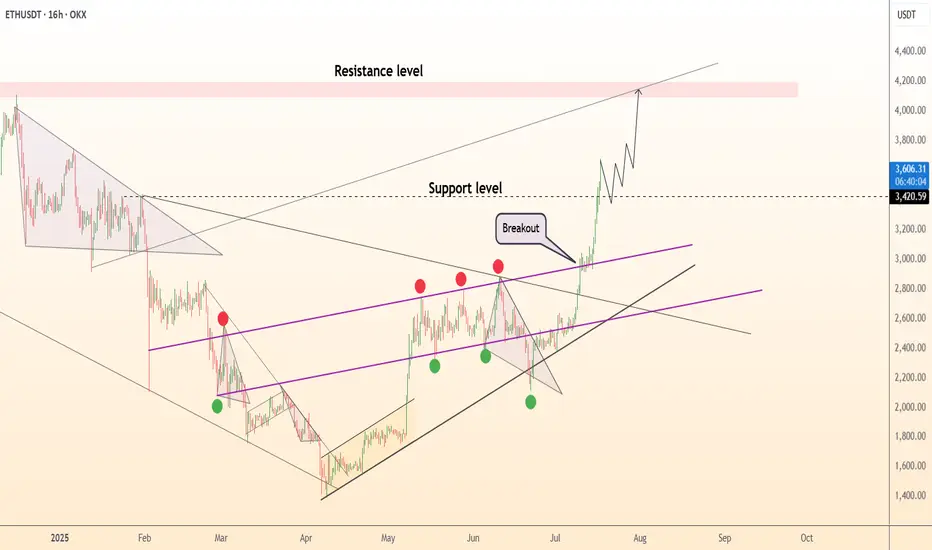
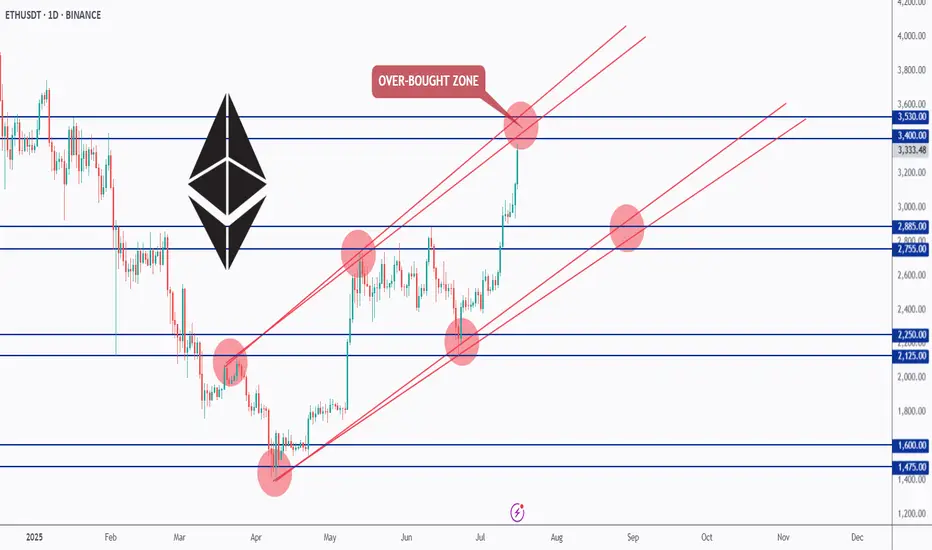
ETH Testing Overbought Zone — What’s Next?📊ETH has been overall bullish, trading inside this rising red channel for months.
After breaking above the $2,885 resistance, bulls took full control, and price is now approaching the upper red trendline — an overbought zone where we’ve seen rejections before.
As long as ETH holds above the $2,885 zone, the bulls remain in control. But since we’re near a strong resistance and the top of the channel, we’ll be waiting for a potential correction or at least a slowdown in momentum before looking for fresh entries.
📌 Key levels to watch:
Resistance: $3,400 – $3,530
Support: $2,885 – $2,755
Let’s stay patient and follow the market’s lead. 🧠
Let me know your thoughts in the comments 👇
📚 Always follow your trading plan regarding entry, risk management, and trade management.
Good luck!
All Strategies Are Good; If Managed Properly!
~Richard Nasr
You need smol Scalps for ETH!ETH SMOL scalps but u know it takes your liquidity on top blowing ur accounf! Keep mindful where the trade goes! good short oppurtunity!
tahlile eth baye in mahHere is the English translation of your analysis:
---
**Comprehensive Analysis of Ethereum**
Ethereum is currently at a critical point and is experiencing significant volatility. It is attempting to break through key resistance levels to continue its upward trend. However, failure to break these levels could lead to a price decline. Various factors, such as whale activity and the break of key resistance levels, can influence Ethereum's future trend.
### **Technical Analysis**
**Current Trend:**
Ethereum is currently trading in a range, fluctuating between support and resistance levels.
**Support Levels:**
Key support levels are at **\$1,750** and **\$1,650**.
**Resistance Levels:**
Key resistance levels are at **\$1,930** and **\$2,100**.
### **Possible Scenarios**
* **Bullish:** If Ethereum can break above the \$1,930 resistance level and hold above it, it could move toward higher targets.
* **Bearish:** If Ethereum fails to break through the resistance levels, it may decline toward lower support levels.
### **Whale Activity**
Whale activity currently has the potential to significantly impact Ethereum's price trend. If whales continue to accumulate Ethereum, it could support a reversal of the bearish trend.
---
### **Fundamental Analysis**
**Correlation with Bitcoin:**
Ethereum remains heavily influenced by Bitcoin, and its price movement is largely dependent on Bitcoin’s trend.
**New Projects:**
The development of new projects within the Ethereum ecosystem can drive demand and increase its price.
**Regulations:**
New regulations in the cryptocurrency space can affect Ethereum’s future.
---
### **Recommendations**
* **Monitor Whale Activity:**
Investors should pay close attention to whale behavior in the Ethereum market.
* **Watch for Resistance Breakouts:**
Breaking through key resistance levels could signal the beginning of a bullish trend.
* **Risk Management:**
Given the high volatility in the crypto market, effective risk management is crucial in investment strategies.
* **Further Research:**
Conducting additional research on Ethereum and the factors influencing it is highly recommended for better decision-making.
> **Note:** This analysis is a general overview of Ethereum’s current status and should not be considered as investment advice.
---
Let me know if you'd like this formatted as a PDF, presentation, or infographic.
