NEoWave Analysis of Ethereum 2025 Cash data chart shows that Ethereum is in a corrective phase and the wave structure from (A) to (C) has been completed. Initially, we expected a flat pattern to form; however, the wave structure-(C) was not an impulse and the flat was not confirmed.
As a result, given that the wave structure (A)-(B)-(C) is corrective and the waves differ in time, it seems that a contracting triangle pattern is forming and we are currently in wave-(D) of this triangle. Furthermore, wave-(D) could rise to $3630-3880 and end. Then a price correction in the form of wave-(E) may occur. This correction could end between $2900-3086 and if this range is broken downwards, wave-(E) could decline to $2000-2230, after which the main bullish move for Ethereum is expected to begin.
Good luck
NEoWaveChart
ETHUPUSDT trade ideas

ETHEREM ETHUSD LONG TECHNICAL CHART IDEAEthereum (ETHUSD) Technical Outlook – Short-Term Levels and Potential Targets
📊 Key Insights:
First Below Support: 2560 USDT
Starting Journey: 2600 USDT
Resistance Zone: 2630–2650 USDT
Target on Breakdown: 2440 USDT
Market Structure:
After a period of consolidation between 2560 and 2600, ETHUSD has initiated a sharp upward move towards the resistance zone near 2630–2650. The chart projects a possible rejection from this resistance area, suggesting a potential pullback targeting 2440 if support fails to hold.
✅ Key Considerations:
Watch for price action confirmation around 2630–2650.
A sustained break above resistance could invalidate the short-term bearish scenario.
The target zone of 2440 aligns with prior support and could offer buying interest

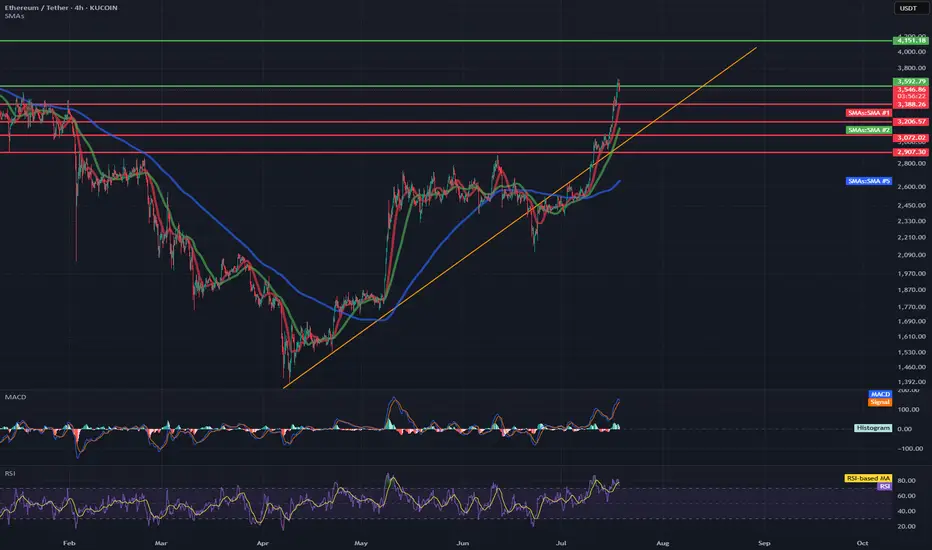
ETH/USDT 4H Chart✅ Market Trend and Structure:
Uptrend: The highlighted orange trend line shows continuous growth since mid-April. The price is trading above the 50- and 200-period moving averages (EMA and SMA), confirming bullish sentiment.
Current price: around 3556 USDT – very close to local highs.
Resistance break in the 3200–3300 USDT area, which now acts as support.
📈 Technical Levels:
Resistance (red horizontal lines):
3600–3650 USDT – local resistance resulting from market reaction.
3888 USDT – next historical resistance level.
4133 USDT – established long-term target (green dashed line at the top).
Support:
3300 USDT – strong support after a previous breakout.
3080 USDT – previous high, now the next support level.
3070 / 2900 USDT – key technical support levels in the event of a larger correction.
📊 Indicators:
MACD:
The MACD is in a strongly bullish zone, but:
The histogram is flattening.
A bearish crossover pattern is possible in the following candles – a signal of weakening momentum.
RSI:
RSI ~74 – is in the overbought zone, which often heralds a correction or at least consolidation.
A value above 70 confirms the bullish trend but may suggest that momentum is overheated.
📌 Conclusions and Scenarios:
🔼 Upside Scenario (trend continuation):
If the price remains above 3300–3350 USDT, it could move towards 3888, and then 4133 USDT.
A break above 3650 USDT on heavy volume will be a strong continuation signal.
🔽 Corrective scenario (short-term pullback):
The RSI and MACD suggest a possible correction.
Potential pullback to:
3300 USDT (retest of previous resistance as support).
SMA 200 (~2600 USDT) with a deeper downward move.
BUY ETHUSDT 16.7.2025Confluence order: BUY at M15
Type of order: Limit order
Reason:
- M15~FIBO 0,5-0,618 (same position)
Note:
- Management of money carefully at the price of sub key M15 (3152)
Set up entry:
- Entry buy at 3137
- SL at 3127
- TP1: 3152
- TP2: 3164
Trading Method: Price action (No indicator, only trend and candles)

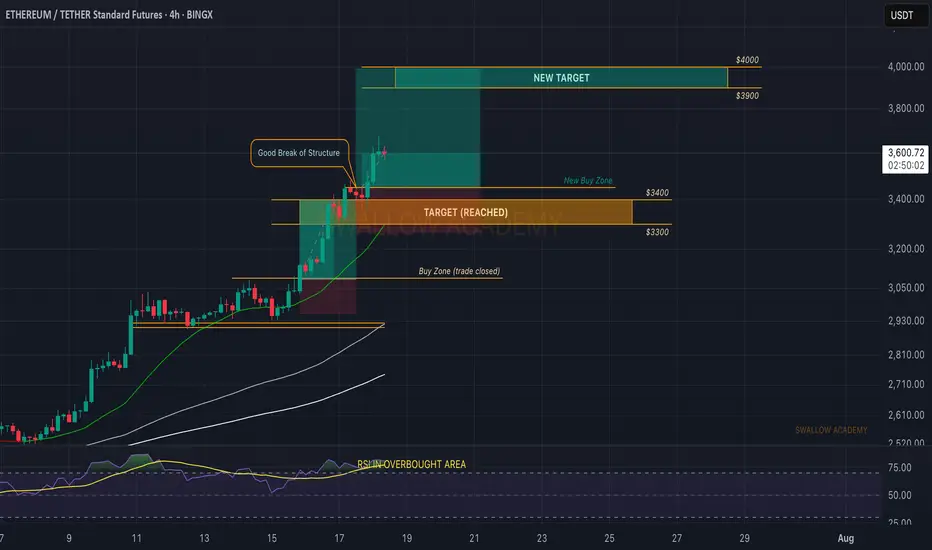
Ethereum (ETH): Looks Good, We Are Going For $3300-3400 EasilyWe are flying; Ethereum seems strong, so we are bullish on it. Our target of $3K was reached and broken easily, and now we are looking for the next resistance area to be reached, which is $3300-3400.
Targets are set; the first one got reached, and now we're heading towards the other 2 targets of ours!
Time for BINGX:ETHUSDT.P to shine.
Swallow Academy

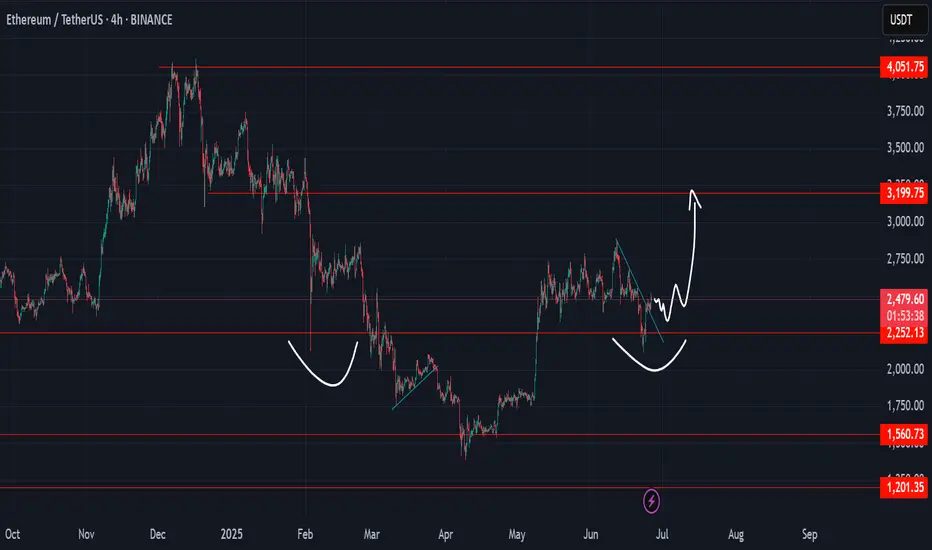
ETH and iHnS SpeculationETH in candle stick mode create iHnS pattern
if we can hold above 2k its still positive if we can retest to 3.2k
ETHUSDT Ready for 3K$ and New possible ATH after YearsSoon Red trendline resistance And 4K$ resistances will break and market will easily continue this bull Move and reaching new highs here After each other.
I am expecting more rise here at least to 3500$ near red trendline resistance and only after a valid breakout there more pump is expected like green arrow.
DISCLAIMER: ((trade based on your own decision))
<<press like👍 if you enjoy💚

#ETH look for the false breakoutany false break out to the area of
2400-2500
will be a good buy sign with stop below 3200 and target 4300
trade safe and follow me 😉

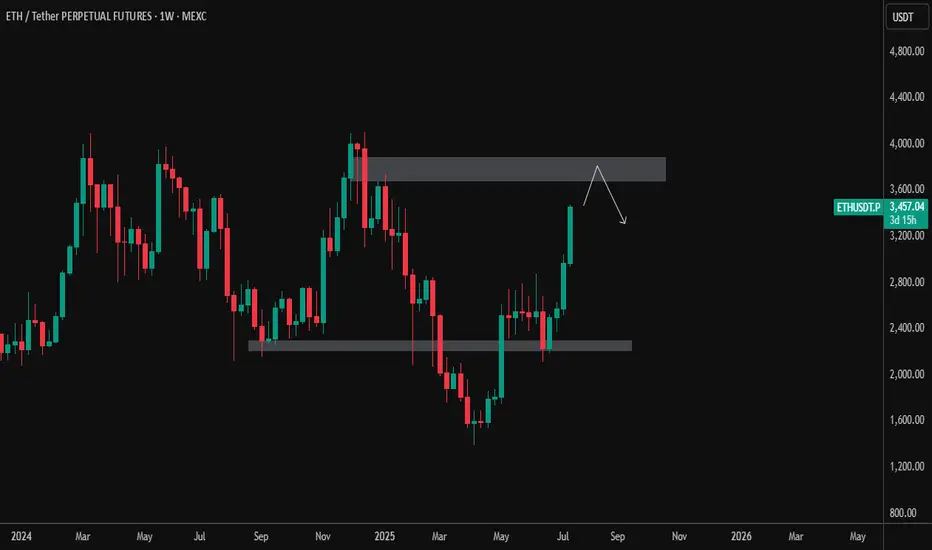
ETH/USDT – Weekly Chart Analysis (July 17, 2025)Ethereum has shown a strong bullish push, breaking above the prior consolidation zone between $2,400–$2,600. Price is now approaching a significant weekly supply zone between $3,800–$4,100 — a region that previously acted as a major reversal point.
🔹 Current Price: ~$3,460
🔹 Resistance Zone: $3,800–$4,100
🔹 Support Zone: $2,400–$2,600
📌 Possible Scenarios:
Rejection from resistance: ETH may test the upper supply zone and face selling pressure, triggering a pullback toward the mid-range or support.
Breakout & Close Above $4,100: Would signal strong bullish continuation with potential targets toward new highs.
📉 Watch for: Bearish price action near resistance or a potential lower high forming.
📈 Bullish Bias Confirmed if: Weekly close above $4,100 with volume support.
🧠 Patience is key at major levels. Let price action guide the next move.
Ethereum reached to our target
Ethereum reached to $3400 that we talked about since weeks ago, but now the daily RSI is at overbought area and we might see a correction.

ETHUSDT BUY / Long SetupThis 4hrs candle closes above the mentioned level, then took long from 50% fib level of the fvg, and put sl below the recent swing low, I will update the trade whether it's active or not? tp towards 3.3-3.4k , while btc.d getting recked so becareful shorting any altcoin.

ETH ~ It Gives you a chance ~ $4000 soon!ETH will soon go to $4000 bidding Lower TF for actual buys and shorts to stay till there, will post the buy moves soon!

Ethereum (ETH): Will Overtake The Bitcoin Soon? Ethereum has been moving much better compared to Bitcoin, which confirms our theory that ETH will now head for its ATH, just like Bitcoin did before.
We are looking for further movement to $4000 area, but be careful as we are entering weekends market, we should keep an eye on our entry area.
Volatility can happen but nevertheless, we are very bullish on ETH.
Swallow Academy
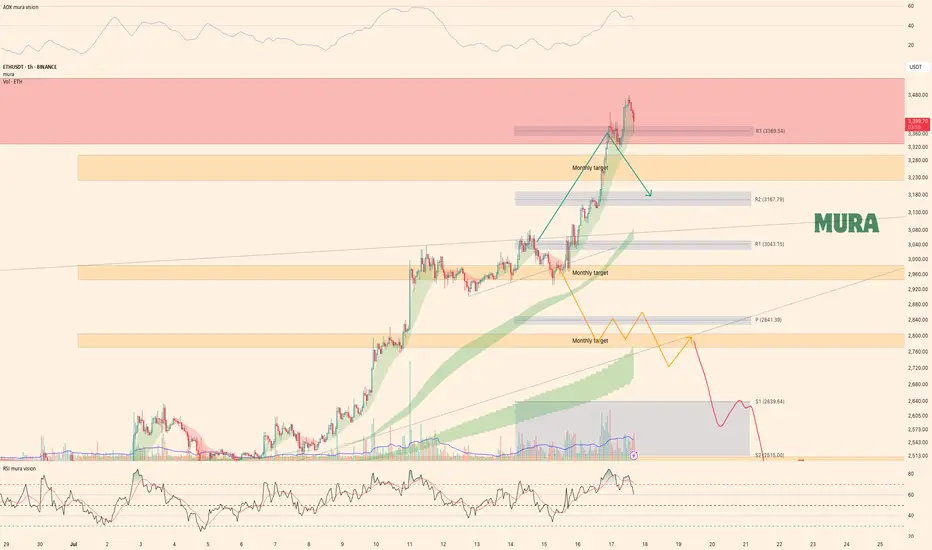
Ethereum Weekly UpdateAs anticipated, Ethereum has achieved all weekly targets, perfectly following our bullish (green) scenario. Price currently tests a key resistance zone after:
Holding critical monthly support at $2,966
Rallying to our projected upside targets
Technical Observations:
Bearish Divergence (4H RSI)
Trend Weakness (H1 & H4 ADX decline)
Seller Reaction at resistance, yet holding above $3,300
Key Levels:
Break above resistance → Continuation likely
Break below $3,300 → Pullback toward $3,000-3,100 expected
Conclusion:
While the trend remains intact, weakening momentum signals potential short-term correction. Trade plan aligns with Monday’s video analysis.
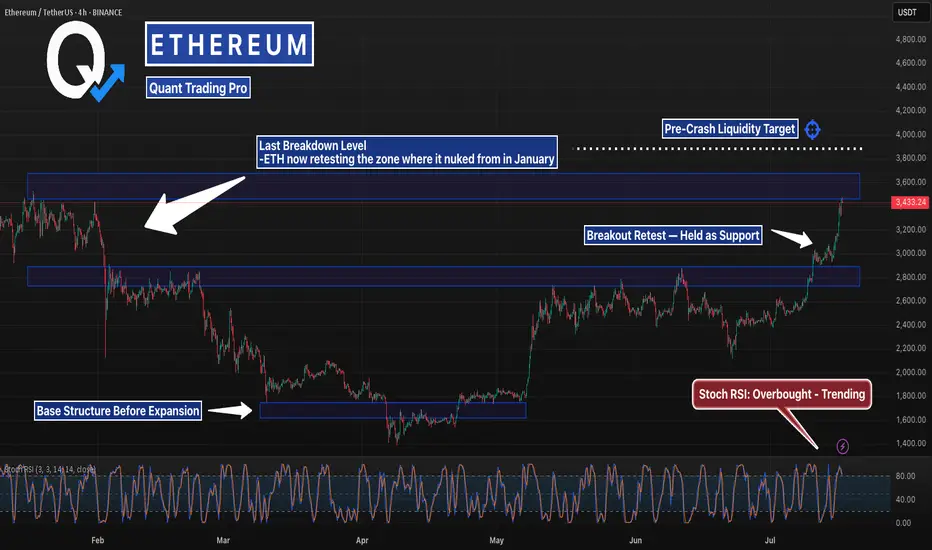
This Level Crashed ETH Last Time… It’s BackETH just blasted back into the same zone it collapsed from in January — but this time the structure underneath is stronger, tighter, and holding.
Stoch RSI is stretched, but bullish momentum remains intact. If it clears $3,870, lights out.
#Ethereum #ETHUSD #CryptoCharts #BreakoutLevels #ChartAnalysis #TradingView #QuantTradingPro #CryptoTraders #BacktestEverything
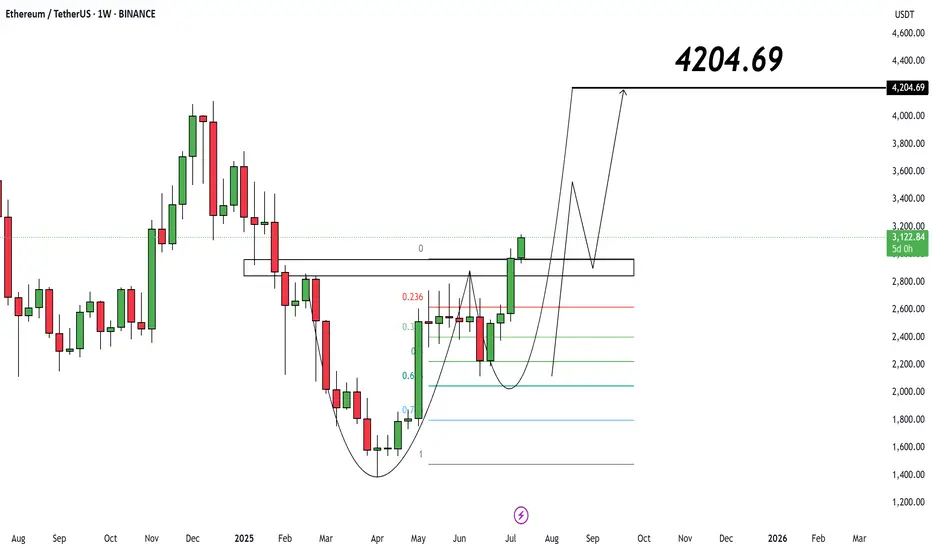
Ethereum ($ETH/USDT) – Weekly Analysis
Current Price: $3,127
📌 As long as ETH holds above $2,950, the bullish structure is intact.
🎯 Target:
• $4,204.69
🔍 Price is building momentum after multi-week consolidation. Pullbacks to $3K are potential re-entry zones.
ETH is testing resistance. False breakout?ETH is gathering liquidity ahead of a possible decline
The gray square is the active buying zone. When the price returned below the 3040 level, a liquidation phase occurred. Against the backdrop of the news, a retest of resistance is forming, but not with the aim of breaking through the level, but with the aim of gathering liquidity for a move to 2960-2913.
A false breakout of resistance could trigger another phase of liquidation (correction) to 2961. A halt should be expected in the 2900 zone.

$eth/usdt short swing zoneth: htf/ltf liq + stop hunt (1.204 fibonacci) + ote zone (88.6/91.5 fibonacci) + bat harmonic

ETHEREUM → Correction to 2900 before growth BINANCE:ETHUSDT is entering a correction after a strong breakout of resistance. At the same time, Bitcoin is falling from 123K to 116K, triggering a pullback across the entire market...
On D1, ETH is facing strong resistance and is not yet ready to break it (it lacks strength after the rally). The most likely scenario after a false breakout is a correction to support. But the main focus is on Bitcoin — will there be a correction or a reversal of the local trend? If the flagship continues its decline, the cryptocurrency market will humbly follow suit.
ETH has a nearest zone of interest at 2913, where liquidity capture could attract buyers, but I do not rule out the possibility that the correction could go much deeper before further growth, for example to 2879-2827 (support on D1).
Resistance levels: 2992, 3041
Support levels: 2913.7, 2879, 2827
Technically, consolidation against a bullish trend. Confirmed support area 2913 - 2879. As part of the correction, the market is interested in capturing liquidity. If, against the backdrop of the current correction, the bulls manage to hold their ground above the specified support, ETH may still surprise us with its growth :)
Best regards, R. Linda!

eth buy longterm"🌟 Welcome to Golden Candle! 🌟
We're a team of 📈 passionate traders 📉 who love sharing our 🔍 technical analysis insights 🔎 with the TradingView community. 🌎
Our goal is to provide 💡 valuable perspectives 💡 on market trends and patterns, but 🚫 please note that our analyses are not intended as buy or sell recommendations. 🚫
Instead, they reflect our own 💭 personal attitudes and thoughts. 💭
Follow along and 📚 learn 📚 from our analyses! 📊💡"

ETH LONG TRADELooking for a retest of approximately $3000 for a bounce off the top of the prior channel.

The Loudmouth Pattern: It Yells, We Trade!
On the 30-minute chart, ETH is forming a classic Broadening Formation – or as some traders like to call it, “The Big Mouth Pattern” 😄. It’s noisy, unpredictable at first glance, but when it speaks, you’d better listen.
Right now, price is moving through the bullish leg of this setup, and if momentum holds, we’re eyeing the $4,000 psychological level, followed by the $4,120 – $4,170 supply zone.
🔹 Bullish Scenario (our expected outlook):
🎯 Target 1: $4,000
🟩 Main Resistance: $4,120 – $4,170
❌ Invalidation: Confirmed close below $2,946
If price breaks and holds below that red support zone, this setup gets thrown out the window.
📊 Risk Management:
Scale in on pullbacks – if structure remains valid
No chasing without confirmation
Keep risk under 1% of total capital
📈 The market’s big mouth is open – and until it closes below $2,946, we’re listening for bullish signals. 🤑

eth mini scalp simple trade using order block 15minutes , but its not powerfull ob so maybe can go to our sl , just manage the risk , dyor!
