DeGRAM | ETHUSD above the resistance area📊 Technical Analysis
● Price burst through the 12-week compression roof, converting the 2 990 supply into support and printing the strongest close since March.
● The pull-back just retested both the purple trend-fan and the 2 960 flip zone; the active rising channel and flag depth map the next magnet at 3 410.
💡 Fundamental Analysis
● SEC’s 12 Jul request for updated spot-ETH ETF S-1s hints at imminent approval, fuelling fresh inflows.
● Glassnode reports the largest daily net-staking deposit since April, reducing exchange float and adding bid pressure.
✨ Summary
Long 2 960-3 000; holding above 2 990 targets 3 110 → 3 410. Bias void on an H4 close below 2 860.
-------------------
Share your opinion in the comments and support the idea with like. Thanks for your support!
ETHUPUSDT trade ideas

Don't miss Ethereum todayHello friends
Given the good rise we had, you can see that the price has entered a correction and has provided us with a good opportunity to buy in steps, of course with capital and risk management.
*Trade safely with us*

#ETHUSDT: Time For Big Price Distribution! Get Ready $5000ETH is currently in distribution and is on our target list. We expect a smooth price movement, potentially reaching $3100, $3800, and $5000. Use the entry zone to take a position; anything below the entry will invalidate the idea. Please use accurate risk management while trading.
Like, comment, and share this idea to encourage us to post more.
Team Setupsfx_

#ETH is about to reach the resistance zone 📊#ETH is about to reach the resistance zone ⚠️
🧠From a structural perspective, we are about to reach the resistance zone at the daily level, so we need to be wary of the risk of a pullback. If your cost price does not have much advantage, then please remember to lock in profits in time.
➡️New long trades need to wait patiently for a pullback to occur before participating, or the trend is relatively strong, and continue to consolidate sideways to form a new long structure to continue the long trend, otherwise we can't chase the rise near the resistance zone.
Will we start a pullback from here? Let's see 👀
🤜If you like my analysis, please like 💖 and share 💬
BITGET:ETHUSDT.P

HolderStat┆ETHUSD prepare for a breakthroughBINANCE:ETHUSDT is trending upward with strong conviction after triangle breakouts and clearing the $2,900 level. Structure points toward a move into the $3,300–$3,400 region. The trend is reinforced by repeated bullish retests and channel momentum.

Ethereum (ETH): Yesterdays Target Reached | Now Looking at $4000Ethereum is on fire, where our yesterday's target was reached without any hesitation.
Now we shared a TA this week on a weekly timeframe where we showed that one of our major targets is $4000. So we are aiming to see that one to be reached now; momentum is good so we might as well fill it quite quickly.
Swallow Academy
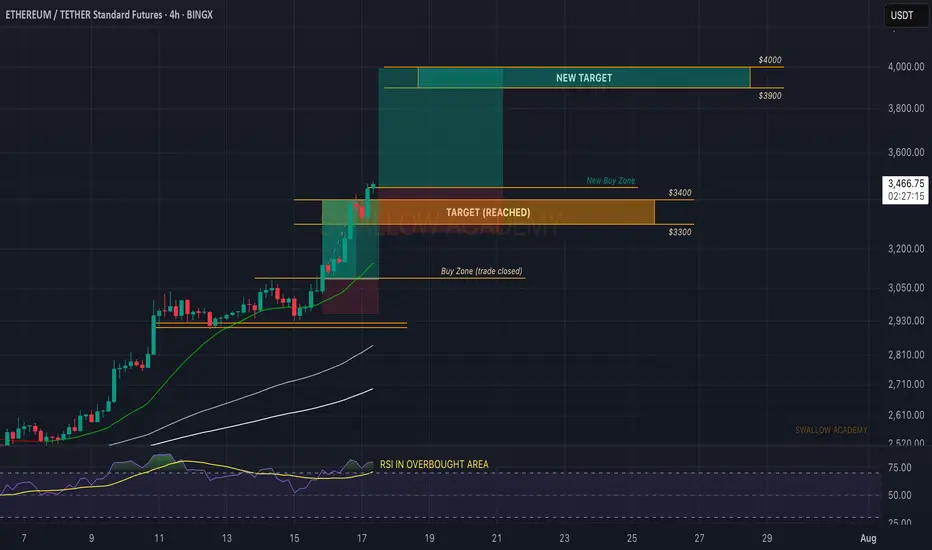
Resistance zone: 3265.0-3321.30
Hello, traders.
If you "Follow", you can always get the latest information quickly.
Have a nice day today.
-------------------------------------
(ETHUSDT 1D chart)
It is showing an upward breakout of the important zone of 2419.83-2706.15.
We need to see if the price can be maintained by rising above the Fibonacci ratio of 0.5 (2788.93).
If so, it is expected to rise to the resistance zone of 3265.0-3321.30.
The important zone of 2419.83-2706.15 is the support and resistance zone that can lead to a full-fledged uptrend.
Therefore, if it falls below this zone, we should stop trading and watch the situation.
-
Thank you for reading to the end.
I hope you have a successful trade.
--------------------------------------------------
- This is an explanation of the big picture.
(3-year bull market, 1-year bear market pattern)
I will explain more details when the bear market starts.
------------------------------------------------------


#ETH Update #4 – July 17, 2025#ETH Update #4 – July 17, 2025
Ethereum is currently facing a significant resistance zone. The recent bullish move has been very steep, which often leads to a correction. If that happens, the first potential retracement level is around $3,010.
If Ethereum continues to rally without correcting, the next upside target is $3,700. However, USDT Dominance has reached a support level. If that support holds, we could see capital rotation into USDT, accelerating a pullback in ETH.
At this point, a slowdown in Ethereum’s momentum is likely. If you're holding altcoins, it might be a good moment to take some profits.

Can a Bear Market Start With Ethereum At $3,000?Ethereum produced sideways action for 49 days, 7 weeks. Immediately after seeing this I realized the next logical step was a bullish breakout, and the market moved up. But this isn't all. Ethereum is still trading at $3,000, more than $1,800 away from its all-time high.
Now, thinking about the doubt that always creeps up when the market becomes bullish confirmed, I want to clear things up if at least for you. While others can continue to doubt and will continue to do so, many others will even SHORT and lose everything, you will be happy knowing that the market will experience additional growth. You will also be making profits as the market grows. You will be happy because you know for a fact, based on data, that we are set to experience sustained long-term growth.
A bear market can only develop after a bull market. A bull market ends in a major high or new all-time high. Current conditions for ETHUSDT are far from being "peaky." There is no new all-time high. Actually, prices are still relatively low.
First Ethereum needs to challenge its previous all-time high, create a new one and then we can talk about a bear market or correction. We know for a fact that Ethereum is bullish based on recent price action and the chart. We know for a fact that Ethereum will grow because Bitcoin is already high up. Ethereum is the #2 Crypto and what Bitcoin does it tends to follow.
Bitcoin is super strong but this is not to be confused as weakness. Weakness comes when the market has been growing for too long, growth becomes heavy and a drop happens next. Strength happens when the market has been sideways for months, breaks up and produces a major advance (now). This type of pattern predicts additional growth.
Bitcoin is the king and what Bitcoin does the rest follows. You can expect additional growth.
The reason why the bullish cycle is not yet over is because prices are still too low. Many altcoins are trading near all-time lows. Think about it. A bear market develops from all-time highs and bull markets develop from all-time lows. We are only at the start of a major bullish cycle, phase and wave.
The proof is in the chart. A major low was hit 7-April 2025, the lowest since March 2023. This marks the end of the correction and the start of the 2025 bullish phase. I don't know if Ethereum will grow for years or only for a few months. I know with 100% certainty that the Cryptocurrency market will continue to grow. You can bet your house on it.
Thanks a lot for your continued support.
Namaste.

From now on, be careful!!Hello friends..
We are back with a new analysis of the Ethereum cryptocurrency, from the area I had previously specified, we are currently in profit by about 120%. (We gave a buy signal to the good cryptocurrencies in the market at the peak of market disappointment, you can enter the page to view.)
Now we have reached the resistance area where correction is possible, there is a strong resistance from the $3400 to $3600 area, you can sell 50% of your assets in this area if confirmed and add to your assets if corrected (I will indicate the buy areas in the next analysis).
If you have a cryptocurrency that you want us to analyze for you, you can write the name of the cryptocurrency in the comments, and wait for the analysis post (priority is given to the cryptocurrency that gets the most likes)
Don't miss our page in these bullish days of the market. (You won't lose

Ethereum's Road to $7500 – Strategic Entries & Profit Optimizati🔵 Entry Zone: My first position is placed at $2225.5, aligning with a strong support level, while a secondary entry at $1857.5 serves as an additional safeguard against unexpected market swings—lowering my average purchase price and protecting capital.
💰 Profit-Taking Strategy: For low-risk traders, securing a 40% profit from the first entry is a prudent move to lock in gains early. However, my long-term target remains ambitious.
🚀 Main Target: Based on valuation models and fundamental news, Ethereum’s upside potential points toward $7500. However, I personally plan to secure 90% of my holdings at $6000, ensuring strong profit realization while leaving room for further upside.
This setup balances risk management, smart positioning, and strategic profit optimization. Let’s see how ETH’s trajectory unfolds!
Entry1: 2225.5
Entry 2: 1857.5
If your second entry is successful, you are required to withdraw 50 to 70 percent of your capital to maintain your capital. I will definitely update this setup.

ETH — 3D OB + FVG Swing Long | #3D | BULLISH1️⃣ Buy zone: 2,500–2,600
2️⃣ TP: 3,280–3,495
Stop: < 2,500
Alert: FVG fill

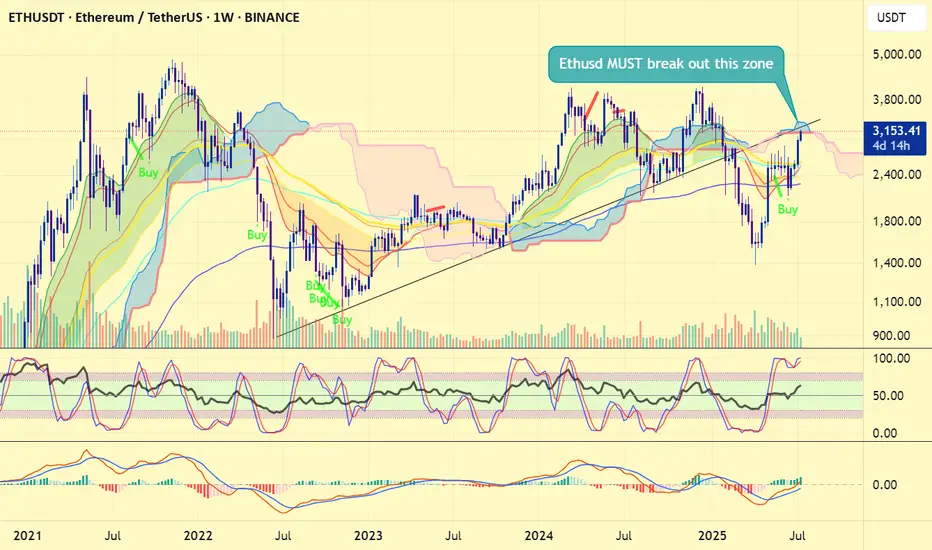
Ethereum price is critical now#ethereum #eth price is now testing very very important resistance zone now and this also the bearish retest if #ethusd fails to leap over 3500 usd. 4 months ago, #ethusdt breakdown the 3 years of trendline, heavily dumped below 1400 usd and bounced. Now, CRYPTOCAP:ETH is testing this 3 years of trendline resistance zone + weekly ichimoku cloud.
Therefore ETH price has no other chance to at least reclaim 3450 - 3500 usd. True bullrun requires a new ATH. Heavy declination at current zone will not be tasty. This week' s close will determine the things i think.
Not financial advice.
Ethereum (ETH): Buy Entry 2 Reached | $3300-$3400 IncomingNo remorse from buyers on ETH, where the price is pushing further and we are looking now at our new target, the $3300-3400 area, to be reached within this week.
There is not much more to talk about here, other than that we keep our bullish view (that we shared on a weekly timeframe).
Time for Ethereum to shine.
Swallow Academy

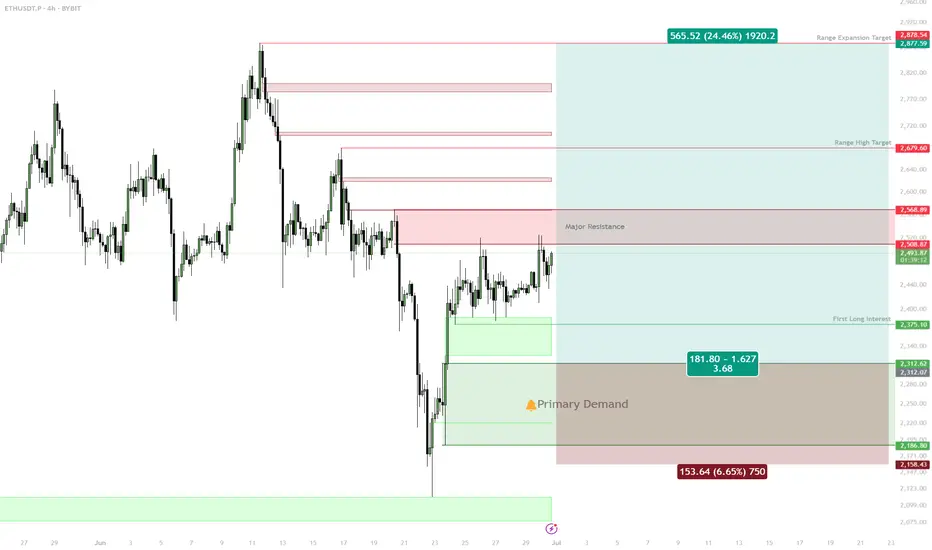
ETH: Deep Retrace or Shallow? Two Key Long Zones into Next Week✅ Two main long setups: Equal Lows @ $2,376, Untapped Demand $2,250–$2,314
✅ Best R/R from deeper demand zone, but will watch both levels
✅ Targets: $2,738 (range high), ~$3,000 (expansion)
✅ Shallow retrace may limit upside to a new local high, not full expansion
Setup 1:
Buy trigger on sweep and reclaim of $2,376 (equal lows)
Target: $2,508, then $2,738
Setup 2:
Preferred: Buy trigger into $2,250–$2,314 untapped demand
Target: $2,738, $3,000
Risk:
Wait for reaction/confirmation at both zones; no FOMO in between
🚨 Risk Warning:
If no strong bounce from these levels, stand aside — don't force the setup.
ETH's Situation, A Comprehensive Analysis !!!As I said, and no one believed, the cup and handle pattern has completed and broken out, which could quickly drive the price above $4000.
previous Analysis
Best regards CobraVanguard.💚

Ethereum (ETH): Targeting $3300-$3400 | Detecting Buy ZonesIt's not a secret to anyone that we are targeting $3300-$3400 next on ETH, where we have detected 2 potential buy zones for us.
One of the zones is near the lower support area, where we should see proper MSB in order to enter into a trade, which would mean a switch in trend.
The second entry is upon forming BOS on upper zones, which would be the ideal buying entry for us if performed well (I mean the break of structure).
Swallow Academy

Is ETH overextended and due for a correction?For those holding ETH, this is a good point to set up a hedge using derivatives.
If the price keeps going up (which I think is unlikely at this moment—perhaps it will move sideways), buying at these levels is crazy.
In fact, there’s been a recent rally, full of people on X and YouTube saying this is the big moment to buy… That immediately raises a red flag for me!
And what about the FEDFUNDS? Have you taken a look? Haha, just something to think about.
--
After a long time away from TradingView and the community, I’m back to breathe some life into it!
Missed you all — let’s enjoy life and make the most of what it has to offer!
ETH - Confirmed target is 4100- After successfully breakout from the major resistance price is heading towards the next resistance line.
- From the previous all time high, we have a clear resistance around 4100 range.
- We can expect this bullish trend to continue easily and reach the next resistance around 4100.
Stay tuned for more updates
Cheers
GreenCrypto

#ETHUSDT: Currently On The Way Towards Filling The FVG?ETCUSDT is currently experiencing a significant correction as the price approaches a pivotal juncture where a substantial bullish price reversal is anticipated, potentially propelling it to new all-time highs or even surpassing them. It is imperative to exercise meticulous risk management and conduct your own thorough analysis before engaging in any cryptocurrency trading or investment activities.
Should the price indeed undergo a major correction, it is likely to decline to our second designated area, where it is anticipated to fill the liquidity gap and subsequently reverse course, continuing its trajectory towards our established targets.
Please consider this analysis as a secondary influence only, or even solely for educational purposes. It is crucial to conduct your own independent analysis and risk management prior to engaging in any cryptocurrency trading or investment endeavours, as they inherently carry substantial financial risks.
We extend our best wishes and encourage you to trade safely and responsibly.
Should you wish to demonstrate your support, you are welcome to express your appreciation through likes, comments, or sharing this information.
Thank you for your consideration.
Have a pleasant weekend.
Team Setupsfx_

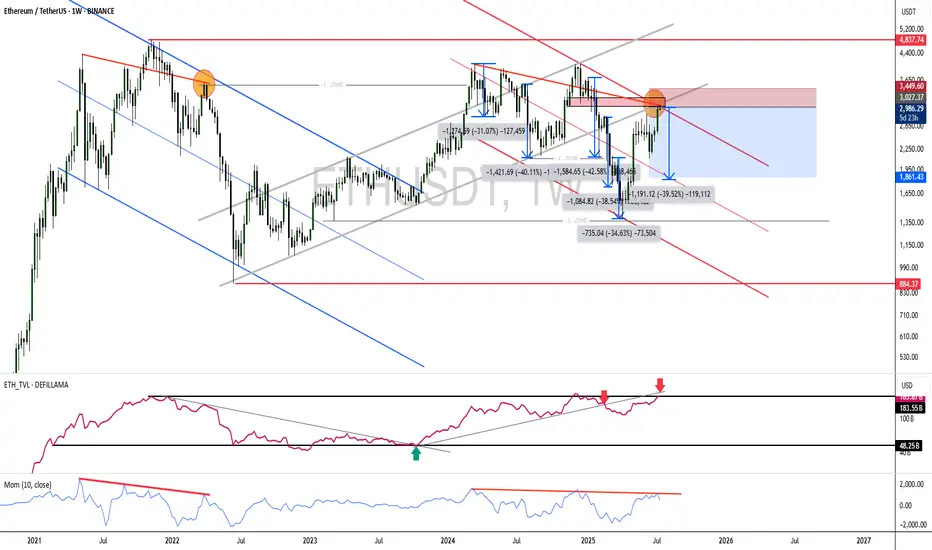
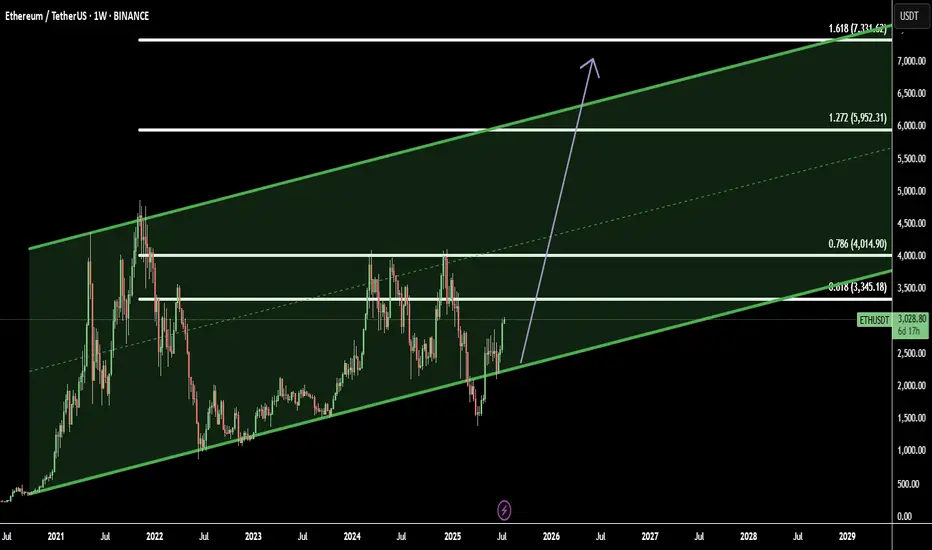
Ethereum in Ascending Channel: Targeting Weekly Breakout ZonesEthereum (ETHUSD) is currently trading within a well-defined ascending channel on the weekly timeframe, indicating sustained bullish momentum. This structure suggests higher lows and higher highs, consistent with a long-term uptrend.
Based on this formation, I’ve identified four key target zones as ETH continues to respect the channel boundaries:
Target 3345.18: Initial resistance area, likely a short-term reaction zone
Target 4014.90: Mid-channel resistance — potential consolidation point
Target 5952.31: Upper bound of the channel — critical breakout test
Target 7331.62: Extension level — price discovery zone if breakout is confirmed
Traders should monitor price action closely near each level. A strong breakout above the channel top could signal continuation toward uncharted highs, while a breakdown may invalidate the pattern.
Disclaimer: This is not financial advice. Please do your own research and manage risk accordingly.
ETH – $7k Target in Sight
7k incoming on CRYPTOCAP:ETH —timing is up in the air, but the chart looks stellar.
A decisive break above $3,500 should kick off aggressive expansion.
Meanwhile, ETHBTC has been rallying hard off its lows; I’m eyeing a 50% gain against BTC over the next 2–3 months.
Holding through this strength makes sense—it’s been a long time since we’ve seen these setups.
