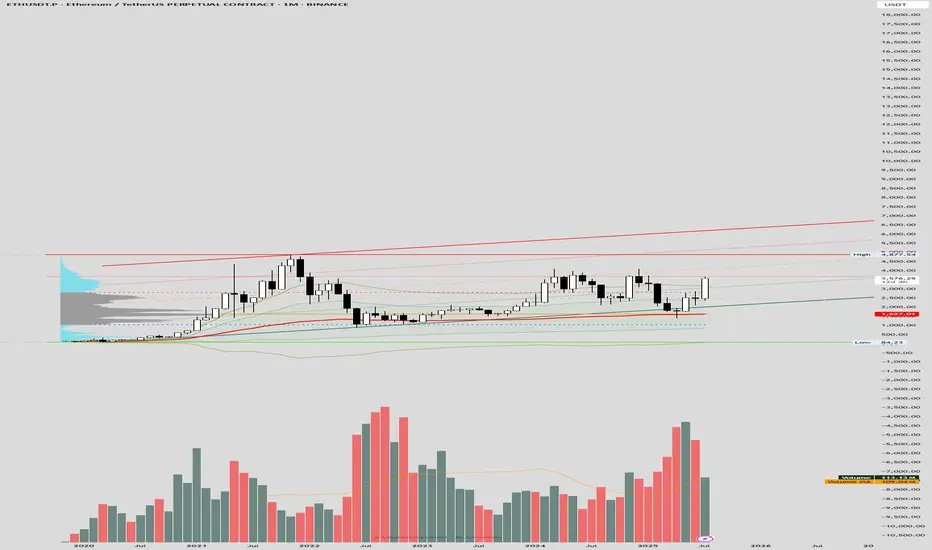
ETH Monthly Chart (AVWAP)The chart highlights a bullish structure with the AVWAP providing key dynamic support and resistance levels. The price has recently approached the upper AVWAP deviation around $4,977.54, aligning with the prior bull flag scenario's resistance zone. The red trendline indicates a potential upper boundary, while the green and orange lines suggest intermediate supports and resistances, with the current price near $3,579.48 testing the middle range. The lower AVWAP deviation near $842.23 serves as a critical invalidation level. Volume remains supportive, with spikes corresponding to price movements, and the volume moving average (109.4k) indicates steady activity.
Real-time data shows ETH trading at $3,565-$3,600, consistent with the chart's mid-range levels, driven by ETF inflows and on-chain activity. A breakout above $3,700-$4,000 with increased volume could target $3,834-$4,000 or higher, while support at $2,533-$2,700 remains vital. Sentiment on X and web sources is optimistic, though volatility persists due to external factors.
ETHUPUSDT trade ideas
ETH Monthly ViewThe monthly chart suggests a potential bull flag pattern, with a strong upward trend followed by consolidation. The "Vector Candle Gap" indicates a breakout zone around $4,977.64, with recent price action testing resistance near $3,700-$4,000. Volume trends support the bullish case, showing increased activity during the initial rise and consolidation. The moving average reinforces an upward trajectory, but a downward-sloping trendline and support at $933.19-$2,800 suggest invalidation risks if the price drops below these levels.
Real-time data shows ETH trading at $3,565-$3,600, bolstered by institutional inflows into spot ETH ETFs and on-chain activity. The bull flag aligns with a potential target of $3,834-$4,000 if the breakout sustains with strong volume. Key support lies at $2,533-$2,700, with sentiment on X and web sources remaining optimistic, though volatility persists due to macroeconomic and regulatory factors.

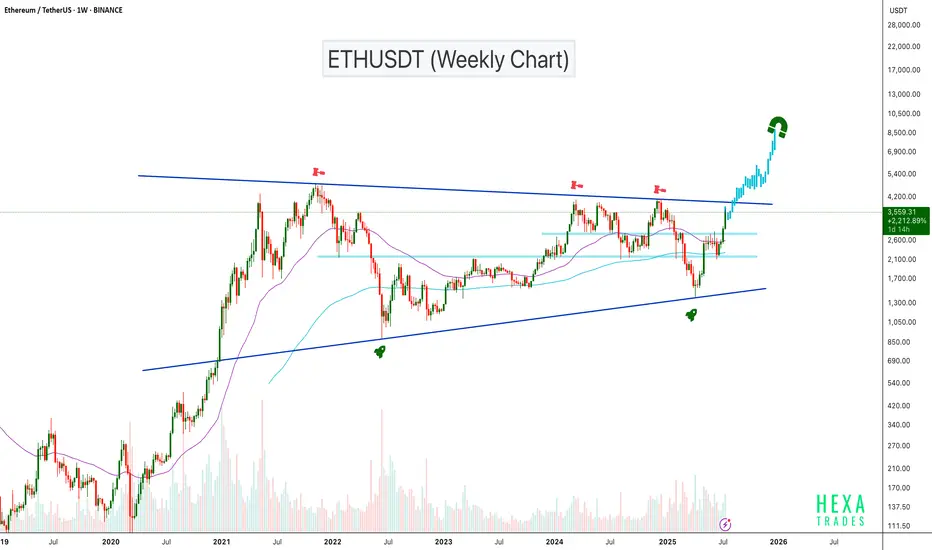
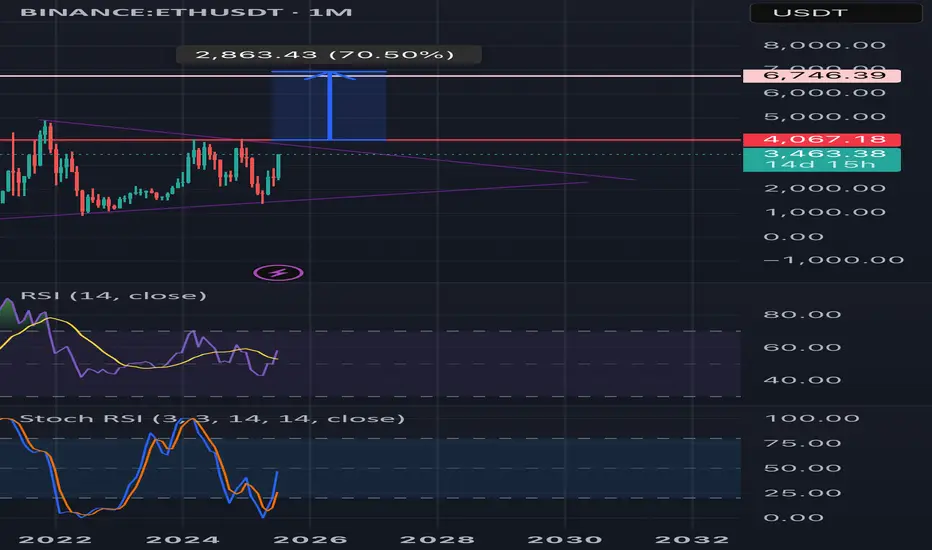
ETHUSDT Gearing Up for Explosive MoveBINANCE:ETHUSDT has been trading inside an ascending triangle pattern for the past 1,600 days. The price is now moving toward the triangle's resistance zone with strong volume support. A confirmed breakout above this resistance could trigger a powerful bullish move, with potential targets in the $6,000–$8,000 range.
Cheers
Hexa🧘♀️
BITSTAMP:ETHUSD
Best Buy Entry for EthereumIn my opinion, if Ethereum is going to make a minor pullback, the best entry zones have already been marked with arrows on the chart.
However, if the price continues upward without a correction, we should wait for clear confirmation, as the bullish momentum appears weaker compared to the previous move

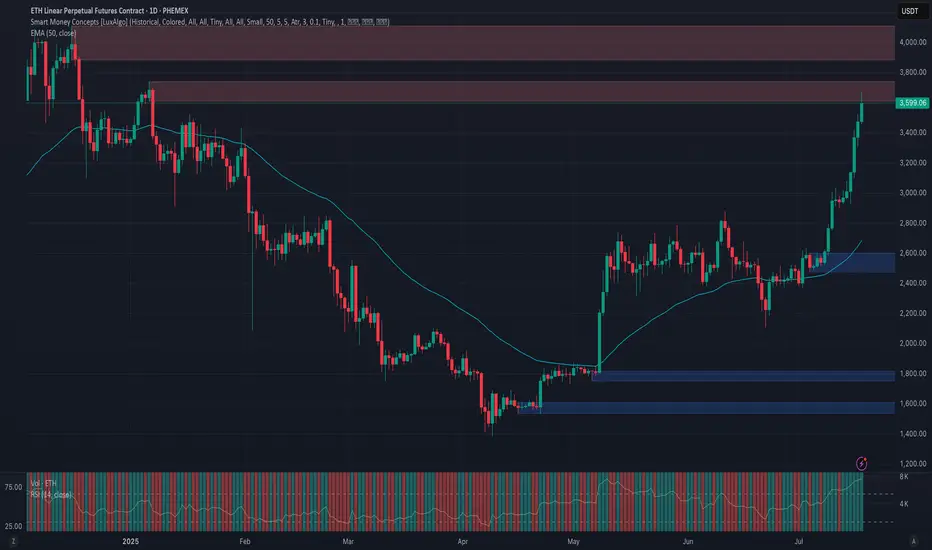
Phemex Analysis #98: ETH Price Explodes— Is $5,000 Finally Next?Ethereum ( PHEMEX:ETHUSDT.P ) has recently shown impressive strength, surging past significant resistance levels and stirring excitement in the crypto market. After an extended consolidation, ETH decisively broke through the crucial $3,300 resistance level, rallying more than 15% in just three days, and is now trading confidently around $3,500.
This renewed bullish momentum has traders and investors eagerly speculating: Could this be the start of Ethereum's next major run? Or should caution prevail amid ongoing market uncertainty? To help navigate this critical period, let's explore several key trading scenarios.
Possible Scenarios
1. Bullish Continuation – Targeting New Highs
Ethereum’s recent breakout above the $3,300 resistance signals strong bullish sentiment. If buying volume continues increasing, ETH could swiftly move towards higher resistance levels at $3,800 and potentially challenge the psychological milestone of $4,100.
Pro Tips:
Profit Targets: Consider locking in partial profits as ETH approaches strong resistance zones around $3,800 and $4,100.
Risk Management: Place tight stop-loss orders on recent lows, approximately around $2,902 to minimize downside risks.
2. Short-term Retracement – Healthy Pullback
Given ETH’s rapid surge, a short-term pullback to retest the recently broken resistance zone at $3,300 to $3,000 (now acting as strong support zone) is plausible. A successful retest would strengthen the bullish case, signaling healthy consolidation before further upward momentum.
Pro Tips:
Buying the Dip: If ETH holds above $3,000 with declining volume, consider cautiously adding to your positions or initiating new longs.
Volume Confirmation: Closely watch trading volume; lower volume during pullbacks typically indicates a healthy retracement rather than a bearish reversal.
3. Bearish Reversal – Breaking Below Critical Support
If Ethereum’s price experiences heavy selling pressure and breaks below the key support at $3,000, bearish sentiment could escalate, potentially driving ETH towards lower support levels near $2,470 and possibly even $2,110.
Pro Tips:
Short Positions: Experienced traders might consider initiating short positions if ETH decisively breaks below the crucial $3,000 support zone on increasing selling volume.
Long-term Accumulation: Long-term investors may strategically accumulate ETH near stronger support areas at $2,470 and $2,110, after clear signs of price stabilization.
Conclusion
Ethereum (ETH) currently offers attractive opportunities, propelled by recent bullish momentum yet balanced by market uncertainties. Traders must closely observe key resistance at $4,000, critical support around $3,000, and carefully analyze trading volumes for confirmation of market direction. By maintaining disciplined risk management and strategically capitalizing on outlined scenarios, investors can effectively navigate ETH’s price action in the weeks ahead.
🔥 Tips:
Armed Your Trading Arsenal with advanced tools like multiple watchlists, basket orders, and real-time strategy adjustments at Phemex. Our USDT-based scaled orders give you precise control over your risk, while iceberg orders provide stealthy execution.
Disclaimer: This is NOT financial or investment advice. Please conduct your own research (DYOR). Phemex is not responsible, directly or indirectly, for any damage or loss incurred or claimed to be caused by or in association with the use of or reliance on any content, goods, or services mentioned in this article.
ETH vs 200MA: Another TestETH on the daily has been pushed back so many times by the 200MA. Will price conquer it this time? I guess we’ll just have to wait and see.
Today is Friday, July 4th, so probably a long weekend for most traders. Somehow, price got pushed back again. Just a hunch, but I believe long traders are touching grass this weekend while sellers are grinding.
Anyway, we now have a support zone under price, made up of the 200MA and the 0.5 Fib — which, in theory, should hold against any attempts to push the price lower this weekend.
Always take profits and manage risk.
Interaction is welcome.

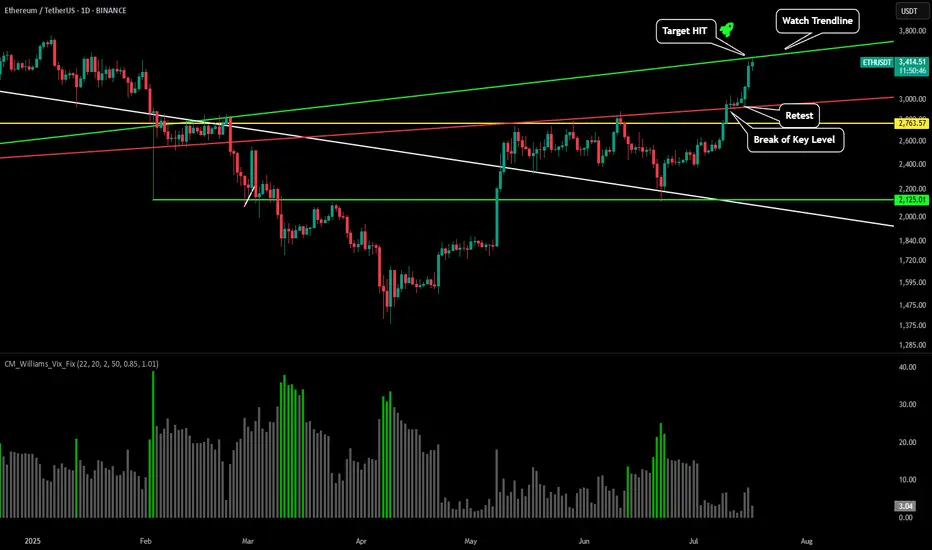
ETH - Charts Don't LiePlease refer to our previous post:
As stated here after breaking our red key trendline our prediction was price would move up swiftly to test the green trendline between between $3,400-$3,500.
After a successful retest of the red trendline it only took price 48 hours to increase 19% and reach our green trendline. This is a major area where we could see some profit taking starting to occur.
Once price is able to break through this level we should see a move to the most important price zone throughout the past couple years around $4k-$4,100.
ETHUSDT UPDATELooking at the ETH daily chart, we see a flag formation. If it breaks, it could take us to 3500.

Upward breakout for ETH monthly?🟣 Ethereum Monthly Timeframe Analysis – Large Symmetrical Triangle
📌 Current Situation:
• On the monthly chart (1M), Ethereum (ETH) has formed a large symmetrical triangle pattern.
• This pattern typically signals a major price consolidation before a significant move.
• The descending resistance line connects the 2021 all-time high to recent lower highs.
• The ascending support line is drawn from the 2018 low through the 2022 bottom.
• Price is nearing the apex of the triangle, indicating a breakout is likely soon.
⸻
🔼 Bullish Scenario (Breakout to the Upside):
If ETH breaks above the triangle resistance and confirms the move:
✅ Signs of a Bullish Continuation:
• Strong breakout above the $4,000–$4,500 zone
• Increased volume confirming breakout
• Price holds above resistance-turned-support
🎯 Potential Price Targets by 2027 (based on triangle height & Fibonacci projections):
1. Target 1: $6,800 – $7,500
2. Target 2: $9,000 – $10,000
3. Long-term Target: $12,000 – $15,000 (if macro bull market continues)
⸻
🔽 Bearish Scenario (Fakeout or Breakdown):
If the breakout fails or price breaks down:
• ETH could revisit lower supports around $2,000 or even $1,400
• Bullish momentum delayed until another strong base forms
⸻
🔍 Conclusion:
• This triangle could mark the beginning of a major rally into 2027, especially if supported by fundamentals (e.g., ETF approval, DeFi growth).
• Wait for a confirmed breakout with volume and retest before entering a long-term position.
ETHUSDT minor trendsEthereum BINANCE:ETHUSDT is downtrend with lower highs from the bottom is nearly finished 📉 . For a stronger rise, it needs to stabilize above $2500 ⚡. Mid-term targets are $3300 (end of second leg) and $3700 (major resistance) 🎯. Key supports are $2500, $2070, $1800, and $1550, the base where the uptrend began 🛡️.
Supports & Resistances:
Supports: \$2500, \$2070, \$1800, \$1550
Resistances: \$2500 (critical level), \$3300, \$3700

Divergence Gap on CMP PAR indicatorPlaying the Divergence Gap on CMP PAR indicator to compound longs/shorts in a strong trebnd.

Ethereum Wave Analysis – 16 July 2025
Ethereum: ⬆️ Buy
- Ethereum broke resistance area
- Likely to rise to resistance level 3400.00
Ethereum cryptocurrency recently broke the resistance area located at the intersection of the resistance level 3200.00 and the resistance trendline of the daily up channel from May.
The breakout of this resistance area should accelerate both of the active impulse waves 3 and (3).
Given the clear daily uptrend, Ethereum cryptocurrency can be expected to rise to the next resistance level 3400.00 (which reversed Ethereum multiple times in January).

ETH to $4K ? Whales Accumulate as ETFs Break Records🕞 Timeframe: 4H
.
🟢 Bias: Bullish
1. 🧭 Fundamental Overview:
📈 Massive Institutional Inflows:
Ethereum ETFs have recorded over $1.2 billion in net inflows this July, with $908M just in the week ending July 11. This strong demand from institutional players (notably through ETHA and Bitwise) has pushed ETF AUM above $13.5 billion.
🏢 Corporate Accumulation:
Companies such as SharpLink Gaming have begun adding ETH to their balance sheets. SharpLink's 10,000 ETH (~$49M) purchase highlights growing corporate adoption of Ethereum as a store of value and strategic reserve.
🛠️ Ecosystem Resilience:
Ethereum continues to lead in network upgrades (e.g., Dencun), institutional DeFi, and tokenized assets—strengthening the long-term fundamentals of the chain.
2. 🧠 Sentiment & On‑Chain Metrics
🏦 Institutional Sentiment:
Ethereum ETFs have seen 12 straight weeks of inflows, outperforming Bitcoin in institutional allocation growth (ETH: 1.6%, BTC: 0.8%).
🐋 Whale Activity & Exchange Flows:
Declining ETH balances on exchanges suggest accumulation and reduced sell pressure. Whales and smart money are taking positions.
📊 Public Sentiment:
Bullish expectations remain strong amid price consolidation above key levels and positive ETF momentum.
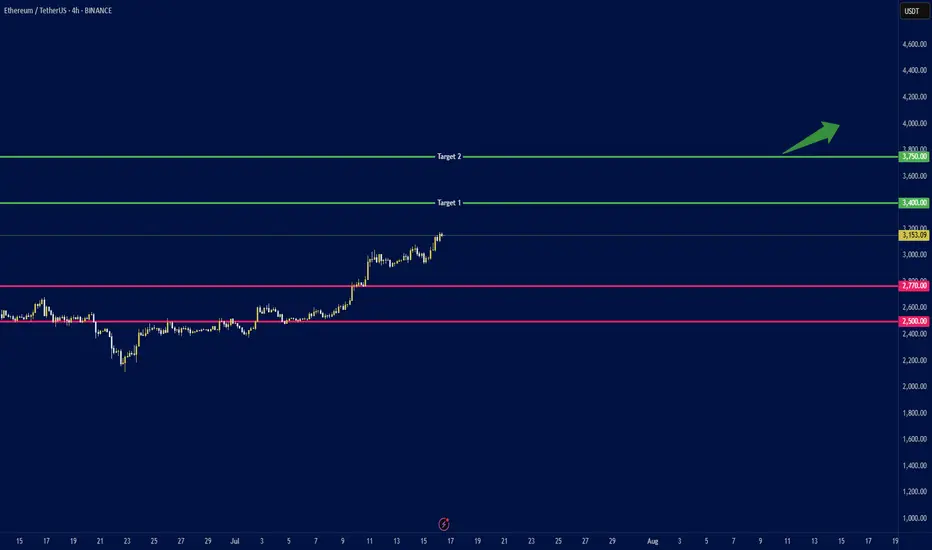
3. 🔼 Key Levels:
Support: $2,770 and $2,500 (major trendline and psychological level).
4.🎯 Price Targets:
Short‑term (2–4 weeks):
If ETH breaks above $3,150: next targets at $3,400 and $3,750.
Medium‑term (by end of Q3 2025):
ETH could reach $3,500 with potential upside to $4,000.
.
.
.
⚠️ Disclaimer: This analysis is for educational purposes and not financial advice. Please do your own research and risk management.
.
✅ If you like this analysis, don't forget to like 👍, follow 🧠, and share your thoughts below 💬!
ETHUSD – Final Resistance Test Ahead Ethereum is ripping toward a major historical resistance zone between $4,000–$4,300 — a level that rejected price cleanly in both 2024 and early 2025. With momentum high and sentiment bullish, this area becomes the real test of trend strength.
Failure here could form a triple top.
Breakthrough? Expect fireworks.
#ETHUSD #Ethereum #Crypto #ResistanceZone #SmartMoney #QuantTradingPro #TradingView

ETH Flash Crash Setup – Gaps Below to WatchEthereum broke out fast, too fast. In the process, it left two clear value gaps around $2850 and $2690 — areas where price barely traded. These usually get revisited.
I’m watching those zones for a potential flash crash setup. If we get a sharp wick down, that’s where I want to be a buyer. No chasing.
Limit orders layered in. Plan is simple:
$2850 — first tap
$2690 — full imbalance fill
Stops below $2600 if triggered
Not saying it has to happen, but if it does, I want to be ready. Mark your levels.
—
Trade safe. This is just my setup, not advice.

$ETH IS GOING TO MAKE ATHsBitcoin amd Etheureum will continue to rise until Ethereum clears these highs. The market is not done yet.
Although, I expect Bitcoin to retrace and consolidate more, i expect more bullish scenario’s than Bearish.

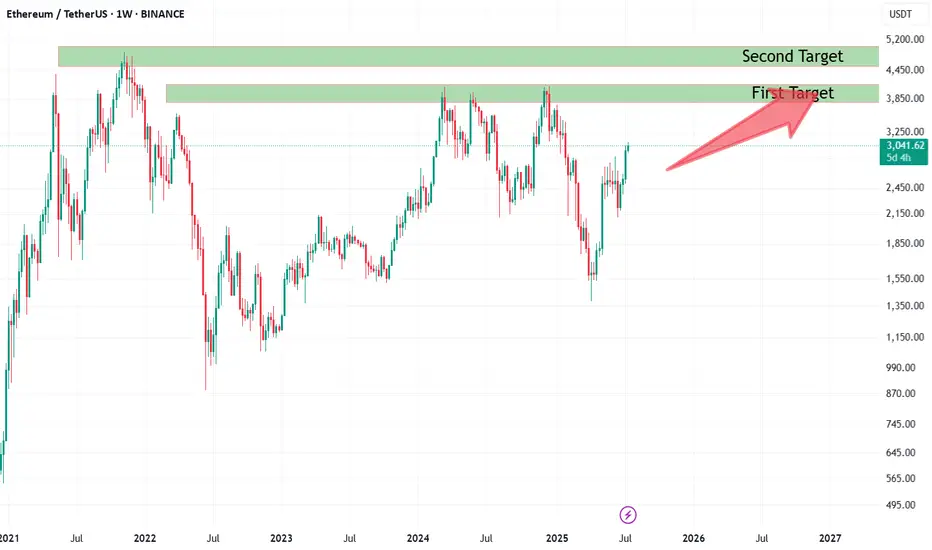
Binance Holds 25% of Exchange ETH: Smart Accumulation?According to cryptoonchain’s analysis of on-chain data from CryptoQuant, Binance now holds about 25% of the total Ethereum reserves across all exchanges. This significant figure could be a sign of smart accumulation by major market participants. Notably, Binance’s rising share has occurred while overall ETH reserves on exchanges have remained stable. In a situation where Ethereum’s price is still below its all-time highs—even as Bitcoin has set new records—this accumulation on Binance may signal that large investors are entering and expecting future price growth.
On the weekly chart, Ethereum is showing signs of strength and a possible continuation of its upward trend. If buyers maintain their momentum, the first target lies in the 3,900–4,200 zone, with the second target in the 4,850–4,950 range—close to previous all-time highs.
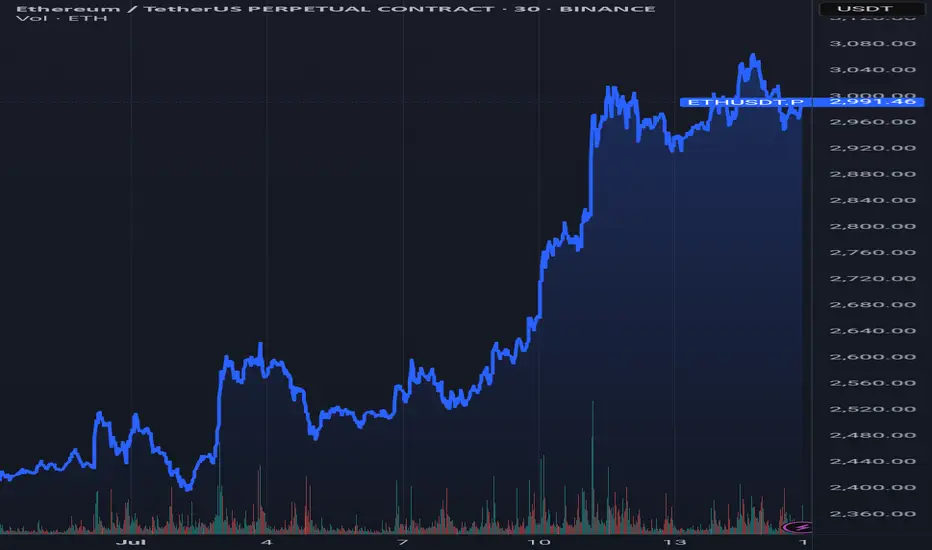
Ethereum trading planBINANCE:ETHUSDT showed a minor pullback compared to Bitcoin. The price attempted to retest the $3,082 level again but faced strong rejection. Right now, $3,043 is acting as our reversal level - if we break through it, we've got a clear shot at our monthly target of $3,259. But as long as we're trading below this level, our immediate target is to test the $2,800-$2,700 range. More details are in yesterday's video analysis
Watch the triggers, and happy trading

Ethereum:Daily signalhello guys👋
According to the drop we had, you can see that buyers came in and the price had a good growth, and after that a trading range was made in which the price got stuck.
Now, considering that the price is in the trading range and it seems that the buyers have shown their support, it is possible to step into the specified support areas with risk and capital management and move up to the set goals.
🔥Follow us for more signals🔥
*Trade safely with us*

Eth killer Today was a solid trading day with some interesting moves across the markets:
S&P 500: The market trended upwards from the open, gradually moving into and above the prior day’s value area, closing near the high of that range.
NASDAQ 100: After some initial back-and-forth, it climbed above the prior day’s high and value area, showing strength into the close.
Russell 2000: This market was quite choppy and balanced for a good part of the session, but eventually pushed up to close near the prior value area high.
Gold: It stayed range-bound, moving between the CVA high and the prior day’s value area without breaking out.
#ETH Update #3 – July 15, 2025#ETH Update #3 – July 15, 2025
After its recent impulsive move, Ethereum appeared to make a slight correction. However, this correction did not complete and instead formed a second peak. Since a full correction hasn't played out yet, caution is still warranted when trading Ethereum.
The first correction level is around $2,850, the second around $2,780, and the third around $2,700. If Ethereum pulls back to the second correction level, it will balance out the second imbalance zone created during the last impulse, which could allow for a healthier continuation upward.
As long as Ethereum doesn't break down below the $2,900 zone, I do not expect a correction. But if it does break below $2,900, corrections are likely to occur one after another.
At this point, neither a long nor a short position seems suitable for Ethereum.

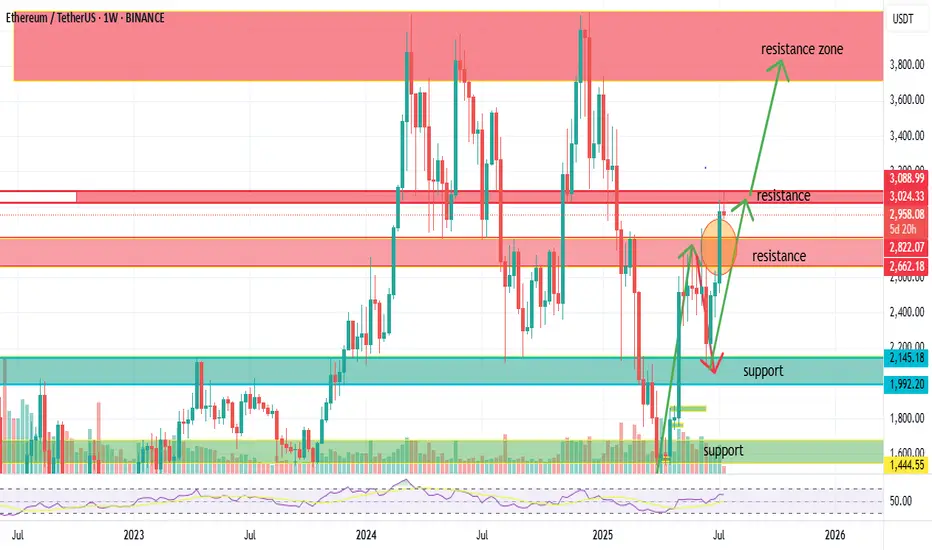
Ethereum Just Broke Out! Is $4,000 Next?Looking at the chart, ETH had a solid bounce from the key support zone around $1,992 to $2,145.
After consolidating, ETH broke above the critical resistance zone between $2,600 and $2,822 last week.
And more importantly – ✅ Last week’s candle closed firmly above this zone, backed by strong volume.
This was one of the most difficult resistance areas in recent months – and now that ETH has broken it, it’s a clear confirmation that the bullish trend is continuing.
🎯
📌 With this breakout confirmed, ETH is now targeting the next major resistance between $3,100 and $3,750.
If that area gets cleared, we could see a move toward the psychological level of $4,000.
📌 However, if ETH faces rejection at $3,100 – we may see a pullback to retest the breakout zone around $2,822 – $2,662 before another leg up.
📈
RSI is currently neutral and has room to climb – a good sign for further upside
Volume on the breakout was strong, confirming that smart money is stepping back in
🎙️
So here’s the bottom line:
✅ ETH successfully broke out of the $2,600–$2,822 resistance zone
✅ Weekly candle closed strong with high volume
✅ Uptrend looks ready to continue
🎯 Short-term target: $3,100 – $3,750
🎯 Long-term breakout target: $4,000+
📌 Support zone to watch: $2,822 – $2,662 (for potential retest)
⚠️ Disclaimer: This is just my personal analysis – not financial advice.
Always do your own research and manage risk properly!
👉 Follow Dat Vinh Airdrop for more solid crypto insights every week!
Ethereum Just Hit Resistance — Will It Explode or Recoil?Ethereum has powered through previous resistance levels, riding a clean ascending trendline and now entering a key supply zone around $3,000. While bulls have dominated the recent run, price is now brushing up against historical resistance with Stoch RSI entering overbought territory.
This is a pivotal area — if ETH breaks through with volume, the next target sits near $3,400–$3,700. But if momentum fades, a pullback into the $2,800 zone or even a retest of trendline support could offer better entries.
Momentum is hot, but traders should stay sharp — this zone has rejected price before. Smart money watches reactions, not just breakouts.
