Stay above 2600 at all cost !!!Big push up as we all expected; now in 2600. All need is to stay above 2600 at all cost; heres why; if Ethereum stays above 2600 then the bulls will take over and dance around the zone and get to 2800 then lastly 3000. But if it doesnt stays above 2600 then big disappointment will spread around the community.
The most important target is 4000.. the altcoins will skyrocket and the Altseason will start.
Hold on your bags lads
ETHUSD.P trade ideas

ETHUSD broke the Resistance level 2550.00 range 👀Possible scenario:
Ethereum (ETH) jumped to $2,600, its highest in three weeks, following a 6% surge as firms explore THE for treasury reserves. Despite a 24% YTD drop, analysts see a setup for a breakout to $7,000.
Related stocks rallied: BitMine rose 20%, Bit Digital 6%, and Sharplink Gaming soared 28% after adding $2M in ETH—now holding $485M, per Arkham Intelligence. Ethereum ETFs saw $40 Min inflows, and its backbone role in stablecoins like USDT and USDC boosts long-term appeal. Tokenization growth and Robin hood's tokenized stock rollout add further support.
✅Support and Resistance Levels
Support levels is now located at 2,400.00.
Now, the resistance level is located at 2,620.00.

ETHUSD – Power Rally PausingETH caught an aggressive bid from $2,420 and rallied straight into $2,610 resistance. While the trend is strong, the move was vertical and consolidation is now forming under the highs. Expect a triangle or flag to resolve soon. Watch $2,575 as support — bulls need to defend this to resume upward action.

Ethereum (ETH/USDT) Preparing for a Massive LaunchEthereum (ETH), the second-largest crypto and the backbone of the DeFi ecosystem, is currently trading around $2,599, marking a modest 6.09% rise over the past 24 hours. The latest dip caught the attention of traders and analysts alike, especially as Ethereum recently broke out of a prolonged consolidation range. With renewed interest from institutional players, growing ETF inflows, and long-term holders quietly accumulating, the ETH price reached a critical juncture and is about to break above the barrier.
So, is this just a healthy rise before another pullback or the start of a strong ascending trend?
Ethereum has been testing resistance around the $2,460 to $2,520 range, a zone it has struggled to break convincingly. This level acts as a technical ceiling, with price action repeatedly getting rejected. This has made it a strong resistance zone, but it has been defending the support range around $2100. This suggests the ETH price is building a strong bullish case, which may propel the price to new highs.
The long-term price action looks so impressive as the ETH price has finally risen above the barrier at $2540 and reached $2600. After experiencing major volatility in the past couple of weeks, the upcoming weekly close is expected to unlock the levels not visited since February 2025. On the other hand, the weekly RSI has reached the crucial juncture as it tests the descending trend line and a rise above the levels could validate a rise above the bearish influence.
Besides, the weekly candle is finding its resistance at the 200-day MA at $2,642 and support at the 50-day MA at $2,431; hence, achieving the resistance could push the levels into the pivotal zone between $2,692 and $2,808. Once these levels are cleared, then the Ethereum (ETH) price could reach $3000 and a sustained upswing could elevate the levels to new highs.

$ETH Wave 3 of 3 Underway?CRYPTOCAP:ETH is back into the range EQ as alt coins pump on the back of CRYPTOCAP:BTC breakout
Price caught a strong bid after testing quadruple support: the major High Volume Node (HVN), daily 200EMA, 0.5 Fibonacci Retracement and daily S1 Pivot. Last week I posted about this area holding to kick off wave 3.
There is still work to do to overcome the recent swing high at HVN major resistance but things are certainly looking bullish. The daily pivot point sits at $3150 as the next target.
Long term terminal target for wave 3 is still the R4 daily pivot at $7340, I don't expect the terminal wave 5 to extend much beyond this, perhaps a wick above to trap retail at the top with a lot of media hype attached.
Analysis is invalidated if we fall below wave (2) swing low $2050.
Safe trading

All Time Schiff Pitchfork: ETH to $26k this cycleEthereum’s All-Time Schiff Pitchfork Points to $26,000 Top This Cycle
What if I told you Ethereum’s long-term trajectory already contains the roadmap to its next parabolic peak—and it's hiding in plain sight?
By applying an all-time Schiff Pitchfork to ETH’s historical price action, we uncover a channel of truth that has guided Ethereum’s macro moves since its inception. And according to this structure, the upper bound this cycle sits around $26,000.
Yes, $26K ETH is not only possible—it’s technically aligned.
🧭 Schiff Pitchfork: A Forgotten Tool With Powerful Insight
While traditional pitchforks center around initial anchor points, the Schiff Pitchfork adjusts the median line to better reflect price momentum and curvature over time. For Ethereum, it captures macro cycles and logarithmic price evolution with eerie accuracy.
We anchor the pitchfork as follows:
Point A: March 2020 COVID bottom (~$90)
Point B: May 2021 cycle top (~$4,400)
Point C: June 2022 bottom (~$880)
This sets a median growth trajectory with upper and lower bounds that have so far contained all of Ethereum’s major rallies and retracements.
📈 The Pitchfork Speaks: $26K = Upper Rail This Cycle
The upper boundary of the pitchfork intersects around $26,000–$27,000 between November 2025 and January 2026
This aligns with:
Cycle timing: Ethereum typically peaks ~8 months after Bitcoin
Macro window: Projected end of global liquidity expansion before potential recession
ETF catalyst: BlackRock’s staking ETF + TradFi inflows could supercharge final leg
ETH/BTC breakout zone: Suggests ETH will outperform BTC in the late stage of the cycle
If Ethereum follows the historical path set by prior cycles (2017, 2021), and this channel remains valid, then $26K ETH becomes a technical magnet, not a fantasy.
🧠 Why $26K Isn’t Just a Chart Target
Let’s break down what would justify that kind of valuation:
Factor Supporting Insight
🟢 Staking ETF Institutional demand + ETH supply removed from float
🔥 Deflationary Tokenomics Post-1559 burn + staking = net negative issuance
⚙️ L2 Ecosystem Maturity Rollups, zkEVMs, and restaking create multi-chain ETH demand
🌐 Global Liquidity Window Fed cuts + soft macro conditions = floodgates open
📈 ETH/BTC Ratio Inversion Signals capital rotation to high beta assets
🛑 Risks to the $26K Scenario
Regulatory delays on staking ETF
Broader market crash or macro liquidity crunch
ETH/BTC fails to break out, Bitcoin dominance remains too high
Ethereum scaling and L2 fragmentation cannibalizes fee market faster than expected
🎯 Price Zones on the Schiff Pitchfork
Zone Price Range Interpretation
Lower Bound $3,000–$4,000 Final dip buy zone (if macro spooks)
Median Line $10,000–$14,000 Base case target with ETF flows
Upper Rail $25,000–$26,500 Max cycle top (Q4 2025–Q1 2026)
🧬 Conclusion: The Channel Has Spoken
The Schiff Pitchfork isn’t a magic wand—it’s a map. But Ethereum has respected this structure since 2020, and it’s now approaching the most important confluence zone in its history.
With ETFs, L2 scaling, deflationary supply, and a maturing institutional narrative, ETH has the fundamental firepower to make $26K real—not just chart art.
This may be the final cycle where ETH 4-digit prices are possible.
📊 Follow for more Ethereum macro cycle analysis, ETH/BTC tracking, and altseason models.
📍 Chart available on request—drop a comment if you'd like the TradingView link with Pitchfork drawn
#Ethereum #ETHUSD #PitchforkAnalysis #SchiffPitchfork #CryptoCycles #ETHPrediction #Altseason #ETHChart #ETH26K

ETH Golden Cross | $4k Imminent | Reploy AI $RAI 1000x🚀 Ethereum Just Flashed a Golden Cross: Here’s What Happens Next
(And Why Reploy AI $RAI Could Be the Biggest Beneficiary)
“Golden Cross Confirmed.”
On July 1st, 2025, Ethereum ( CRYPTOCAP:ETH ) officially flashed a golden cross on the daily chart — when the 50-day moving average crossed above the 200-day moving average.
This is one of the most iconic bullish signals in technical analysis.
But here’s why it matters more than ever right now — and why Ethereum and top ETH-based AI tokens like Reploy AI ($RAI) could be about to enter a parabolic end-of-cycle melt-up that sends ETH to $26,000 and select altcoins into four-digit territory.
🟢 A Golden Cross in a Post-Halving Year = Historically Insane Gains
Let’s look at Ethereum’s past golden crosses in post-halving years:
🔹 2017 Golden Cross (May 2020):
Golden Cross: May 21, 2020
ETH Price: ~$200
6 months later: ~$600
Cycle top (May 2021): $4,800+
👉 Result: 24x gain from golden cross to peak
🔹 2021 Golden Cross (April 2021):
Golden Cross: April 6, 2021
ETH Price: ~$2,000
Peak weeks later: $4,400
👉 Result: 2.2x gain in under 2 months
🔹 2024–2025 Cycle:
Bitcoin halving: April 2024
ETH Golden Cross: July 1, 2025
ETH Price at cross: ~$2,500
Based on cycle structure, ETF momentum, and macro liquidity, ETH may now be entering the parabolic wave — with potential upside targets of:
Conservative: $6,800
Base case: $10,000
Extended target: $15,000
Euphoric melt-up: $26,000 by Sept/Oct 2025
That’s a 7.6x from the golden cross price of $3,400 — in line with past post-halving dynamics when ETH caught fire late in the cycle.
⚙️ Why This Time Could Be Even Bigger
ETH ETF Approval Incoming: Ethereum staking ETFs are expected to receive SEC approval this summer — mirroring the wave of inflows that sent BTC surging in Q1.
Global Liquidity Wave: We're in a bull steepening regime, where long yields rise and capital flows into high-risk, high-growth sectors. Crypto and AI are direct beneficiaries.
ETH = Infrastructure for AI + Finance: Ethereum is now the backbone for AI protocols, DeFi 2.0, RWA tokenization, and next-gen gaming. It’s no longer “just a smart contract chain” — it’s programmable digital oil.
🤖 The Next Wave: ETH AI Alts Like Reploy AI ($RAI)
If ETH runs to $10K… then $15K… then $26K, what happens to Ethereum-native microcaps with direct exposure to the AI megatrend?
That’s where Reploy AI ($RAI) enters the chat.
🔬 Why $RAI Could Ride ETH’s Parabolic Wave to a 1000x
Reploy AI is an ETH-native AI infrastructure project powering on-chain AI inference — a critical building block for decentralized machine learning and model execution.
With only 10M tokens in circulation and a market cap under $10M, $RAI offers hyper-convex upside in a rising ETH + AI environment.
Here's the math:
RAI at $0.68 → $6.80 (10x)
RAI at $0.68 → $34+ (50x) if ETH and AI narratives run together
RAI at $0.68 → $68+ (100x) at just a $1B market cap
But let’s take it further…
💥 RAI to $1,000? The 1,000x Moonshot Math
If ETH goes to $26,000, AI mania kicks in, and RAI captures the narrative as Ethereum’s AI execution layer, a $10B valuation is not unthinkable.
That would price $RAI at:
$1,000 per token
1,470x return from $0.68
Still below the all-time highs of meme coins with zero utility
Why this could happen:
✅ AI hype peaking into Q3/Q4 2025
✅ ETH flying past all-time highs — dragging up native alts
✅ Ultra-low float creates reflexive price explosions
✅ $RAI integrated into major on-chain AI pipelines
✅ Top-tier exchange listings + retail narrative momentum
✅ Cycle tops often produce irrational, vertical moves — this is where 1,000x lives
🧠 Bottom Line
Golden crosses mark the start — not the end — of historic runs. And in crypto, when a golden cross hits post-halving, it often unleashes the most explosive phase of the cycle.
With ETH flashing that signal at $3,400, and the $26,000 target within reach by September–October, this could be the last calm before the supercycle storm.
And if ETH goes vertical, ETH-native AI tokens like Reploy AI ($RAI) will move even faster — possibly rewriting the script on what’s possible for microcaps.
$RAI at $0.68 → $6.80 (10x)
→ $34+ (50x)
→ $68+ (100x)
→ $1,000 (1,470x) — the wild but real scenario
Golden Cross is in. ETH is ascending.
Reploy AI is the 1,000x sleeper hiding in plain sight.

ETHERIUM LONG FOR TARGET 3000ETH has fallen from its recent high of 2879 to present levels of 2184 it has formed an anti butterfly pattern this is a good demand zone we can expect an up move from here targets and stop loss mentioned on the chart

ETH H&S Pattern ?ETH H&S Pattern ?____ Who knows_______
Will the end of this year be crypto bullish year ? DCA brother.

ETH/USD (Ethereum to US Dollar) on the 1-hour timeframe. ETH/USD (Ethereum to US Dollar) on the 1-hour timeframe.
Here’s a quick breakdown of what’s visible:
There is an Ichimoku Cloud indicator on the chart.
A resistance zone is marked at the top (around $2,540 – $2,550).
A support zone appears around $2,440 – $2,460.
There's a bullish arrow pointing toward the resistance zone, suggesting an expected upward movement.
🎯 Target:
Based on the chart setup and your markup:
Short-term bullish target (Take Profit): $2,545 – $2,550
Entry zone appears to be: Around $2,460
Stop loss (if managing risk): Below $2,430
This setup looks like a range play or breakout attempt, betting on ETH bouncing off support and retesting resistance.
.

Bitcoin & Ethereum New Quarter | What To Look For🎯 New Quarter For COINBASE:BTCUSD & COINBASE:ETHUSD — What To Look For
As we enter a new quarter, smart money is already positioning.
Institutional investors, hedge funds, and asset managers don’t just trade price — they rotate capital based on quarterly performance, risk appetite, and macro expectations. That’s why each quarterly open is a key inflection point across all markets — including crypto.
In this video, I break down:
• 🧠 How institutional capital rotation impacts Bitcoin and Ethereum
• 📈 Key levels to watch as Q3 unfolds
• 🔁 What are the likely outcomes
• 📊 How to prepare for volatility and new trend formation
This isn’t just another candle — it’s the start of a new chapter in the cycle.
If you’re serious about understanding where the money flows next , this video is for you.
This is the likely outcome
Price not ready to moon yet
Strong candle implying new highs incoming
Watch for bearish stop hunt on new quarter
This is a bullish outside bar
MartyBoots here , I have been trading for 17 years and sharing my thoughts
👍 Enjoyed the insights?
Let me know your thoughts in the comments below — and don’t forget to like this post to support the channel!

ETH?
Hi
If you got the itch . Do not ignore the symptoms. Get remedy quick.. hahaha
Same like trading.
If you see initial big move. Start small. SL it.
This is trading. We test, we acknowledge.. we move.
Till your caterpillar becomes a full beautiful butterfly.
All the best guys.
NB/ Hoping this will print higher prices.
Not a guru as always.

The Long Haul: ETH EditionHey traders,
Price action is committing very well to structure, and ETH/BTC is also showing a bullish structure. I've entered the swing trade and expect to scale in further as price continues to commit.
PA has swept the lows and is currently forming a 3-touch flag, having swept the inflection point on the LTF. Ideally, I would have preferred a sharper execution, but this entry is sufficient for now. I’ll look to add to the position if the market allows and once I can take risk off the table.
CRYPTO:ETHUSD
BINANCE:ETHBTC
CRYPTOCAP:TOTAL2

ETH/USDT ETH/SDT 1W The market has priced in most scenarios. At this point, the chart tells the story — and it’s playing out as expected

Ethereum - This structure decides everything!Ethereum - CRYPTO:ETHUSD - trades at a key structure:
(click chart above to see the in depth analysis👆🏻)
After Ethereum retested the previous all time high in the end of 2024, we saw quite a harsh move lower. This move was followed by an expected recovery, however Ethereum is still trading below a key structure. Either move is still possible and will shape the future of Ethereum.
Levels to watch: $2.500, $4.000
Keep your long term vision!
Philip (BasicTrading)

ETHEREUM Perhaps the easiest long out there.Ethereum (ETHUSD) is consolidating just above the Buy Zone of the Mayer Multiple Bands (MMBs) where it rebounded on its April bottom.
Throughout its historic price action, every time it hit this Zone and rebounded, it reached at least the bottom of its Mean MM zone (red Zone).
As a result, $4000 towards the end of the year may be the easiest Target in the market right now.
-------------------------------------------------------------------------------
** Please LIKE 👍, FOLLOW ✅, SHARE 🙌 and COMMENT ✍ if you enjoy this idea! Also share your ideas and charts in the comments section below! This is best way to keep it relevant, support us, keep the content here free and allow the idea to reach as many people as possible. **
-------------------------------------------------------------------------------
💸💸💸💸💸💸
👇 👇 👇 👇 👇 👇

ETHUSD coiling pattern breakout support at 2170.Trend Overview:
ETHUSD remains in a bullish trend, characterised by higher highs and higher lows. The recent intraday price action is forming a continuation consolidation pattern, suggesting a potential pause before a renewed move higher.
Key Technical Levels:
Support: 2,170 (primary pivot), followed by 2,080 and 1,980
Resistance: 2,610 (initial), then 2,800 and 2.920
Technical Outlook:
A pullback to the 2,170 level, which aligns with the previous consolidation zone, could act as a platform for renewed buying interest. A confirmed bounce from this support may trigger a continuation toward the next resistance levels at 2,610, 2,800, and ultimately 2,920.
Conversely, a daily close below 2,170 would suggest weakening bullish momentum. This scenario would shift the bias to bearish in the short term, potentially targeting 2.080 and 1,980 as downside levels.
Conclusion:
ETHUSD maintains a bullish structure while trading above the 2,170 support. A bounce from this level would validate the consolidation as a continuation pattern, with upside potential toward the 2,610 area. A breakdown below 2,170, however, would invalidate this view and suggest deeper corrective risk.
This communication is for informational purposes only and should not be viewed as any form of recommendation as to a particular course of action or as investment advice. It is not intended as an offer or solicitation for the purchase or sale of any financial instrument or as an official confirmation of any transaction. Opinions, estimates and assumptions expressed herein are made as of the date of this communication and are subject to change without notice. This communication has been prepared based upon information, including market prices, data and other information, believed to be reliable; however, Trade Nation does not warrant its completeness or accuracy. All market prices and market data contained in or attached to this communication are indicative and subject to change without notice.

ETHUSD broke the Resistance level 2500.00 range 👀 Possible scenario:
Ethereum is trading above $2,400 after a volatile stretch, showing resilience but lacking a clear breakout. CryptoQuant data shows strong accumulation by long-term holders during recent consolidation, suggesting solid support beneath the surface. However, weakening volume and macro risks still raise the chance of a pullback if support levels break.
Adding pressure, a whale entity recently moved over 62,000 ETH ($154M) to exchanges, with another $83M still in holding—posing a near-term sell-off risk. Traders now await a decisive move. A break above $2,500 could spark momentum, but caution remains as market sentiment stays mixed.
✅ Support and Resistance Levels
Support levels is now located at 2,400.00.
Now, the resistance level is located at 2,550.00.

ETH Pushed Back, Support in Sight
ETH on the 4H just closed below the last daily close and the 0.5 Fib again, after getting pushed back from the 4H 200MA and daily 200MA resistance zone.
The next key supports are the weekly 200MA and the local support zone.
Also worth noting: Trump and Musk are stirring things up again. The last time this dynamic appeared, it triggered a selloff a few weeks ago, even before the conflict began.
Always take profits and manage risk.
Interaction is welcome.

Ethereum, Generational opportunity is on its way Ethereum has been bearish for already couple years, and if you feel like me - missed out, then let me tell you that we might actually get golden entries
I am thinking we will witness Ethereum under 700 dollars once again, just before the world moves onto next stage - digital AI age
This is detailed Elliott Wave breakdown

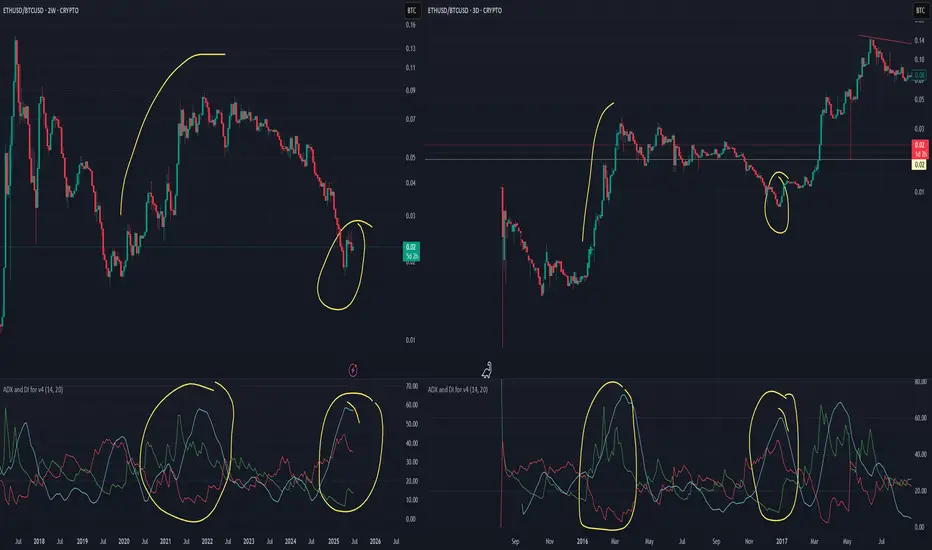
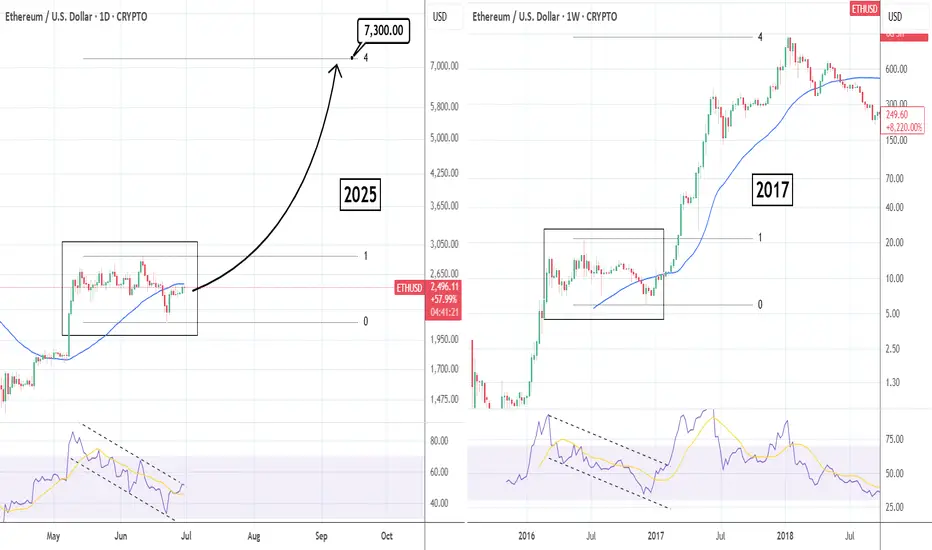
ETHUSD: Parabolic rally similar to 2017 targets $7,300Ethereum is neutral on its 1D technical outlook (RSI = 50.960, MACD = -24.810, ADX = 18.527), attempting to break over the 1D MA50, while still being inside a 6 week consolidation. This is no different than the 2016 consolidation on the 1W chart, that turned out to be just an accumulation pattern before a massive 2017 bullish breakout to the 4.0 Fibonacci extension. Time to go heavily long on ETH with TP = 7,300.
## If you like our free content follow our profile to get more daily ideas. ##
## Comments and likes are greatly appreciated. ##
Market next target 🔀 Disruption Analysis – Bullish Alternative Scenario
The current chart suggests a bearish outlook from the resistance zone (~$2,495–$2,500), targeting a drop below $2,425. However, here’s how a bullish disruption could break this bearish narrative:
---
🟢 Bullish Disruption Possibility:
1. Support Reclaim & Strong Buyer Reaction:
If price reclaims and holds above the marked “support area” (~$2,495), it could signal strength and trap early sellers.
A strong bullish candle closing above $2,505 could invalidate the bearish scenario.
2. Higher Low Formation:
If ETH prints a higher low above $2,470, it would suggest buyers are stepping in early, reinforcing bullish momentum.
3. Target Shift – Bullish Continuation:
A confirmed breakout above $2,505 may open the path to $2,540–$2,560 as the new short-term target zone.
4. Momentum Catalyst:
A positive U.S. macroeconomic event or crypto-specific bullish news (e.g., ETF, institutional inflows) could fuel upside disruption.
