Stop messing around and buy ETHUSDMy last post didn't include the entry, stop loss and TP. I've adjusted it now. The entry is below 2550.
Enjoyy
ETHUSD.P trade ideas

ETHUSD bullish continuation. I'm buying!!ETHUSD is bullish and this purge is an opportunity to buy lower. I've been calling this ETHUSD since 1600. Add more buys now. We are pushing for that ATH.
Ya gaize

Long Setup After Accumulation BreakoutAfter a clear accumulation phase, we've seen a manipulation spike followed by distribution. Price has now pulled back to the top of the previous accumulation zone, which I view as a strong demand area.
I'm entering long from this pullback with a target around $3,000.

$eth long 🧠 Trade Idea
Ethereum has pulled back sharply after testing resistance at the $2,869–$2,906 zone. The current price around $2,527 shows signs of stabilizing just above previous demand ($2,444–$2,368), offering a potential long opportunity with clearly defined risk and multiple upside targets.
🎯 Trade Setup
Entry: $2,527.41 (market)
Stop Loss: $2,368.86 (below recent demand wick)
Take Profit Targets:
TP1: $2,641.16 (initial reaction level)
TP2: $2,752.67 (local high)
TP3: $2,869.37 (supply zone)
TP4: $3,024.97 (major resistance)
Extended TP: $3,107.96–$3,196.80 (macro trendline retest)

Locked in – 4H vs 30min Timeframes
When trading high leverage, I need a sharp overview of the market to manage risk and take profits.
Having a parallel view of the 4H and 30min timeframes helps a lot with that.
Right now, on the 30min chart, we’ve had two clean retests of key high timeframe levels :
– the 0.5 Fib
– the weekly 200MA
These retests may justify scaling into a long position , with a stop-loss placed just below the 0.5 Fib or the weekly 200MA.
The structure (MLR > SMA > BB center) supports a long entry, but PSAR hasn’t flipped bullish ye t, so this setup requires caution—especially if price starts closing below these levels. If that happens, it’s better to wait before scaling in .
On the 4H timeframe, selling volume spiked on the last candle , but keep in mind:
→ 3D volume bars have been decreasing , suggesting selling pressure might be weakening overall.
I’ll do my best to keep consistent updates on this parallel timeframe view—it’s proving to be very helpful.
Always take profits and manage risk.
Interaction is welcome.

ETH correction set ups big buyAmongst the geopolitical tensions and market uncertainty has ETH just had its big correction before a massive rise in the price?
The 4 hour candle suggests that in the coming days to month it will reach a point at which we will break the trend line in either a bullish reconfimration or a switch to bearish intentions.
I suspect that we will se big price action in the next few days

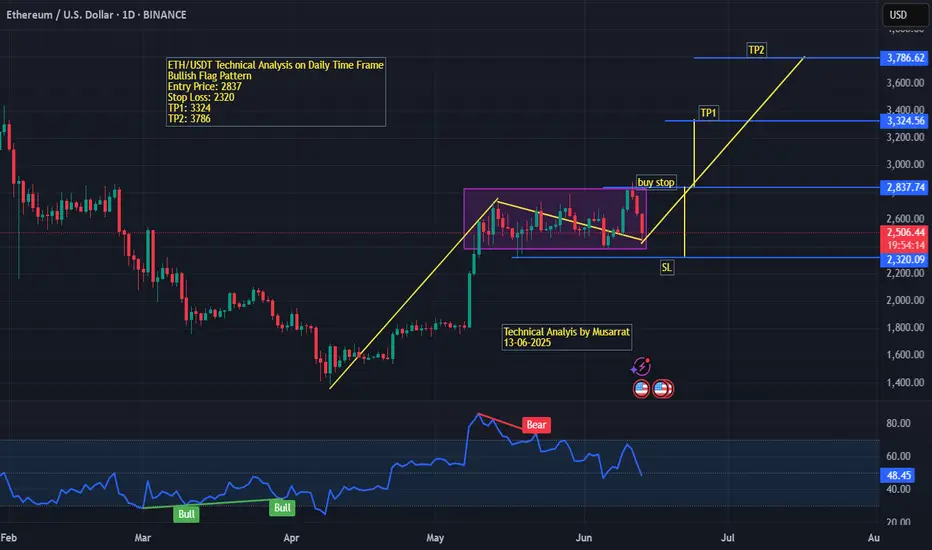
ETH/USDT (Daily Time Frame) Technical Analysis – ETH/USDT (Daily Time Frame)
Chart Date: June 13, 2025
Pattern: Bullish Flag
Ethereum (ETH) against USDT is currently forming a bullish flag pattern on the daily chart, indicating a potential continuation of the previous uptrend. The price action shows a sharp bullish rally followed by a consolidation phase within a descending channel (flag), which is typical in such setups.
Entry Point: The breakout level is marked at $2,837, which serves as a potential buy-stop trigger.
Stop Loss (SL): Placed at $2,320, just below the support zone and the lower boundary of the consolidation flag. This helps protect against a false breakout.
Target 1 (TP1): $3,324, derived from the height of the flagpole projected from the breakout point.
Target 2 (TP2): $3,786, a more aggressive upside target in line with the full measured move of the flag pattern.
The RSI indicator at the bottom reflects a bearish divergence during the latter part of the flag, which led to the current retracement. However, previous bullish divergences in March and April triggered strong upswings, indicating that momentum could return if price breaks above resistance.
The price currently trades at $2,522, below the breakout level, suggesting traders should wait for confirmation of the breakout before entering the trade.
Conclusion:
This chart sets up a high-probability bullish continuation trade. Traders should monitor for a strong breakout above $2,837 with volume confirmation before entering long. Risk management is key, with a tight SL near $2,320 and clear profit-taking zones at TP1 and TP2.
ETHUSD likely to reach 2474 levelETHUSD is in uptrend and has possible reversals. Once the reversal is confirmed, price is likely to reach 2474 level.
All the analysis is for educational purpose only. Not an investment or financial advise.

ETH will rebound.What you're looking at is a textbook rising channel, well-respected, clean, and elegant in its symmetry. For weeks, ETH has climbed this structure with rhythmic oscillations between support and resistance, almost as if the market were guided by a ruler and compass. Price action respected both boundaries with admirable discipline, making this a trader’s dream for range-based strategies. Now, that structure is being tested sharply.
The most recent candle shows a strong drop from the upper boundary straight to the lower. It didn't drift down gently but fell with force. Yet despite that intensity, price has landed precisely on the lower boundary of the channel. This is often where markets pause and reset. If the structure remains intact, and history offers any guide, this could mark the beginning of a fresh upward leg. The drop may have been more about clearing excess than breaking trend.
There is reason to believe in the bounce. The channel has been reliable, and deep tests like this often come before a recovery, not a collapse. If price begins to stabilize here, even modestly, it would suggest that the market still respects this structure. The next few candles will matter, but for now, the channel is holding. And when a structure like this holds after such a flush, it can produce some of the strongest moves back to the top.

ETH $700 SWING SHORT MUST SEENext Prediction
$2600 to $3000
$3009 to $2300
⸻
Since the full Wedge failed to play out fully so now if we go up and inside the wedge has a higher higher giving us a huge swing
Target:
$2,300 is the full measured move if the rising wedge pattern plays out cleanly and fully resolves.

Bullish bounce?Ethereum (ETH/USD) is falling toward the pivot and could bounce to the 1st resistance which has been identified as a pullback resistance.
Pivot: 2,589.94
1st Support: 2,547.44
1st Resistance: 2,712.37
Risk Warning:
Trading Forex and CFDs carries a high level of risk to your capital and you should only trade with money you can afford to lose. Trading Forex and CFDs may not be suitable for all investors, so please ensure that you fully understand the risks involved and seek independent advice if necessary.
Disclaimer:
The above opinions given constitute general market commentary, and do not constitute the opinion or advice of IC Markets or any form of personal or investment advice.
Any opinions, news, research, analyses, prices, other information, or links to third-party sites contained on this website are provided on an "as-is" basis, are intended only to be informative, is not an advice nor a recommendation, nor research, or a record of our trading prices, or an offer of, or solicitation for a transaction in any financial instrument and thus should not be treated as such. The information provided does not involve any specific investment objectives, financial situation and needs of any specific person who may receive it. Please be aware, that past performance is not a reliable indicator of future performance and/or results. Past Performance or Forward-looking scenarios based upon the reasonable beliefs of the third-party provider are not a guarantee of future performance. Actual results may differ materially from those anticipated in forward-looking or past performance statements. IC Markets makes no representation or warranty and assumes no liability as to the accuracy or completeness of the information provided, nor any loss arising from any investment based on a recommendation, forecast or any information supplied by any third-party.

How Wall Street Will Play ETH this Bull CycleI think once that stable coin bill is approved, it will be very bullish for ETH.
I have ETH going to about ~8k or ~9k sometime this cycle, conservative estimate.
I'm thinking an upward trajectory of about 100% from the previous all time high.
Please let me know your thoughts on this one. Thanks.

UPDATE ON ETH SELL ,Anything above $2780 is a good sellUPDATE ON ETH SELL
Anything above $2780 is a good sell
Targeting $2670 or Down
Not a Financial advice

ETH PERPETUAL TRADE, Sold From $2695ETH PERPETUAL TRADE
ETH SELL SETUP
Currently $2695
Sold From $2695
(Trading plan If ETH go up to $2750
will add more shorts)
Expecting target $2630 OR DOWN
In the event of an early exit,
this analysis will be updated.
Its not a Financial advice

ETH/USDT – Bullish Setup UnfoldingEthereum has broken a key market structure, confirming bullish momentum. After the structure break, we saw a clean retest on our order flow level, signaling strong buyer interest.
Current Outlook:
📈 ETH is showing solid bullish continuation signs
📊 Higher highs and higher lows forming
🔁 Retest confirmation adds confluence
📍Key levels:
💡 My Strategy: Adding to long positions. As long as ETH holds above the retest zone, upside potential remains strong. I’m targeting the next major resistance zone.

#Eth/usd retest on daily timeframe Price break the privious high with a good volume. And make retest on the privious high. If price give a pullback than you make a long trade on this

ETH/USD LONG SETUPThe chart displays the Ethereum/U.S. Dollar (ETHUSD) price action on a 1-day timeframe. The price has broken through a descending channel, indicating a potential buying opportunity. A blue rectangle highlights a support zone, and a blue shaded area projects a potential price increase. The current price is around 2736.7. The chart suggests a possible reversal, with the price potentially rising. The overall trend appears to be shifting upwards. The price action is being monitored for potential trading opportunities. The chart provides a visual representation of the ETHUSD price movement, allowing for analysis and decision-making. Trading decisions can be made accordingly.
Entry: 2700/2420
Target : 4100
If you found this analysis helpful, don’t forget to drop a like and comment. Your support keeps quality ideas flowing—let’s grow and win together! 💪📈

ETH Breaks Out of Falling Wedge, Eyes $2800 TargetEthereum (ETH) has broken out of a falling wedge pattern, signaling a potential bullish move. If the breakout sustains, the price could rally towards the projected target in the $2800 region, based on the wedge’s height.

Ethereum Cooling Off After Explosive Push Past $2.87KEthereum (ETH) launched into a powerful rally that peaked near $2,875. Since then, it has flattened out and entered a sideways consolidation near $2,750. Momentum has cooled, but structure remains bullish unless $2,700 is breached.


ETHUSD SELL TRADEThe Relative Strength Index (RSI) is showing a downward trend, indicating weakening momentum. Additionally, the Moving Average Convergence Divergence (MACD) is showing a bearish crossover, further supporting the potential for a downward move
ETH is riding to meet WAVE 5 !hello traders
as you can see wave 4 is formed as an triangle .
we can consider it as an ABC too!
we can expect a niiiice wave 5 as an impulsive wave
